Educational nonprofits work with a powerful mission. They aim to improve learning outcomes, expand access to education, and create long-term social impact. However, passion alone does not drive results. Therefore, data-driven decisions play a crucial role in ensuring that programs stay effective, funds remain well-utilized, and stakeholders stay confident.
This is exactly where an Educational Nonprofits KPI Dashboard in Excel becomes essential.
In this in-depth and SEO-friendly guide, you will learn what an Educational Nonprofits KPI Dashboard in Excel is, why it matters, how it works, and how each worksheet supports better performance tracking. Moreover, this article expands your provided information with clear explanations, practical examples, advantages, best practices, and frequently asked questions. As a result, you can confidently use or implement this dashboard in real-world nonprofit operations.
Click to buy Educational Nonprofits KPI Dashboard in Excel
What Is an Educational Nonprofits KPI Dashboard in Excel?
An Educational Nonprofits KPI Dashboard in Excel is a centralized and interactive reporting tool designed to track, analyze, and visualize key performance indicators related to educational nonprofit programs.
Instead of managing multiple spreadsheets for student enrollment, program costs, donor funds, outreach activities, and outcomes, this dashboard brings everything into one structured Excel file. Consequently, nonprofit leaders gain instant visibility into monthly performance, year-to-date progress, and comparisons with targets and previous years.
Because Excel remains widely accessible, this dashboard works well for nonprofits of all sizes. Moreover, teams can easily update data, adjust targets, and analyze trends without complex software.
Why Do Educational Nonprofits Need a KPI Dashboard in Excel?
Educational nonprofits face unique challenges. They manage limited budgets, strict donor reporting, and outcome-based goals. Therefore, they need clarity at all times.
An Educational Nonprofits KPI Dashboard in Excel helps because:
- It shows performance at a glance
- It improves accountability and transparency
- It supports data-driven decisions
- It simplifies donor and board reporting
- It reduces manual reporting effort
Instead of reacting late, nonprofit teams can act early. As a result, programs stay on track and deliver stronger educational impact.
What Are KPIs in Educational Nonprofits?
Key Performance Indicators (KPIs) measure how well an educational nonprofit achieves its goals. While KPIs vary by organization, most educational nonprofits track indicators related to reach, efficiency, quality, and impact.
Common KPI categories include:
- Program delivery KPIs
- Student or beneficiary KPIs
- Financial KPIs
- Operational KPIs
- Outcome and impact KPIs
When these KPIs stay scattered, analysis becomes difficult. However, when they sit inside a structured Excel dashboard, insights become instant.
Overview of the Educational Nonprofits KPI Dashboard in Excel
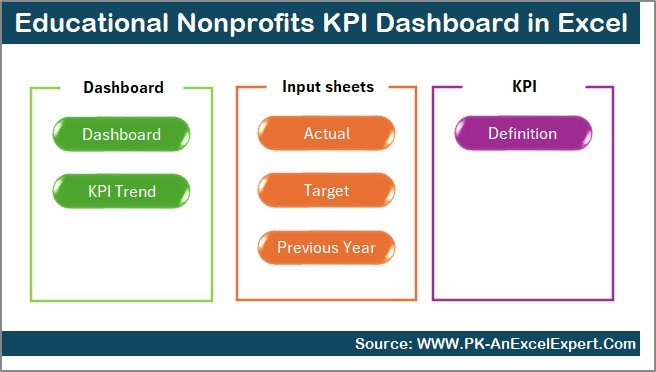
This Educational Nonprofits KPI Dashboard in Excel includes 7 well-structured worksheets, each designed for a specific purpose. Together, they create a complete performance management system.
Summary Page – Quick Navigation Hub
The Summary Page works as an index sheet for the entire dashboard.
What Does the Summary Page Do?
- Acts as a central navigation screen
- Includes 6 buttons to jump directly to key sheets
- Saves time by avoiding manual sheet switching
- Improves user experience for non-technical users
Because nonprofit staff often work under time pressure, this page ensures quick access to relevant sections.
Click to buy Educational Nonprofits KPI Dashboard in Excel
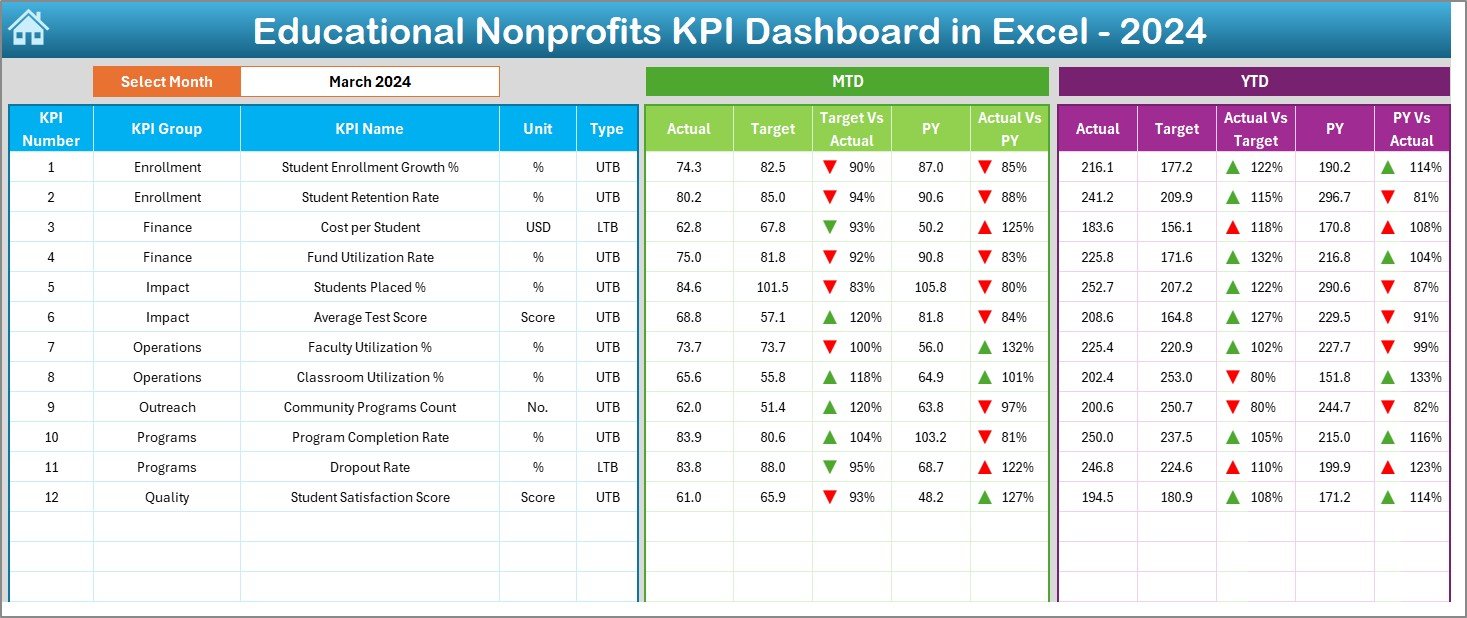
Dashboard Sheet – The Main Performance View
The Dashboard Sheet serves as the heart of the Educational Nonprofits KPI Dashboard in Excel.
How Does the Dashboard Sheet Work?
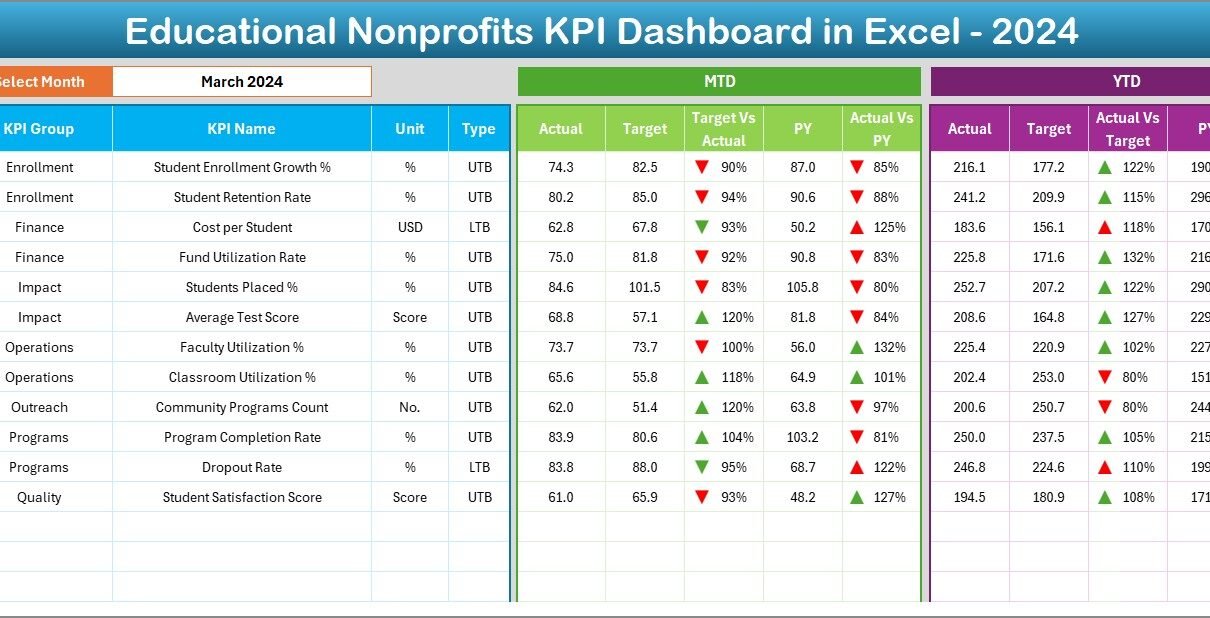
On cell D3, users select a Month from a drop-down list. Immediately, the entire dashboard updates for that selected month. As a result, users can review performance dynamically without changing formulas.
Click to buy Educational Nonprofits KPI Dashboard in Excel
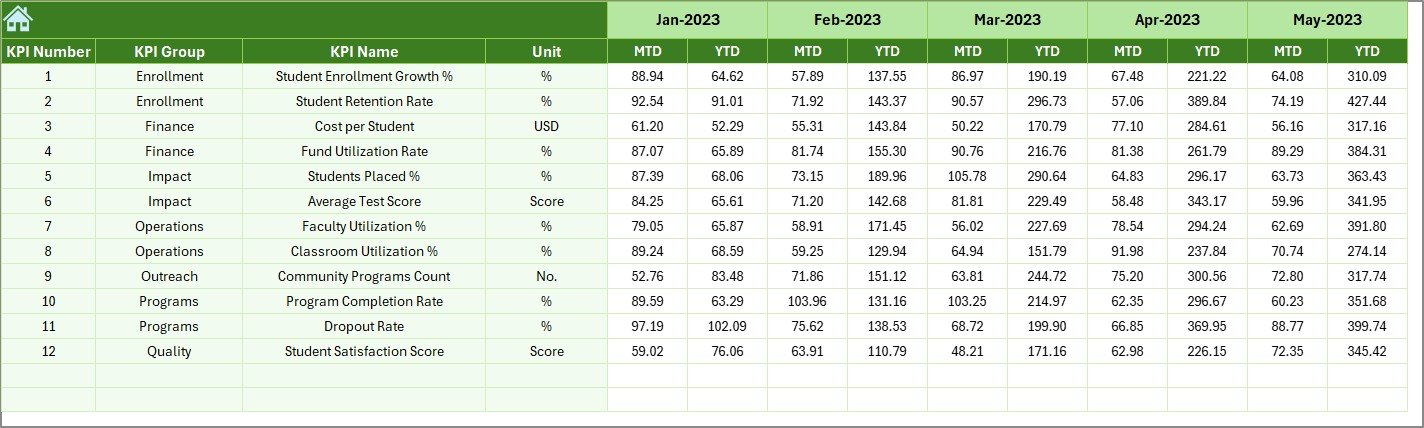
KPIs Displayed on the Dashboard
The dashboard shows both MTD (Month-to-Date) and YTD (Year-to-Date) metrics:
MTD Metrics Displayed
- Actual
- Target
- Previous Year
- Target vs Actual
- Previous Year vs Actual
YTD Metrics Displayed
- Actual
- Target
- Previous Year
- Target vs Actual
- Previous Year vs Actual
Why Conditional Formatting Matters
The dashboard uses up and down arrows through conditional formatting. These arrows instantly indicate performance direction. Consequently, users can identify issues and achievements without deep analysis.
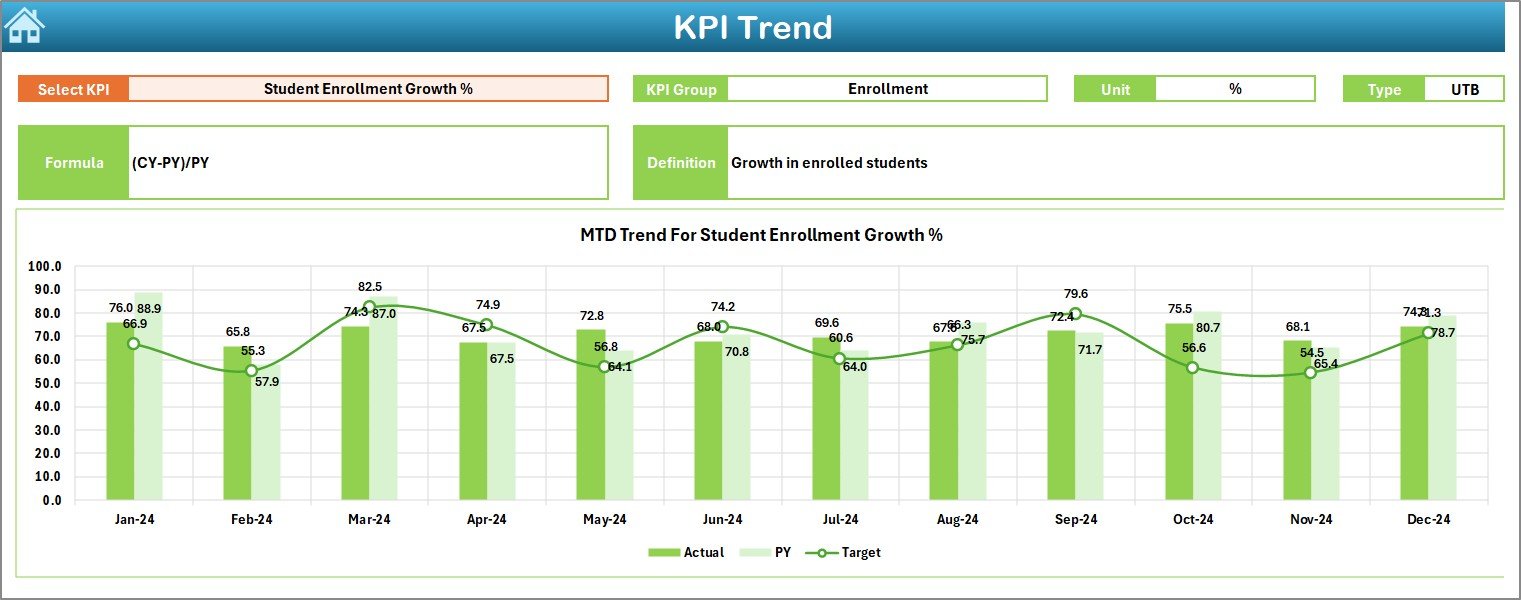
Trend Sheet – KPI Performance Over Time
The Trend Sheet focuses on in-depth KPI analysis.
How Do Users Interact with the Trend Sheet?
- Users select the KPI Name from a drop-down in cell C3
- The sheet updates automatically for the selected KPI
Information Displayed for Each KPI
For the selected KPI, the sheet shows:
- KPI Group
- Unit of KPI
- Type of KPI (Upper the Better or Lower the Better)
- KPI Formula
- KPI Definition
This structured information ensures clarity. As a result, users always understand what the KPI represents.
Trend Charts Included
- MTD trend chart for Actual, Target, and Previous Year
- YTD trend chart for Actual, Target, and Previous Year
Because trends reveal patterns, nonprofit leaders can identify improvement areas early.
Click to buy Educational Nonprofits KPI Dashboard in Excel
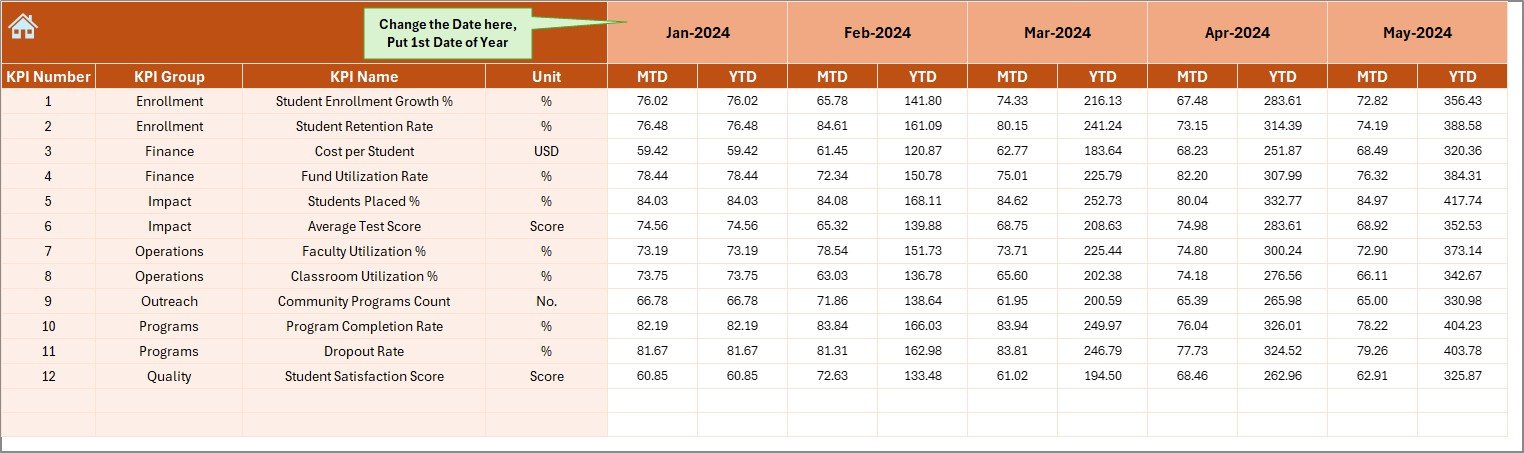
Actual Numbers Input Sheet – Data Entry Made Simple
The Actual Numbers Input Sheet allows users to enter real performance data.
How Does This Sheet Work?
- Users enter MTD and YTD actual values
- Month selection happens via cell E1
- Users input the first month of the year in cell E1
- Excel automatically adjusts calculations for the year
This setup reduces errors. Moreover, it ensures consistency across months.
Click to buy Educational Nonprofits KPI Dashboard in Excel
Target Sheet – Defining Performance Expectations
The Target Sheet focuses on goal-setting.
What Do Users Enter Here?
- Monthly target values for each KPI
- Both MTD and YTD targets
Because targets guide performance, this sheet ensures clear expectations. Consequently, teams stay aligned with organizational goals.
Click to buy Educational Nonprofits KPI Dashboard in Excel
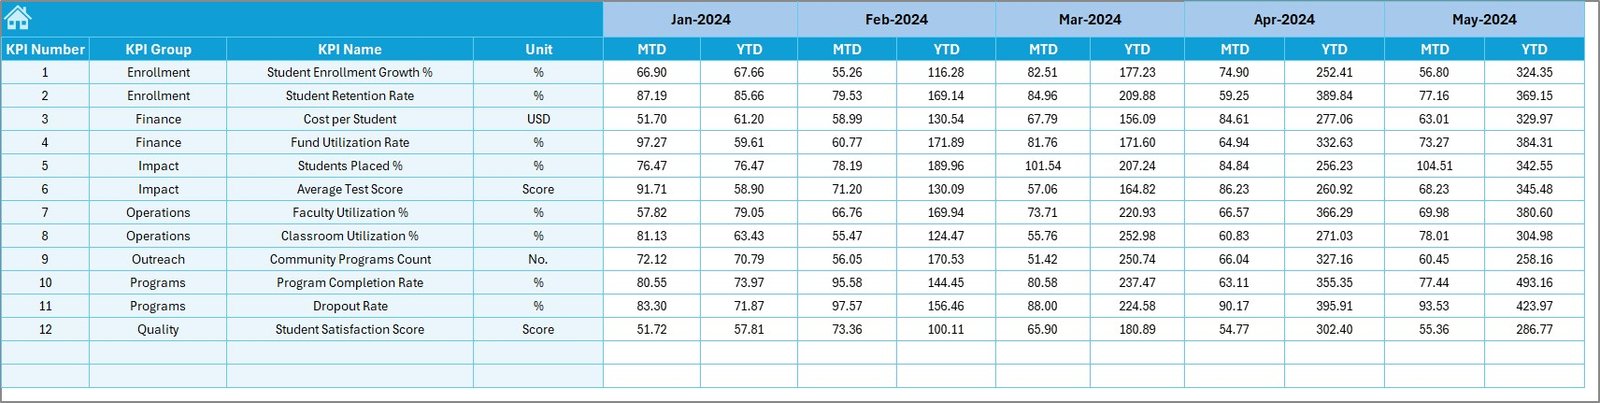
Previous Year Numbers Sheet – Historical Comparison
The Previous Year Numbers Sheet stores last year’s data.
Why Is This Sheet Important?
- Enables year-over-year comparison
- Helps evaluate progress and growth
- Highlights long-term trends
By comparing current performance with previous years, nonprofits can assess whether strategies deliver results.
Click to buy Educational Nonprofits KPI Dashboard in Excel
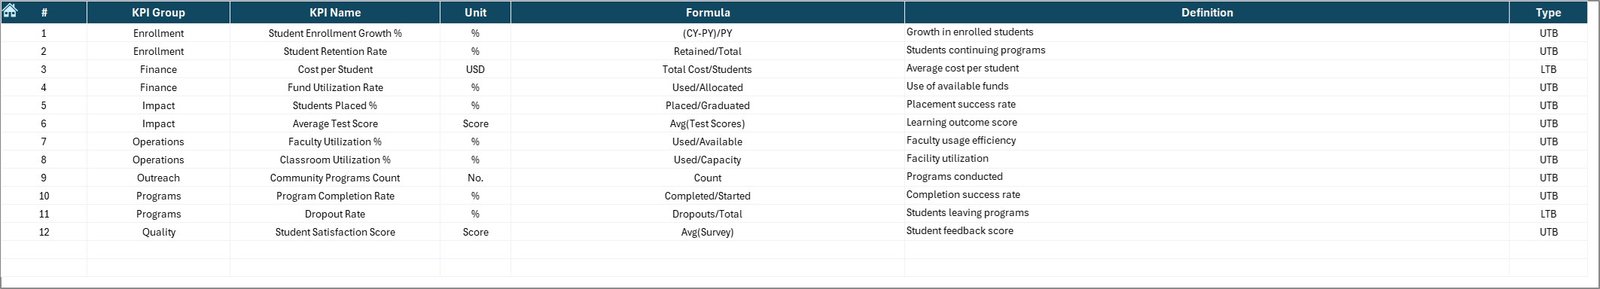
KPI Definition Sheet – Standardizing KPI Understanding
The KPI Definition Sheet acts as a knowledge base.
What Information Does This Sheet Contain?
- KPI Name
- KPI Group
- Unit of Measurement
- KPI Formula
- Detailed KPI Definition
This sheet ensures consistency. Therefore, everyone interprets KPIs the same way, regardless of role.
Click to buy Educational Nonprofits KPI Dashboard in Excel
Advantages of Educational Nonprofits KPI Dashboard in Excel
Using an Educational Nonprofits KPI Dashboard in Excel delivers several advantages.
- Centralized Performance Tracking
All KPIs sit in one file. As a result, users avoid confusion and duplication.
- Better Decision-Making
Because data updates instantly, leaders can make faster and smarter decisions.
- Improved Accountability
Targets, actuals, and comparisons remain visible. Therefore, accountability improves across teams.
- Time-Saving Reporting
The dashboard eliminates manual reporting. Consequently, staff can focus on mission-critical work.
- Donor and Board Ready
Clear visuals and trends make donor reporting simple and professional.
How Does This Dashboard Support Educational Impact?
Educational nonprofits measure success through outcomes, not profits. This dashboard supports impact by:
- Tracking program reach and completion
- Monitoring cost efficiency
- Evaluating year-over-year improvements
- Highlighting underperforming areas early
As a result, organizations can refine programs and improve learning outcomes.
Best Practices for Educational Nonprofits KPI Dashboard in Excel
To get the most value, follow these best practices.
- Define Clear KPIs
- Choose KPIs that align with your mission. Avoid tracking unnecessary metrics.
- Update Data Regularly
- Enter actual numbers monthly. Consistency ensures reliable insights.
- Use Realistic Targets
- Set achievable targets based on history and resources.
- Review Trends Monthly
- Trend analysis helps identify early warnings and opportunities.
- Train Your Team
- Ensure staff understands KPI definitions and dashboard navigation.
Common KPIs Used in Educational Nonprofits
While KPIs vary, many nonprofits track:
- Number of students enrolled
- Program completion rate
- Cost per student
- Fund utilization rate
- Donor retention rate
- Student performance improvement
This dashboard supports all such KPIs through flexible design.
Why Excel Works Best for Educational Nonprofits
Excel remains a preferred tool because:
- Most teams already use it
- No additional software cost exists
- Customization stays easy
- Data entry feels familiar
Therefore, Excel dashboards remain practical and scalable.
How This Dashboard Improves Transparency
Transparency builds trust. This dashboard:
- Shows clear targets and results
- Supports donor audits
- Simplifies internal reviews
- Encourages data-driven culture
As a result, stakeholders feel confident in the organization’s performance.
Conclusion
An Educational Nonprofits KPI Dashboard in Excel transforms scattered data into a structured performance system. By combining summary views, dynamic dashboards, trend analysis, and clear KPI definitions, this tool empowers nonprofit teams to track progress, improve accountability, and maximize educational impact.
Because the dashboard uses Excel, it stays accessible, flexible, and cost-effective. When nonprofits track what truly matters, they deliver stronger outcomes and build lasting trust with donors and communities.
Frequently Asked Questions (FAQs)
What is the purpose of an Educational Nonprofits KPI Dashboard in Excel?
The dashboard helps educational nonprofits track performance, compare targets, analyze trends, and make data-driven decisions using Excel.
Who should use this dashboard?
Nonprofit managers, program coordinators, finance teams, and leadership teams can all use this dashboard.
Can small educational nonprofits use this dashboard?
Yes, the dashboard suits organizations of all sizes because Excel remains simple and scalable.
How often should data be updated?
You should update actual numbers monthly to maintain accuracy and relevance.
Does this dashboard support donor reporting?
Yes, the dashboard provides clear visuals and comparisons that work well for donor and board reporting.
Can KPIs be customized?
Yes, users can define and modify KPIs in the KPI Definition Sheet based on organizational needs.
Why compare with previous year data?
Year-over-year comparison helps evaluate long-term progress and effectiveness.
Does the dashboard require advanced Excel skills?
No, basic Excel knowledge is enough to use and maintain this dashboard.
Visit our YouTube channel to learn step-by-step video tutorials
Watch the step-by-step video tutorial:
Click to buy Educational Nonprofits KPI Dashboard in Excel