Educational nonprofits work every day to improve access to education, enhance learning outcomes, and create long-term social impact. However, managing programs, donors, funds, and performance without clear visibility creates confusion and delays. Therefore, educational nonprofits must rely on data-driven decision-making rather than assumptions.
That is exactly why an Educational Nonprofits KPI Dashboard in Power BI becomes a powerful and practical solution.
In this detailed guide, you will learn what an Educational Nonprofits KPI Dashboard in Power BI is, why it matters, how it works, its page-wise structure, advantages, best practices, and frequently asked questions. By the end of this article, you will clearly understand how this dashboard helps nonprofit leaders, program managers, and donors track performance and maximize impact.
Click to buy Educational Nonprofits KPI Dashboard in Power BI
What Is an Educational Nonprofits KPI Dashboard in Power BI?
An Educational Nonprofits KPI Dashboard in Power BI is a centralized performance tracking and reporting tool designed specifically for education-focused nonprofit organizations. It helps organizations monitor key performance indicators related to programs, funding, outreach, efficiency, and outcomes.
Instead of managing multiple Excel files and manual reports, nonprofits use one interactive Power BI dashboard to analyze Month-to-Date (MTD) and Year-to-Date (YTD) performance. As a result, leadership teams gain instant clarity on what works, what needs improvement, and where to allocate resources.
Moreover, because Power BI offers interactive visuals, slicers, and drill-through capabilities, users can explore data deeply without technical complexity.
Why Do Educational Nonprofits Need KPI Dashboards?
Educational nonprofits face constant pressure to demonstrate transparency, accountability, and measurable impact. At the same time, teams must manage limited budgets and resources.
Therefore, a KPI dashboard becomes essential because it helps nonprofits:
- Track program effectiveness in real time
- Monitor targets versus actual performance
- Compare current performance with previous years
- Improve donor reporting and compliance
- Make faster and more confident decisions
Without a KPI dashboard, organizations often rely on delayed reports. Consequently, decision-making becomes reactive instead of proactive.
How Does an Educational Nonprofits KPI Dashboard in Power BI Work?
An Educational Nonprofits KPI Dashboard in Power BI works by connecting structured data from an Excel file and transforming it into interactive visuals and insights.
Step-by-Step Working Process
- Data Entry in Excel
First, users enter Actual, Target, and KPI Definition data into predefined Excel sheets. - Data Modeling in Power BI
Next, Power BI imports the Excel data and creates relationships between KPI definitions, actuals, and targets. - Calculation of KPIs
Then, Power BI calculates MTD, YTD, target comparisons, and year-over-year performance using DAX formulas. - Visualization and Interaction
Finally, Power BI displays results using tables, cards, icons, and charts with slicers for easy filtering.
As a result, users receive a dynamic dashboard that updates automatically whenever data changes.
What Are the Key Pages in the Educational Nonprofits KPI Dashboard?
The Educational Nonprofits KPI Dashboard in Power BI includes three structured pages, each serving a specific purpose.
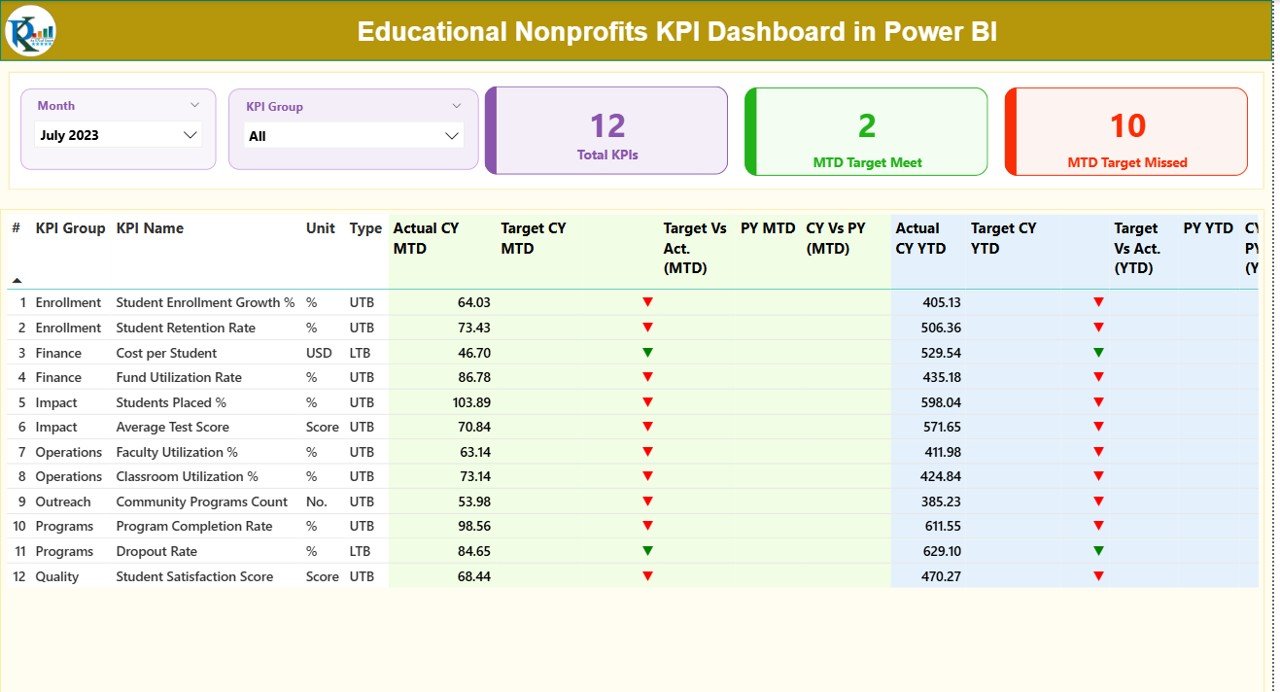
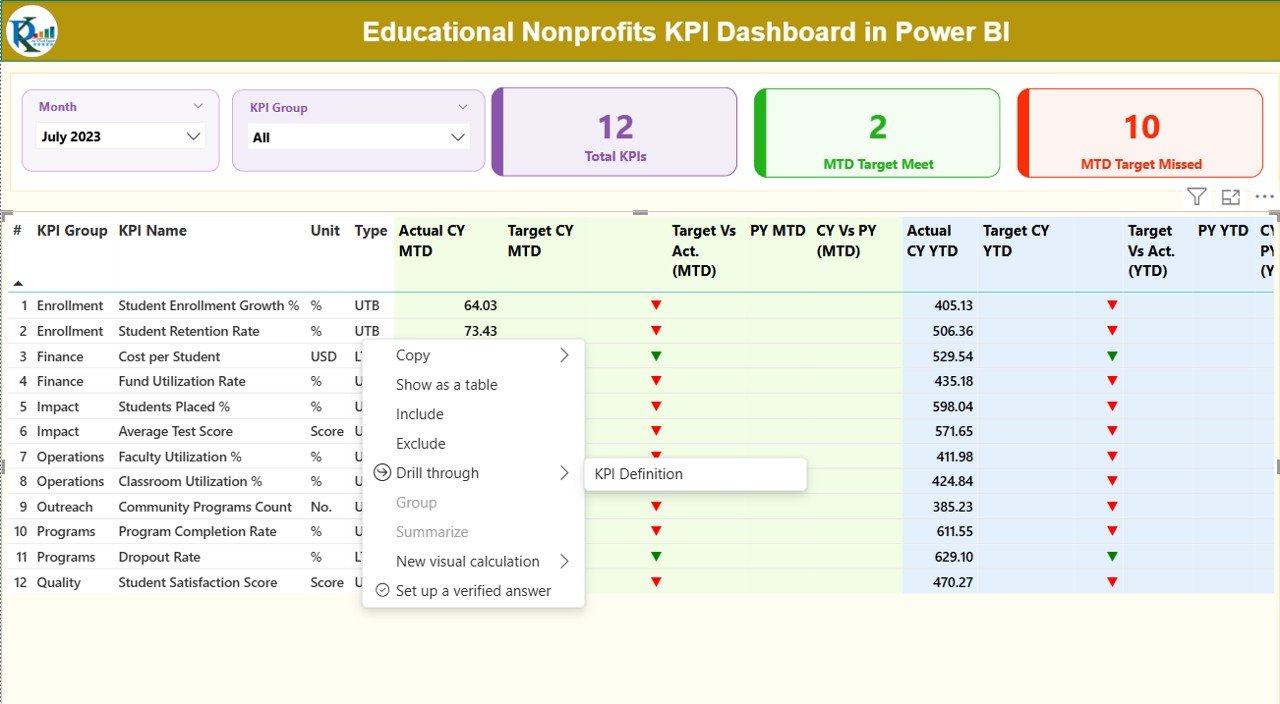
Summary Page Show
The Summary Page acts as the main control center of the dashboard.
Key Elements of the Summary Page
- Slicers
Month slicer for selecting reporting period
KPI Group slicer for category-based analysis
KPI Cards
Total KPIs Count
MTD Target Met Count
MTD Target Missed Count
These cards provide instant performance visibility at a glance.
Detailed KPI Table
Below the cards, the dashboard displays a detailed KPI table with the following columns:
- KPI Number – Sequence number of the KPI
- KPI Group – Category of the KPI (Finance, Programs, Outreach, etc.)
- KPI Name – Name of the KPI
- Unit – Unit of measurement
- Type – KPI type: LTB (Lower the Better) or UTB (Upper the Better)
Performance Metrics (MTD)
- Actual CY MTD – Current year actual MTD value
- Target CY MTD – Current year target MTD value
- MTD Icon – Green ▲ or Red ▼ showing target status
- Target vs Actual (MTD) – Actual ÷ Target (%)
- PY MTD – Previous year MTD value
- CY vs PY (MTD) – CY MTD ÷ PY MTD (%)
Performance Metrics (YTD)
- Actual CY YTD – Current year actual YTD value
- Target CY YTD – Current year target YTD value
- YTD Icon – Green ▲ or Red ▼ showing target status
- Target vs Actual (YTD) – Actual ÷ Target (%)
- PY YTD – Previous year YTD value
- CY vs PY (YTD) – CY YTD ÷ PY YTD (%)
Because of this structured layout, users can analyze both short-term and long-term performance without switching reports.
Click to buy Educational Nonprofits KPI Dashboard in Power BI
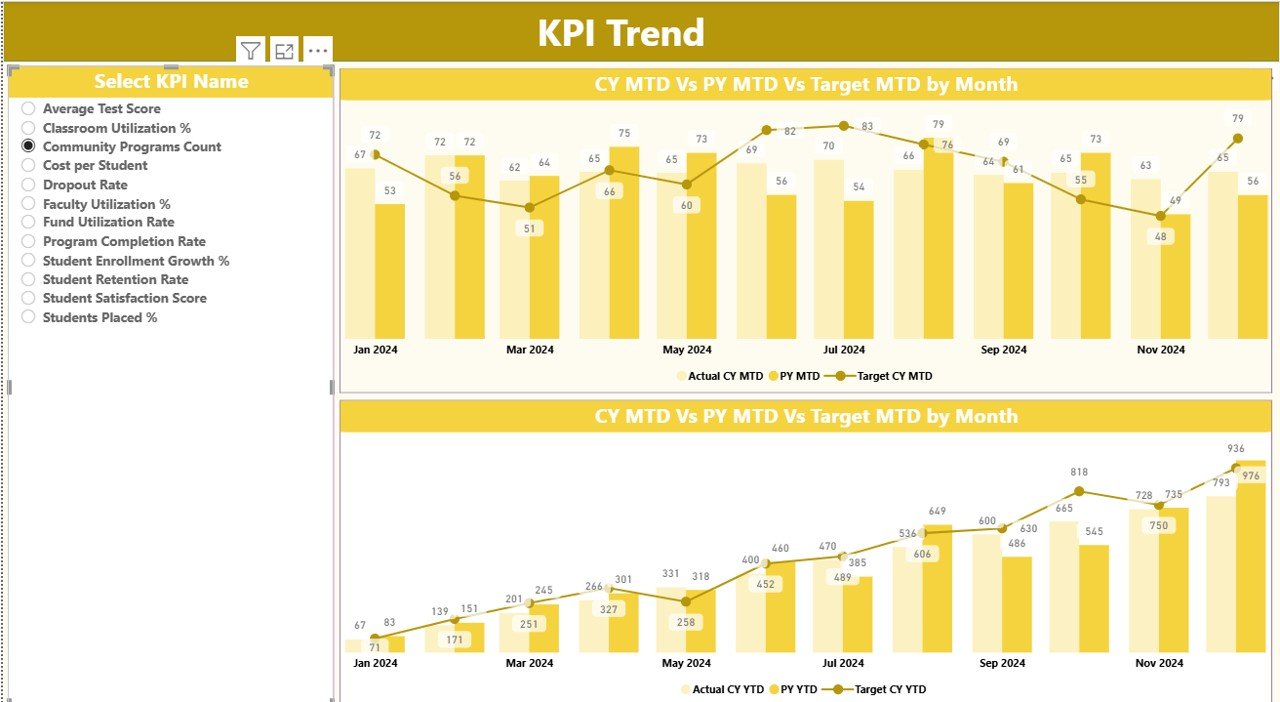
KPI Trend Page
The KPI Trend Page focuses on performance trends over time.
Key Features of KPI Trend Page
- KPI Name Slicer
Users select a specific KPI from the left-side slicer.
MTD Combo Chart
Displays:
Current Year Actual
Previous Year Actual
Target values
YTD Combo Chart
Displays:
Current Year Actual
Previous Year Actual
Target values
These charts help users quickly identify trends, seasonal patterns, and performance gaps. Therefore, decision-makers can adjust strategies proactively.
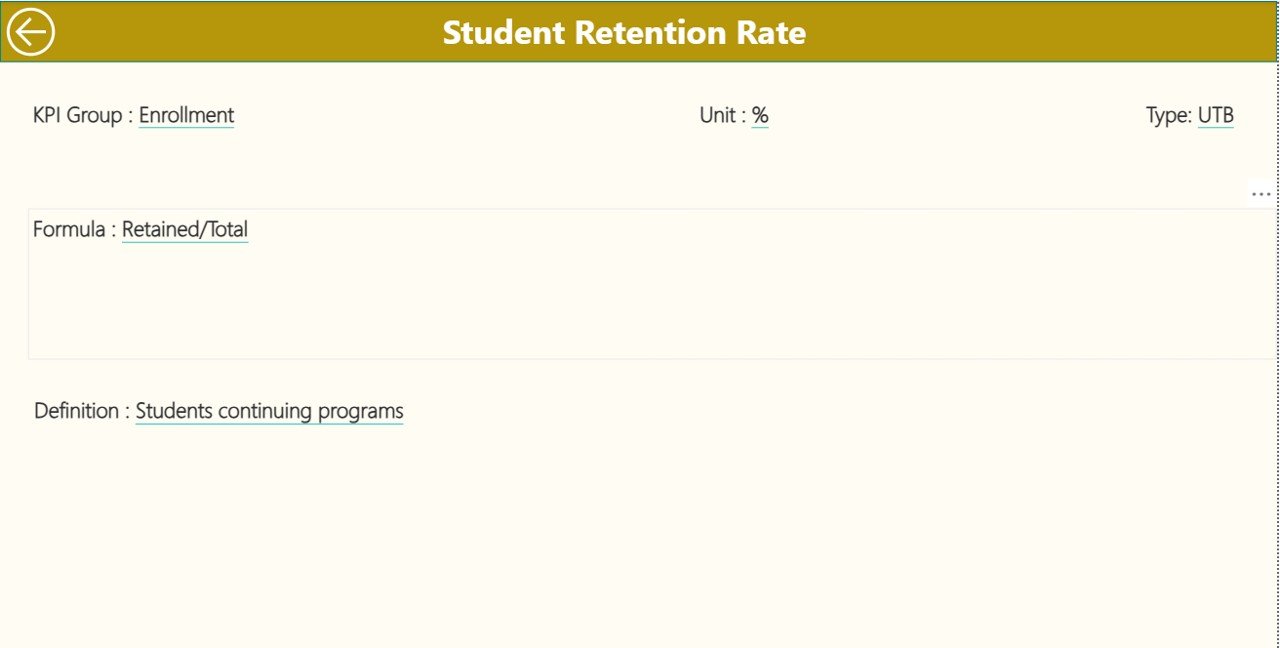
KPI Definition Page
Click to buy Educational Nonprofits KPI Dashboard in Power BI
The KPI Definition Page serves as a drill-through and reference page.
Key Highlights
- Hidden by default for a clean interface
- Accessible via drill-through from the Summary Page
Displays:
KPI Formula
KPI Definition
Unit and KPI Type
Additionally, a back button allows users to return to the Summary Page instantly.
This page ensures transparency and alignment across teams by clearly explaining each KPI.
Click to buy Educational Nonprofits KPI Dashboard in Power BI
What Excel Data Structure Does This Dashboard Use?
The dashboard uses an Excel file as its data source. This approach keeps data entry simple and flexible.
Excel Worksheets Used
Input_Actual Sheet
Users enter:
- KPI Name
- Month (first date of the month)
- MTD Actual values
- YTD Actual values
Input_Target Sheet
Users enter:
- KPI Name
- Month (first date of the month)
- MTD Target values
- YTD Target values
Click to buy Educational Nonprofits KPI Dashboard in Power BI
KPI Definition Sheet
Users enter:
- KPI Number
- KPI Group
- KPI Name
- Unit
- Formula
- Definition
- Type (LTB or UTB)
Because of this structure, even non-technical users can maintain data easily.
Which KPIs Can Educational Nonprofits Track?
Educational nonprofits can track a wide range of KPIs, including:
- Student enrollment growth
- Program completion rate
- Cost per student
- Fund utilization rate
- Donor retention rate
- Outreach effectiveness
- Training hours delivered
- Beneficiary satisfaction score
Therefore, the dashboard adapts easily to different nonprofit goals and programs.
Advantages of Educational Nonprofits KPI Dashboard in Power BI
- Centralized Performance Monitoring
The dashboard brings all KPIs into one place. As a result, teams avoid scattered files and manual reports.
- Improved Transparency and Accountability
Clear metrics and visuals help nonprofits demonstrate impact to donors and stakeholders.
- Faster Decision-Making
Real-time insights allow leaders to act quickly and confidently.
- Easy Target Tracking
MTD and YTD comparisons make performance gaps visible instantly.
- Historical Performance Comparison
CY vs PY analysis helps organizations measure growth and improvement.
- User-Friendly Interface
Slicers, icons, and charts ensure easy navigation for all users.
- Scalable and Flexible Design
Organizations can add new KPIs without redesigning the dashboard.
Best Practices for the Educational Nonprofits KPI Dashboard in Power BI
- Define Clear and Relevant KPIs
Always align KPIs with organizational mission and goals.
- Maintain Data Consistency
Use standardized KPI names and units across Excel sheets.
- Update Data Regularly
Update actual and target values monthly to keep insights accurate.
- Use KPI Groups Wisely
Group KPIs by Finance, Programs, Outreach, or Operations for better clarity.
- Train Team Members
Ensure staff understand how to read charts, icons, and trends.
- Review Trends, Not Just Numbers
Focus on patterns and movement instead of single-month results.
- Keep the Dashboard Simple
Avoid overcrowding visuals. Clarity always improves adoption.
How Does This Dashboard Support Donor Reporting?
Donors expect transparency and measurable results. Therefore, this dashboard helps by:
- Showing clear performance against targets
- Comparing year-over-year outcomes
- Supporting data-driven impact stories
- Enhancing trust and credibility
As a result, nonprofits strengthen donor relationships and funding opportunities.
Who Should Use an Educational Nonprofits KPI Dashboard?
This dashboard suits:
- Nonprofit executives
- Program managers
- Finance teams
- Monitoring and evaluation teams
- Donor relations teams
- Board members
Because the dashboard simplifies complex data, every stakeholder benefits.
Conclusion
An Educational Nonprofits KPI Dashboard in Power BI transforms raw data into actionable insights. It helps organizations track performance, improve transparency, and maximize educational impact. Moreover, with structured pages, interactive visuals, and Excel-based data entry, the dashboard remains both powerful and easy to use.
By adopting this dashboard, educational nonprofits move from reactive reporting to proactive decision-making. Consequently, they achieve better outcomes for students, donors, and communities.
Frequently Asked Questions (FAQs)
What is an Educational Nonprofits KPI Dashboard in Power BI?
It is an interactive Power BI dashboard that tracks key performance indicators for education-focused nonprofit organizations.
Can non-technical users maintain this dashboard?
Yes. Users only need to update Excel sheets, while Power BI handles calculations and visuals.
Does the dashboard support MTD and YTD analysis?
Yes. The dashboard shows both Month-to-Date and Year-to-Date performance.
Can organizations customize KPIs?
Absolutely. Users can add, remove, or modify KPIs easily through the Excel definition sheet.
Does this dashboard compare current and previous year performance?
Yes. It includes CY vs PY comparisons for both MTD and YTD metrics.
Is this dashboard suitable for donor reporting?
Yes. It provides transparent, visual, and data-driven insights that donors value.
Click to buy Educational Nonprofits KPI Dashboard in Power BI
Visit our YouTube channel to learn step-by-step video tutorials
Watch the step-by-step video tutorial: