Electricity infrastructure projects require large investments, strict timelines, and continuous monitoring. Power plants, grid expansion projects, substations, and renewable energy installations involve multiple contractors, regions, and project managers. Therefore, organizations must track project cost, expected revenue, completion progress, and profitability carefully.
However, many companies still rely on multiple spreadsheets and manual reports. As a result, decision-makers often struggle to understand project performance quickly. They cannot easily detect delays, monitor contractor efficiency, or analyze project profitability.
Therefore, organizations need a structured reporting system that converts complex electricity project data into meaningful insights.
This is where the Electricity Project Dashboard in Excel becomes extremely useful.
The Electricity Project Dashboard in Excel is a ready-to-use and interactive Excel template that helps companies monitor electricity projects in a structured and visual way. Moreover, it transforms raw project data into easy-to-understand charts, KPI indicators, and analytical reports. As a result, project managers can track progress, monitor financial performance, and identify delays quickly.
In this article, we will explore the Electricity Project Dashboard in Excel, including its features, benefits, best practices, and frequently asked questions.
Click to Purchases Electricity Project Dashboard in Excel
What is an Electricity Project Dashboard in Excel?
An Electricity Project Dashboard in Excel is an analytical tool designed to monitor electricity infrastructure projects using Microsoft Excel.
The dashboard collects important project data such as:
-
Project cost
-
Expected revenue
-
Expected profit
-
Completion ratio
-
Profit margin
-
Contractor performance
-
Regional performance
-
Monthly project trends
-
Project status
After that, Excel converts this information into interactive charts, pivot tables, and KPI indicators.
Therefore, project managers can easily understand project performance without analyzing multiple reports.
Furthermore, the dashboard helps companies make faster and smarter decisions because it presents all critical project insights in one place.
Why Do Electricity Companies Need a Dashboard?
Electricity projects are complex. They involve engineering teams, contractors, regional operations, and financial planning. Therefore, companies must track project performance from multiple perspectives.
Without a dashboard, organizations may face several challenges:
-
Difficulty tracking project progress
-
Limited visibility into project costs
-
Delays in identifying project issues
-
Poor contractor performance monitoring
-
Lack of profitability analysis
However, the Electricity Project Dashboard in Excel solves these problems by organizing project data into a clear visual format.
Consequently, managers can monitor project performance quickly and make better decisions.
Click to Purchases Electricity Project Dashboard in Excel
Key Features of the Electricity Project Dashboard in Excel
The Electricity Project Dashboard in Excel is designed to provide comprehensive project insights.
Page Navigator
A Page Navigator located on the left side allows users to easily move between different analytical pages.
Therefore, users can quickly explore different aspects of project performance without navigating through multiple worksheets.
The Excel file includes five analytical dashboard pages, along with supporting sheets for calculations and data storage.
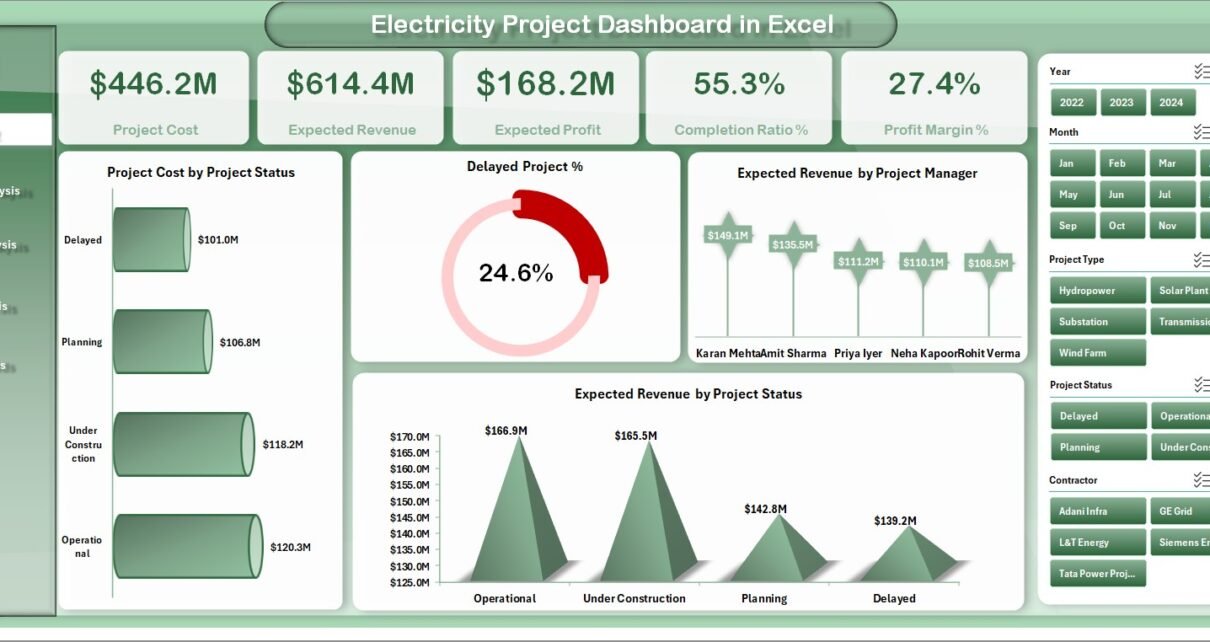
1. Overview Page
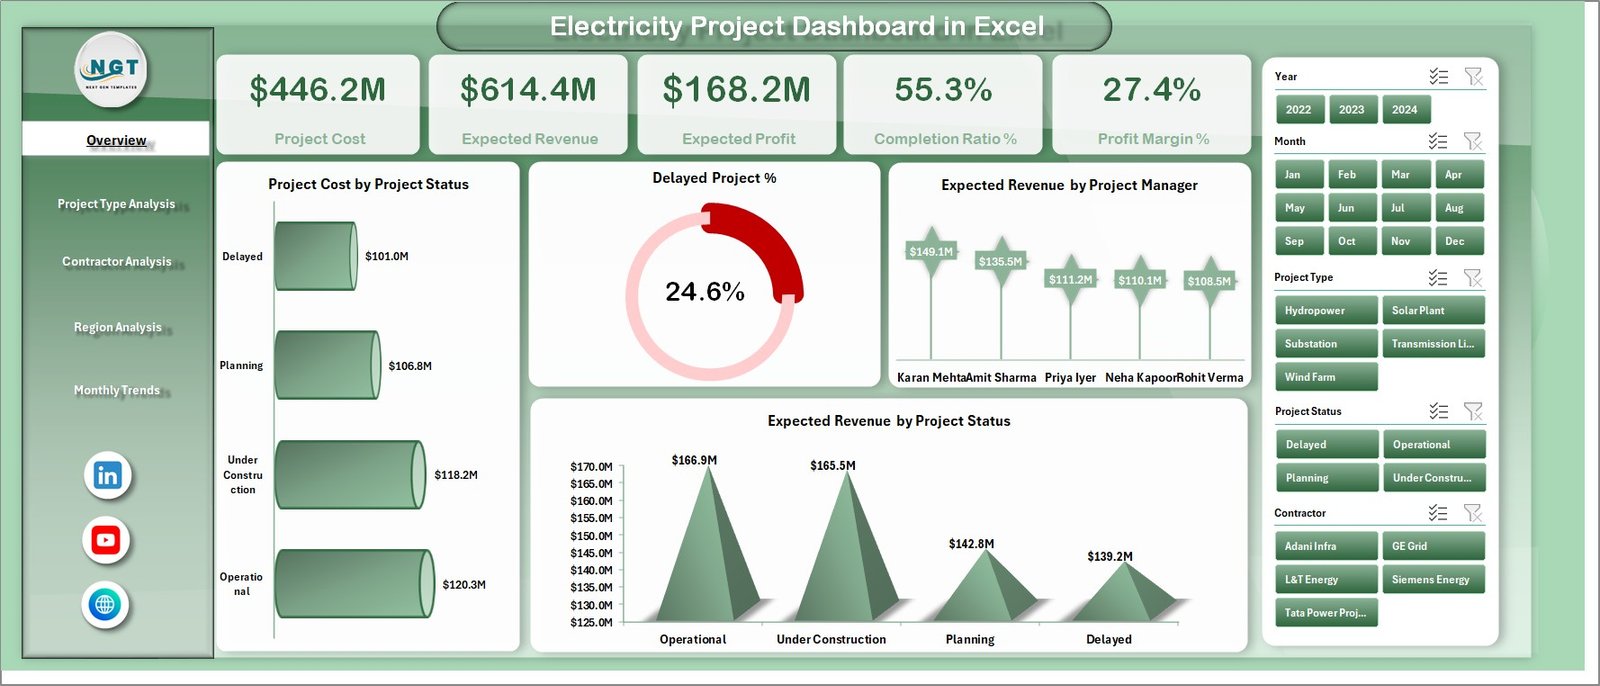
The Overview Page is the main summary page of the dashboard.
This page provides a quick snapshot of the overall performance of electricity projects.
Additionally, the page includes a slicer on the right side that allows users to filter dashboard data dynamically.
KPI Cards on the Overview Page
The dashboard displays five key performance indicators:
-
Project Cost – Shows the total investment made in electricity projects.
-
Expected Revenue – Displays projected revenue generated from the projects.
-
Expected Profit – Calculates the difference between expected revenue and project cost.
-
Completion Ratio % – Indicates the percentage of project work completed.
-
Profit Margin % – Shows the profitability percentage of electricity projects.
Charts on the Overview Page
The Overview Page includes four analytical charts:
-
Project Cost by Project Status
Shows how project costs distribute across completed, ongoing, and delayed projects. -
Delayed Project %
Highlights the percentage of electricity projects that are delayed. -
Expected Revenue by Project Manager
Displays the revenue associated with each project manager. -
Expected Revenue by Project Status
Shows revenue distribution based on project progress.
Therefore, the Overview Page provides a complete snapshot of project health.
Click to Purchases Electricity Project Dashboard in Excel
2. Project Type Analysis
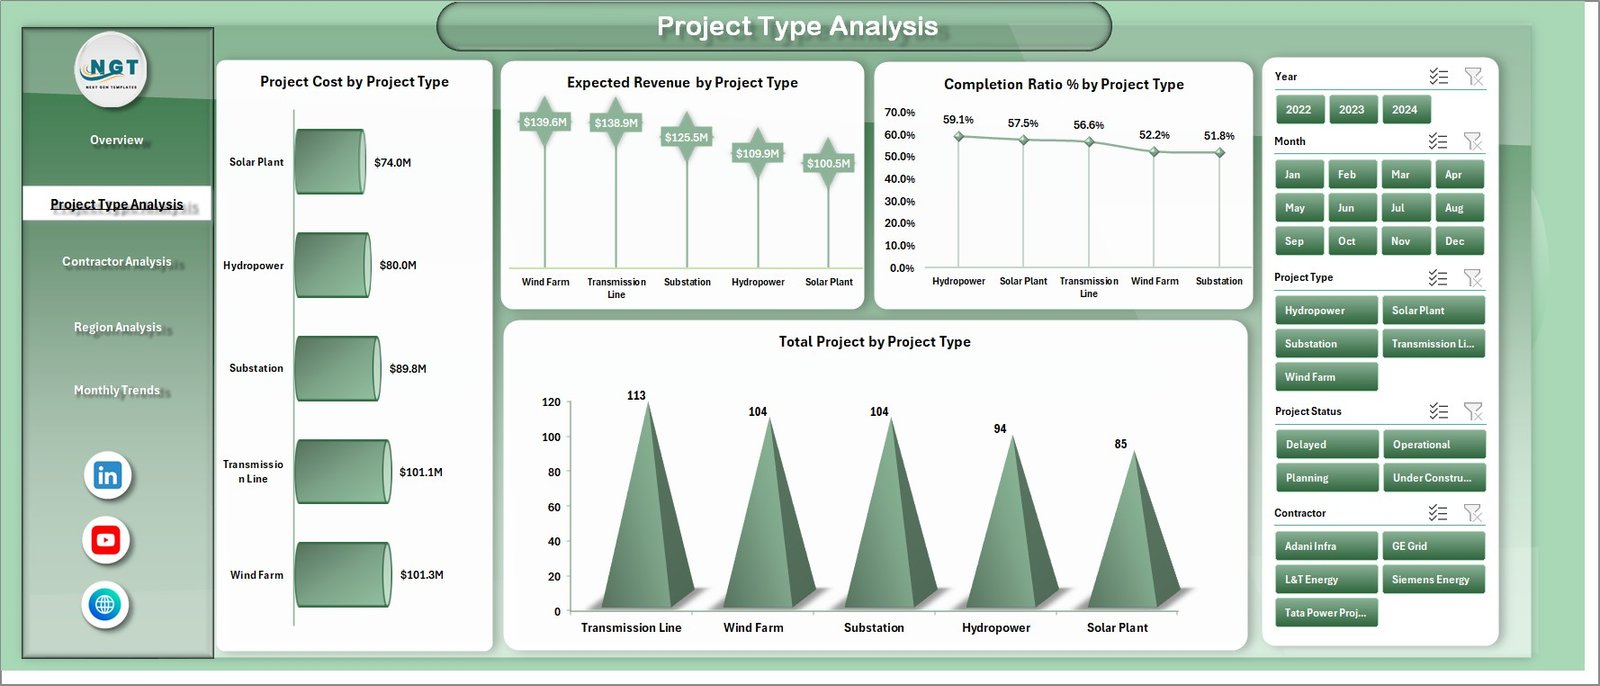
Electricity companies often handle different types of projects such as power plants, substations, transmission lines, and renewable energy installations.
Therefore, analyzing performance by project type becomes very important.
The Project Type Analysis Page helps managers evaluate how different project categories perform.
Charts in the Project Type Analysis Page
This page includes four analytical charts:
-
Project Cost by Project Type
Shows investment distribution across project categories. -
Expected Revenue by Project Type
Identifies the most profitable project types. -
Completion Ratio % by Project Type
Displays completion efficiency for each project category. -
Total Project by Project Type
Shows the number of projects in each category.
As a result, organizations can focus more on profitable and efficient project types.
Click to Purchases Electricity Project Dashboard in Excel
3. Contractor Analysis
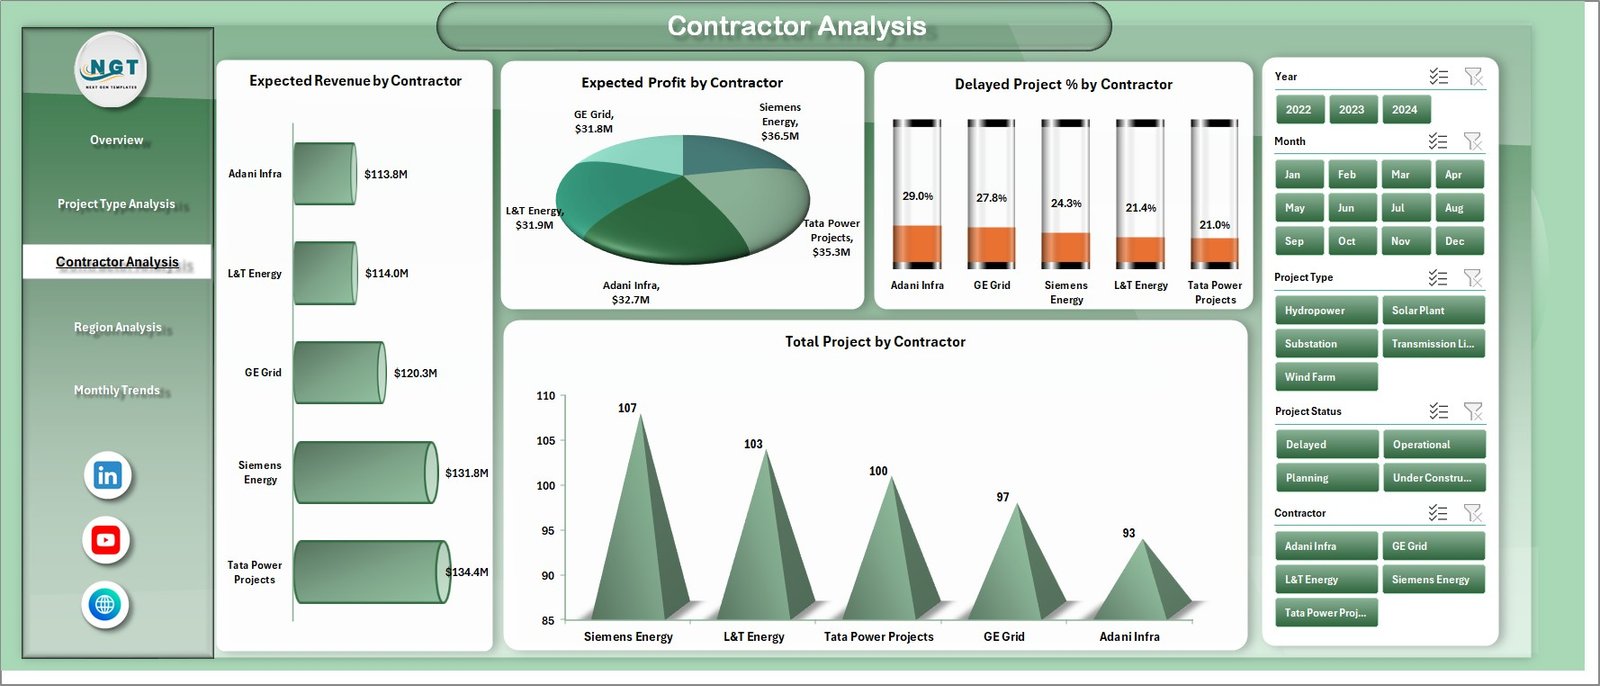
Electricity infrastructure projects involve many contractors responsible for engineering, construction, and equipment installation.
Therefore, contractor performance analysis becomes essential.
The Contractor Analysis Page allows companies to monitor contractor productivity and reliability.
Charts in the Contractor Analysis Page
This page includes four analytical charts:
-
Expected Revenue by Contractor
Shows revenue contribution from projects handled by each contractor. -
Expected Profit by Contractor
Displays contractors associated with profitable projects. -
Delayed Project % by Contractor
Identifies contractors responsible for delays. -
Total Project by Contractor
Shows the number of projects assigned to each contractor.
Consequently, companies can select the best contractors for future projects.
Click to Purchases Electricity Project Dashboard in Excel
4. Region Analysis
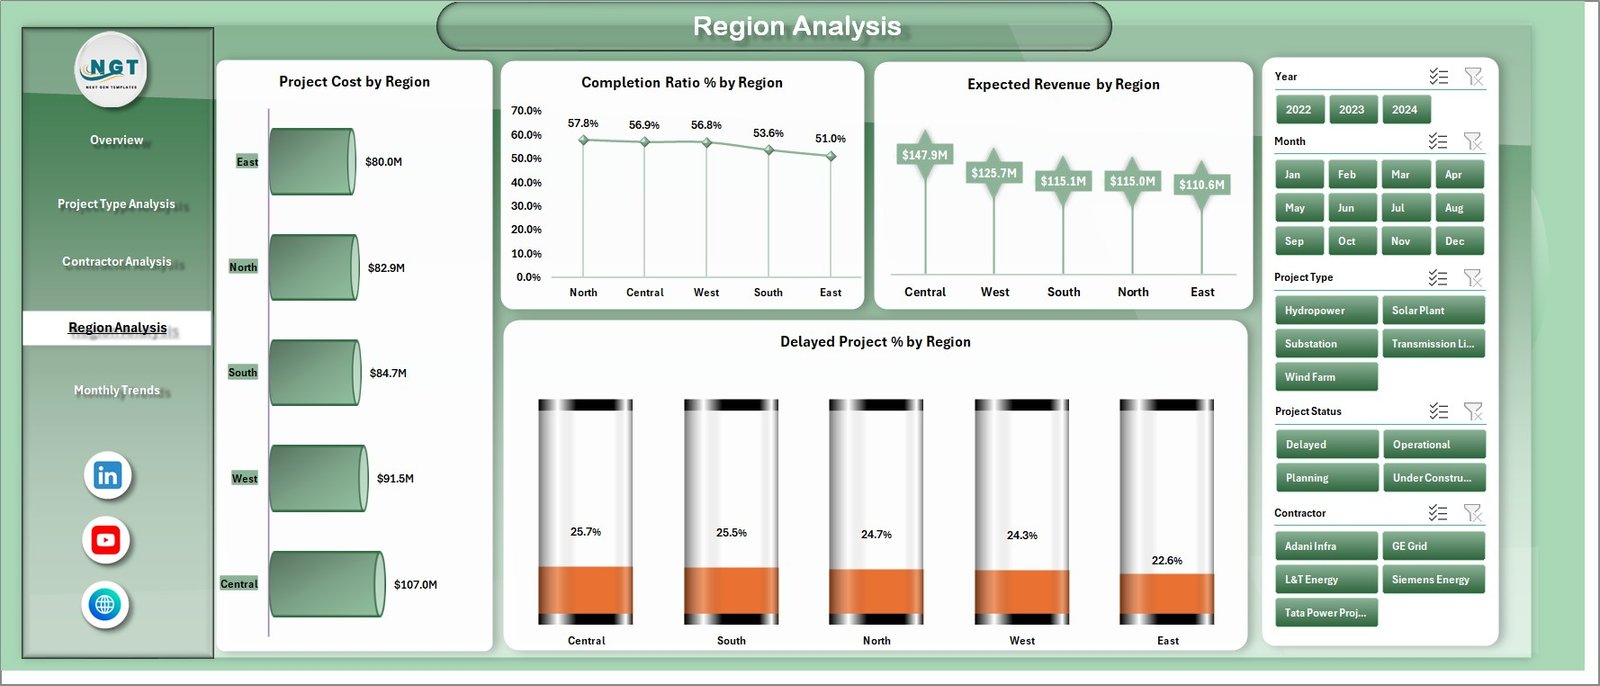
Electricity projects usually spread across multiple geographical regions.
Therefore, companies must analyze project performance by region.
The Region Analysis Page provides insights into regional project performance.
Charts in the Region Analysis Page
This page includes four charts:
-
Project Cost by Region
Shows investment distribution across regions. -
Completion Ratio % by Region
Displays project progress by location. -
Expected Revenue by Region
Shows revenue projections across regions. -
Delayed Project % by Region
Highlights regions where projects face delays.
Therefore, managers can allocate resources effectively and address regional challenges faster.
Click to Purchases Electricity Project Dashboard in Excel
5. Monthly Trends Analysis
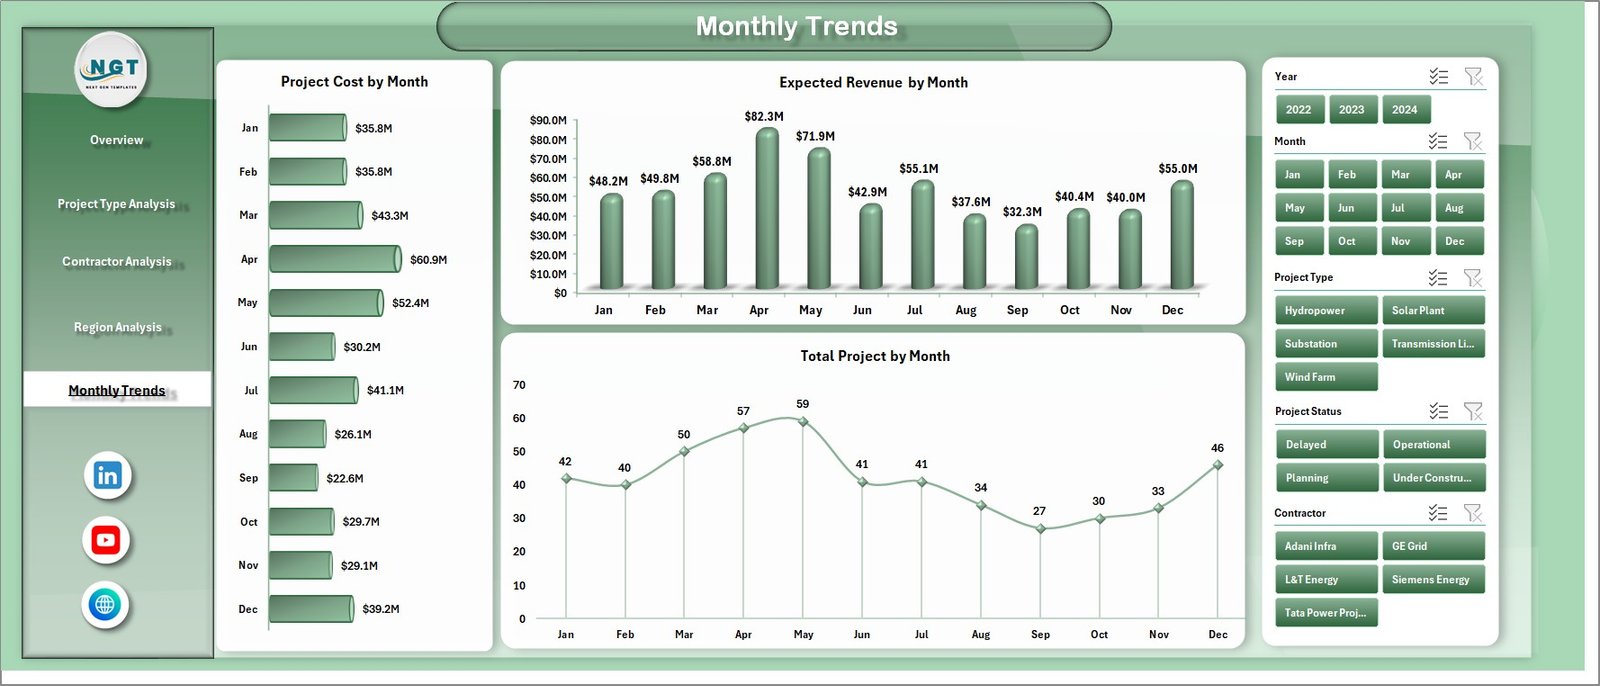
The Monthly Trends Page helps managers analyze project performance over time.
Trend analysis helps organizations identify patterns and seasonal activity.
Charts in the Monthly Trends Page
This page includes three charts:
-
Project Cost by Month
Displays monthly project investments. -
Expected Revenue by Month
Shows revenue trends across months. -
Total Project by Month
Displays the number of projects handled each month.
As a result, organizations can plan project resources more effectively.
Additional Sheets in the Dashboard
The dashboard also contains supporting worksheets that manage data and calculations.
Support Sheet
The Support Sheet contains lookup tables, dropdown values, and helper formulas required for the dashboard.
These supporting elements ensure smooth functioning of slicers and calculations.
Data Sheet
The Data Sheet stores the raw dataset used to generate dashboard charts.
Typical columns in the data sheet include:
-
Project ID
-
Project Name
-
Project Type
-
Region
-
Contractor
-
Project Manager
-
Project Cost
-
Expected Revenue
-
Expected Profit
-
Completion Ratio %
-
Project Status
-
Month and Year
This structured data enables the dashboard to create pivot tables and charts.
Click to Purchases Electricity Project Dashboard in Excel
Advantages of Electricity Project Dashboard in Excel
Organizations gain several advantages when they implement this dashboard.
Better Project Visibility
Managers can see the entire project portfolio in one dashboard.
Faster Decision Making
Visual insights allow managers to make quicker decisions.
Improved Financial Monitoring
The dashboard tracks project cost, revenue, and profit margin.
Early Detection of Project Delays
Managers can identify delays and take corrective actions early.
Contractor Performance Evaluation
Companies can monitor contractor efficiency easily.
Regional Performance Insights
Organizations can understand regional project performance.
Easy Implementation
Excel dashboards are easy to implement because most organizations already use Microsoft Excel.
Opportunities for Improvement
Even with dashboards, organizations should continue improving their project management practices.
Improve Data Accuracy
Companies should maintain clean and accurate datasets.
Automate Data Collection
Automation reduces manual errors and saves time.
Add Predictive Analysis
Predictive models can forecast project delays and cost overruns.
Integrate Systems
Connecting Excel dashboards with project management tools improves efficiency.
Expand KPI Monitoring
Organizations can track additional KPIs such as safety metrics and operational efficiency.
Click to Purchases Electricity Project Dashboard in Excel
Best Practices for the Electricity Project Dashboard
Organizations should follow several best practices to maximize the value of the dashboard.
Define Clear KPIs
First, companies should identify the most important project metrics.
Maintain Structured Data
Secondly, the dataset must follow a consistent format.
Use Pivot Tables and Charts
Pivot charts provide flexible and dynamic analysis.
Keep the Dashboard Simple
Avoid adding too many charts that confuse users.
Train Users
Users should understand how to interpret dashboard insights.
Update Data Regularly
Regular updates ensure accurate reporting.
Conclusion
Electricity infrastructure projects require careful monitoring, financial analysis, and operational transparency. Without a proper reporting system, companies may face delays, budget overruns, and inefficient project management.
Therefore, the Electricity Project Dashboard in Excel provides a powerful solution for managing electricity projects effectively.
This ready-to-use dashboard combines project cost tracking, revenue analysis, contractor performance monitoring, regional insights, and monthly trends into one structured platform.
As a result, companies can improve decision-making, reduce project risks, and increase project profitability.
Consequently, organizations that adopt this Excel dashboard gain better control over their electricity project operations.
Click to Purchases Electricity Project Dashboard in Excel
Frequently Asked Questions (FAQs)
What is an Electricity Project Dashboard in Excel?
An Electricity Project Dashboard in Excel is an analytical reporting tool that tracks project cost, revenue, completion progress, and contractor performance.
What KPIs are included in the dashboard?
The dashboard includes key metrics such as:
-
Project Cost
-
Expected Revenue
-
Expected Profit
-
Completion Ratio %
-
Profit Margin %
Can this dashboard track project delays?
Yes. The dashboard highlights delayed projects using delay percentage charts.
Is Excel suitable for project analytics?
Yes. Excel supports pivot tables, charts, formulas, and interactive dashboards.
Can this dashboard work for renewable energy projects?
Yes. The dashboard can track solar, wind, hydro, and other electricity infrastructure projects.
Click to Purchases Electricity Project Dashboard in Excel
Visit our YouTube channel to learn step-by-step video tutorials