Managing electricity tenders demands accuracy, transparency, and continuous monitoring. However, many organizations still rely on scattered Excel sheets, emails, and manual reports. As a result, decision-makers struggle to track performance, meet targets, and compare results with previous years. This challenge clearly shows why an Electricity Tender KPI Dashboard in Excel has become essential.
In this detailed article, you will learn everything about the Electricity Tender KPI Dashboard in Excel, including its structure, features, advantages, usage, best practices, and real-world applications. Moreover, you will understand how this dashboard helps tender teams track KPIs efficiently and make data-driven decisions with confidence.
Click to buy Electricity Tender KPI Dashboard in Excel
What Is an Electricity Tender KPI Dashboard in Excel?
An Electricity Tender KPI Dashboard in Excel is a structured reporting and performance-tracking tool that helps organizations monitor key tender-related KPIs using interactive visuals, formulas, and automated calculations.
Instead of reviewing multiple spreadsheets manually, this dashboard consolidates all electricity tender KPIs into one centralized Excel file. Consequently, users gain instant visibility into performance, trends, targets, and gaps.
Moreover, Excel allows flexibility and ease of use. You can update data quickly, customize KPIs easily, and analyze performance without advanced technical skills.
Why Do Organizations Need an Electricity Tender KPI Dashboard?
Electricity tenders involve multiple KPIs such as bid success rate, contract value, compliance metrics, timelines, and cost efficiency. Without a structured system, teams often face confusion, delays, and poor reporting.
An Electricity Tender KPI Dashboard solves these problems because it:
- Centralizes all KPI data in one place
- Eliminates manual calculations
- Improves accuracy and consistency
- Supports faster and better decisions
- Enhances transparency for stakeholders
As a result, organizations can manage tenders proactively instead of reacting to issues later.
What Are the Key Features of an Electricity Tender KPI Dashboard in Excel?
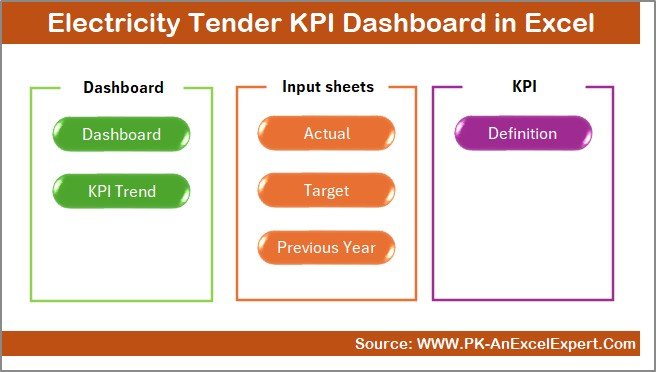
This dashboard includes 7 well-structured worksheets, each designed for a specific purpose. Together, they create a powerful and easy-to-use KPI monitoring system.
What Is the Purpose of the Summary Page?
The Summary Page works as an index sheet for the entire dashboard.
Key Highlights of the Summary Page
- Acts as a navigation hub
- Contains 6 interactive buttons
- Allows users to jump instantly to any worksheet
- Saves time and improves usability
Because of this design, even first-time users can navigate the dashboard effortlessly.
Click to buy Electricity Tender KPI Dashboard in Excel
Dashboard Sheet
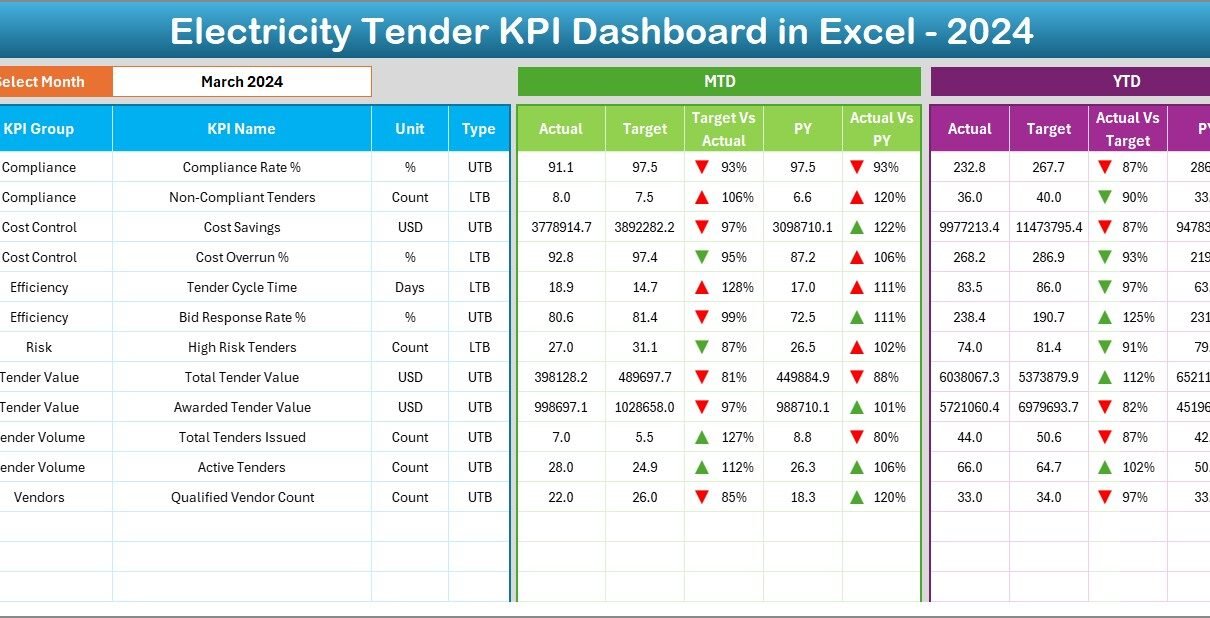
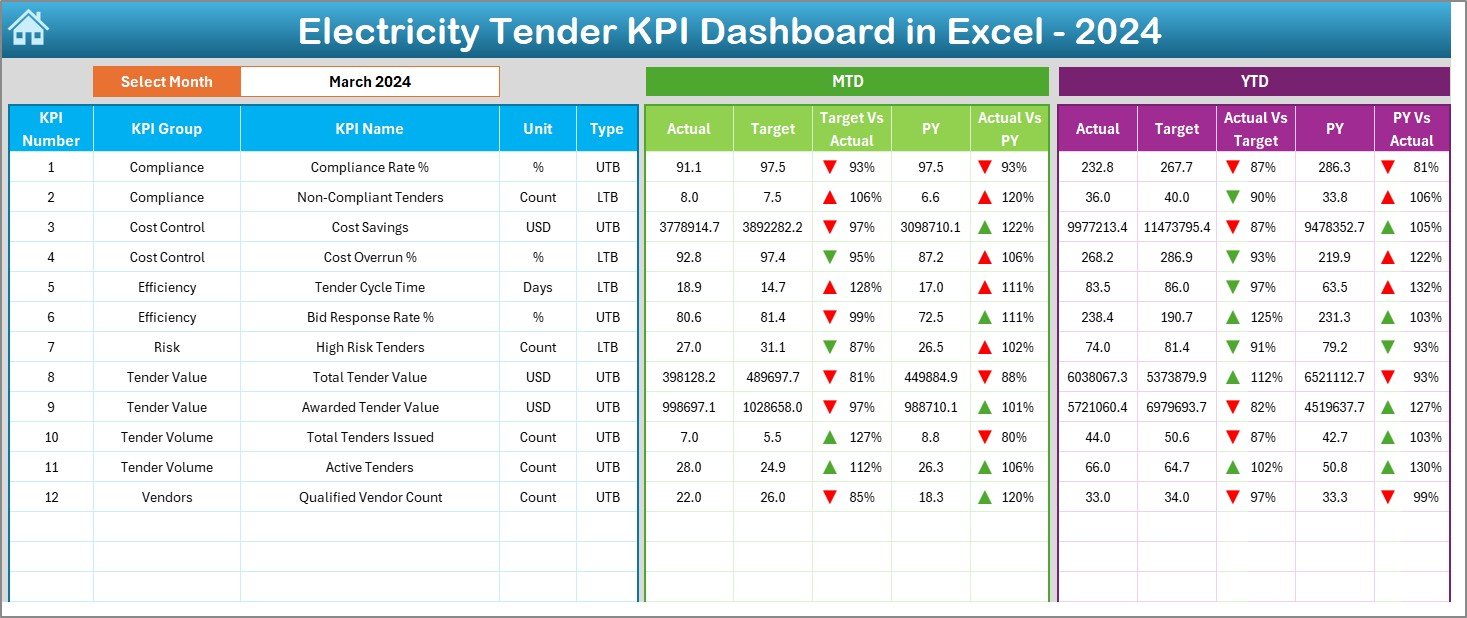
The Dashboard Sheet serves as the heart of the Electricity Tender KPI Dashboard in Excel.
How Does the Dashboard Sheet Work?
- You can select the Month from a dropdown in cell D3
- All KPIs update automatically based on the selected month
- The dashboard displays both MTD (Month-to-Date) and YTD (Year-to-Date) performance
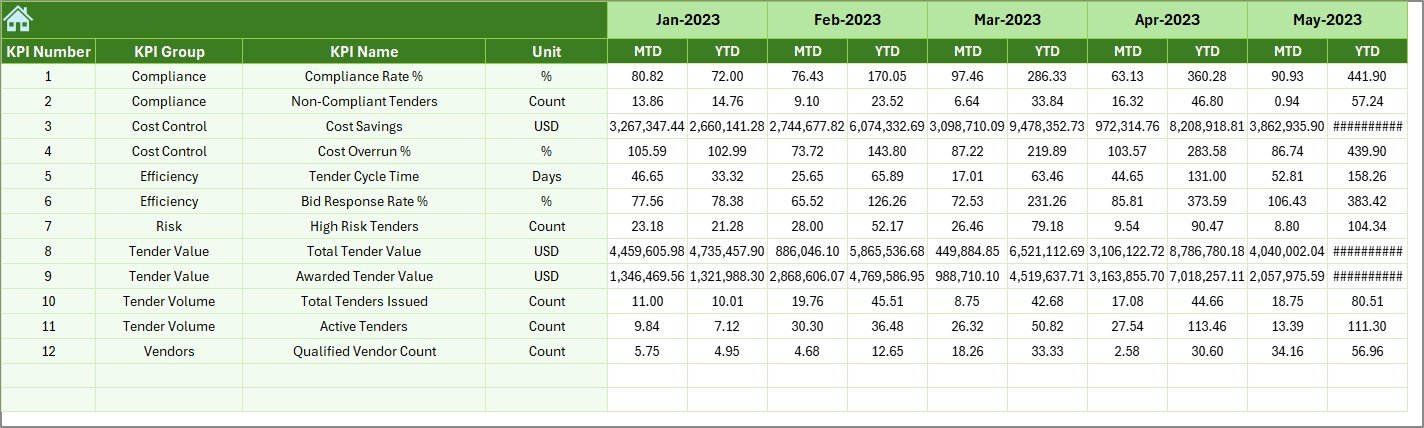
What Metrics Does the Dashboard Display?
MTD Section
- Actual
- Target
- Previous Year
- Target vs Actual %
- Previous Year vs Actual %
YTD Section
- Actual
- Target
- Previous Year
- Target vs Actual %
- Previous Year vs Actual %
Additionally, the dashboard uses conditional formatting arrows to indicate performance direction clearly. Up arrows show improvement, while down arrows highlight underperformance.
Therefore, users can identify issues instantly without reading complex tables.
Click to buy Electricity Tender KPI Dashboard in Excel
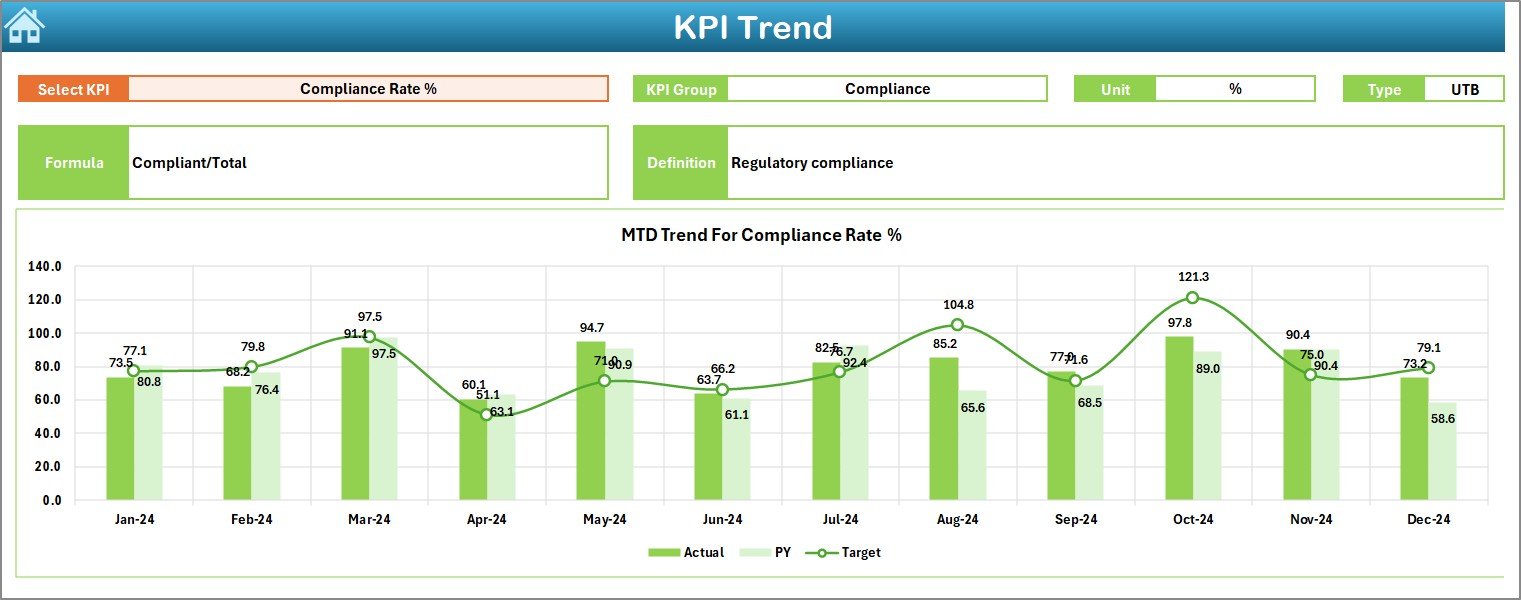
Trend Sheet
The Trend Sheet focuses on deep KPI-level analysis.
What Can You Do on the Trend Sheet?
- Select a KPI Name from a dropdown in cell C3
View detailed KPI information such as:
KPI Group
Unit of Measurement
KPI Type (Upper the Better or Lower the Better)
KPI Formula
KPI Definition
What Visuals Are Available?
- MTD Trend Chart for Actual, Target, and Previous Year
- YTD Trend Chart for Actual, Target, and Previous Year
As a result, users can analyze performance trends over time instead of relying on single-month results.
Click to buy Electricity Tender KPI Dashboard in Excel
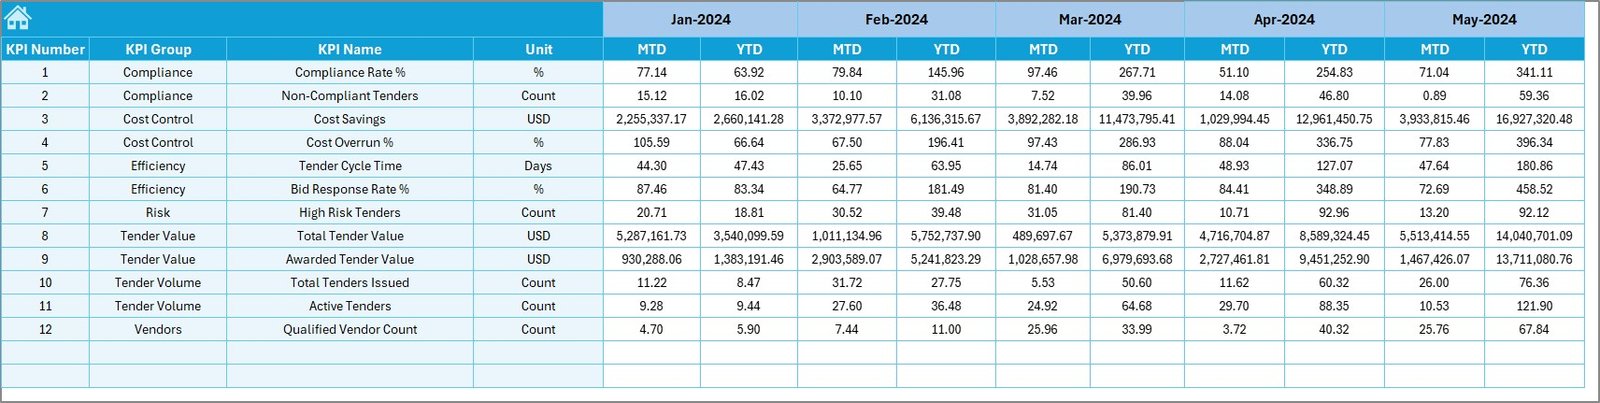
Actual Numbers Input Sheet
The Actual Numbers Input Sheet allows users to enter real performance values.
How Does This Sheet Work?
- You can set the starting month of the year in cell E1
- You can switch months dynamically
- Users enter both MTD and YTD actual values
This structure ensures flexibility and accuracy throughout the year.

Click to buy Electricity Tender KPI Dashboard in Excel
Target Sheet
The Target Sheet defines performance expectations.
What Data Goes into the Target Sheet?
- Monthly MTD targets
- Cumulative YTD targets
- Target values for each KPI
Because targets drive performance evaluation, accurate target entry ensures meaningful KPI analysis.
Click to buy Electricity Tender KPI Dashboard in Excel
Previous Year Number Sheet
The Previous Year Number Sheet enables historical comparison.
Why Does Previous Year Data Matter?
- Helps measure growth or decline
- Identifies long-term performance trends
- Supports benchmarking
By comparing current performance with last year’s numbers, organizations gain deeper insights into tender efficiency.
Click to buy Electricity Tender KPI Dashboard in Excel
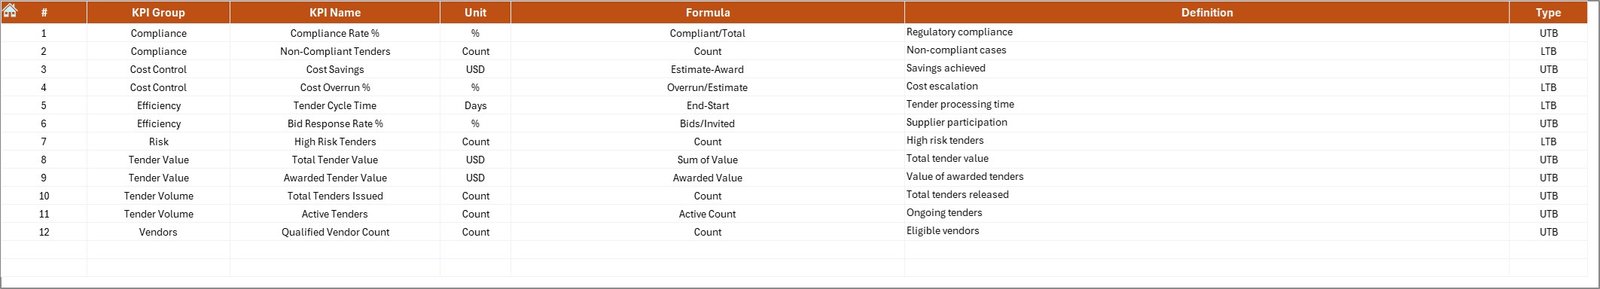
a KPI Definition Sheet
The KPI Definition Sheet provides clarity and consistency.
What Information Does This Sheet Contain?
- KPI Name
- KPI Group
- Unit of Measurement
- KPI Formula
- KPI Definition
This sheet ensures that everyone interprets KPIs the same way. As a result, reporting errors and misunderstandings reduce significantly.
How Does the Electricity Tender KPI Dashboard Improve Decision-Making?
This dashboard transforms raw data into actionable insights.
Key Decision-Making Benefits
- Faster performance reviews
- Clear visibility of gaps
- Accurate comparison with targets
- Trend-based analysis
- Improved stakeholder communication
Therefore, management can focus on strategy instead of manual reporting.
Advantages of Electricity Tender KPI Dashboard in Excel
Using this dashboard offers multiple advantages for tender teams and management.
Centralized KPI Tracking
You can monitor all electricity tender KPIs in one structured Excel file.
Time Savings
Automation reduces manual calculations and report preparation time.
Improved Accuracy
Built-in formulas and validations minimize errors.
Easy Customization
Excel allows quick KPI additions, removals, or modifications.
Visual Performance Indicators
Conditional formatting and charts make insights easy to understand.
Cost-Effective Solution
Excel dashboards eliminate the need for expensive BI tools.
Who Can Benefit from an Electricity Tender KPI Dashboard?
This dashboard supports multiple roles and industries.
Ideal Users Include:
- Electricity boards
- Power distribution companies
- Energy procurement teams
- Tender management departments
- Government utilities
- Private power contractors
- Consultants and auditors
How Can You Customize the Dashboard for Your Organization?
Excel flexibility allows endless customization.
Customization Ideas
- Add new KPI groups
- Modify formulas
- Change visuals
- Add more trend charts
- Apply branding colors
- Protect sheets for controlled access
As a result, the dashboard adapts easily to different tender requirements.
Best Practices for the Electricity Tender KPI Dashboard in Excel
Following best practices ensures long-term success.
Keep KPI Definitions Clear
Always maintain updated and clear KPI definitions.
Update Data Regularly
Enter actual, target, and previous year data consistently.
Validate Inputs
Use data validation to avoid incorrect entries.
Review Trends Monthly
Analyze both MTD and YTD trends to spot issues early.
Limit KPI Overload
Track only meaningful KPIs that support decision-making.
Train Users
Ensure team members understand how to use the dashboard properly.
How Does This Dashboard Support Audit and Compliance?
Electricity tenders often require audits and regulatory reviews.
This dashboard:
- Maintains historical data
- Ensures transparency
- Provides clear performance documentation
- Supports compliance reporting
Therefore, audit preparation becomes faster and easier.
Conclusion: Why Should You Use an Electricity Tender KPI Dashboard in Excel?
An Electricity Tender KPI Dashboard in Excel offers a practical, powerful, and cost-effective way to track tender performance. It combines automation, visualization, and structured data management into one easy-to-use system.
By using this dashboard, organizations gain clarity, improve accountability, and make smarter decisions. Moreover, Excel flexibility ensures long-term usability without heavy investments.
If you want better control over electricity tender performance, this dashboard becomes an essential tool.
Frequently Asked Questions (FAQs)
What is an Electricity Tender KPI Dashboard in Excel?
It is an Excel-based reporting tool that tracks and visualizes electricity tender KPIs using automated calculations and charts.
Can beginners use this dashboard?
Yes, the dashboard uses simple Excel features and clear navigation, making it beginner-friendly.
Can I add more KPIs later?
Yes, you can easily add or modify KPIs using the KPI Definition Sheet.
Does the dashboard support monthly and yearly analysis?
Yes, it supports both MTD and YTD analysis with trend charts.
Is Excel sufficient for tender KPI tracking?
Yes, Excel provides flexibility, automation, and visualization suitable for most tender monitoring needs.
How often should data be updated?
You should update actual and target data monthly for accurate insights.
Visit our YouTube channel to learn step-by-step video tutorials
Watch the step-by-step video tutorial:
Click to buy Electricity Tender KPI Dashboard in Excel