In today’s data-driven world, energy management plays a crucial role in sustainability, operational efficiency, and cost control. Businesses across manufacturing, utilities, real estate, and service sectors are under increasing pressure to monitor their energy consumption, optimize resource usage, and meet sustainability goals.
The Energy KPI Scorecard in Excel offers a practical, user-friendly, and efficient way to track key energy performance indicators (KPIs), evaluate progress against targets, and make data-backed decisions. Whether you’re managing facility operations or implementing corporate energy-saving programs, this tool brings transparency and insight into your energy performance metrics.
Click to Purchases Energy KPI Scorecard in Excel
🔍 What Is an Energy KPI Scorecard?
An Energy KPI Scorecard is a structured performance tracking system that allows organizations to monitor energy-related KPIs such as consumption, cost, efficiency, and carbon emissions. By comparing actual performance vs. targets, it provides a visual representation of how well energy objectives are being achieved.
Built in Microsoft Excel, the scorecard uses formulas, dropdowns, and color-coded visuals to simplify complex data. It helps both technical and non-technical users understand performance trends and make informed operational decisions.
🧭 Structure of the Energy KPI Scorecard in Excel
The Energy KPI Scorecard template comes with four well-organized worksheets designed to ensure smooth navigation and efficient data management.
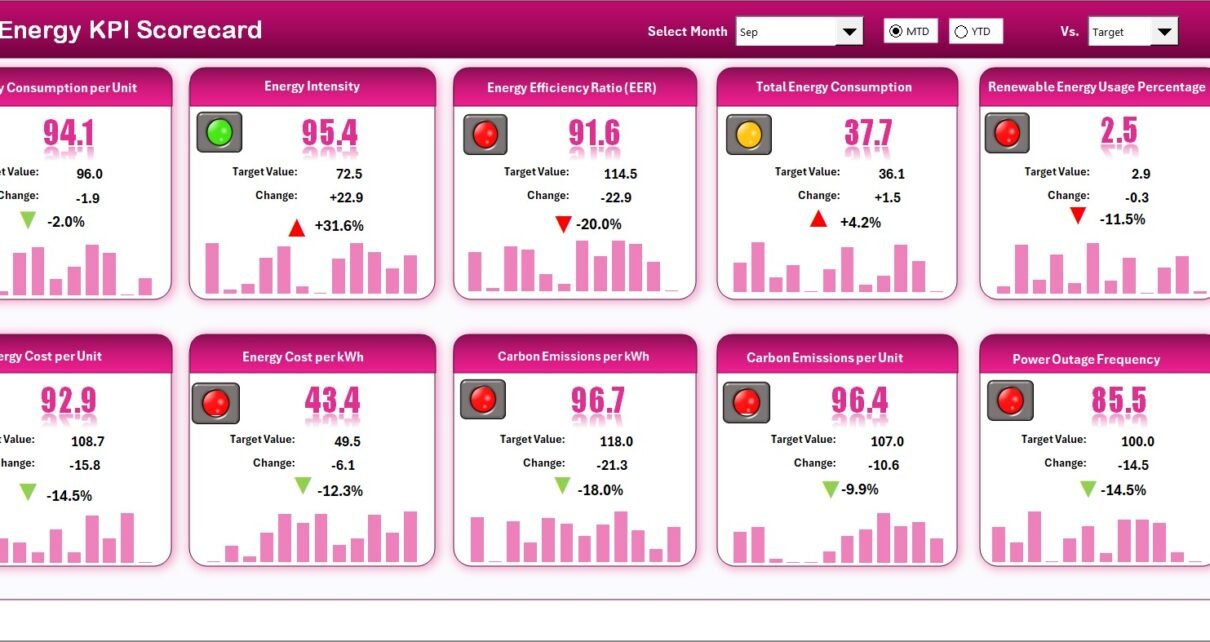
1️⃣ Scorecard Sheet – Your Performance Dashboard
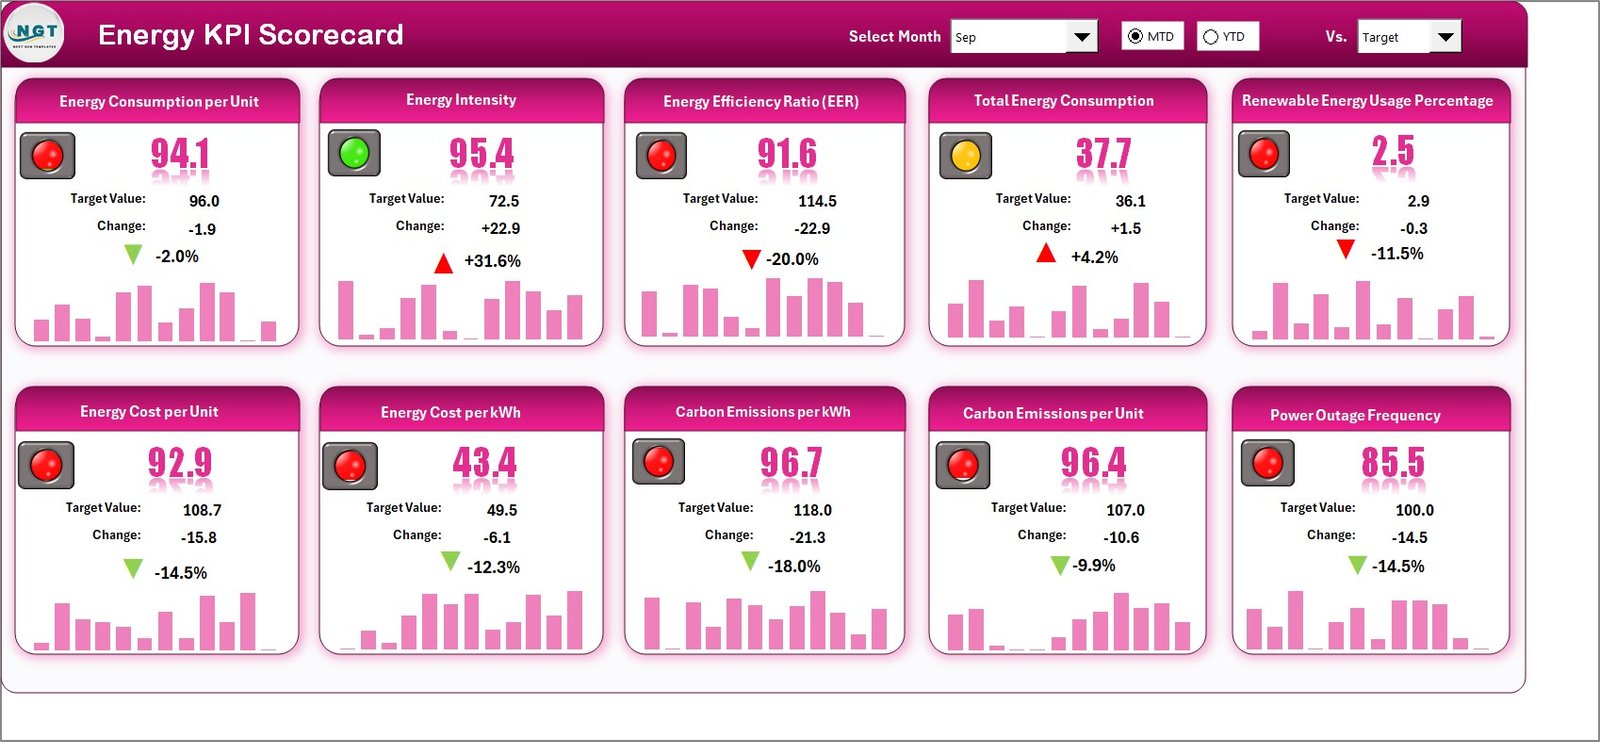
The Scorecard Sheet serves as the main interface where energy KPIs are summarized for quick decision-making. It provides a clear snapshot of how your organization performs across key metrics.
Key Features:
✅ Dropdown Menus: Select the desired Month, MTD (Month-to-Date), or YTD (Year-to-Date) option for detailed analysis.
📊 Actual vs. Target Values: Compare performance with defined benchmarks to track progress effectively.
🎨 Visual Indicators: Use color-coded conditional formatting (green, yellow, red) to instantly identify areas of success or concern.
📈 Comprehensive KPI Overview: Review up to 10 KPIs in one view, enabling leadership teams to evaluate performance at a glance.
Why It Matters:
This sheet centralizes all critical information, ensuring that teams can monitor consumption and efficiency trends without navigating multiple files or systems.
2️⃣ KPI Trend Sheet – Analyze Historical Performance
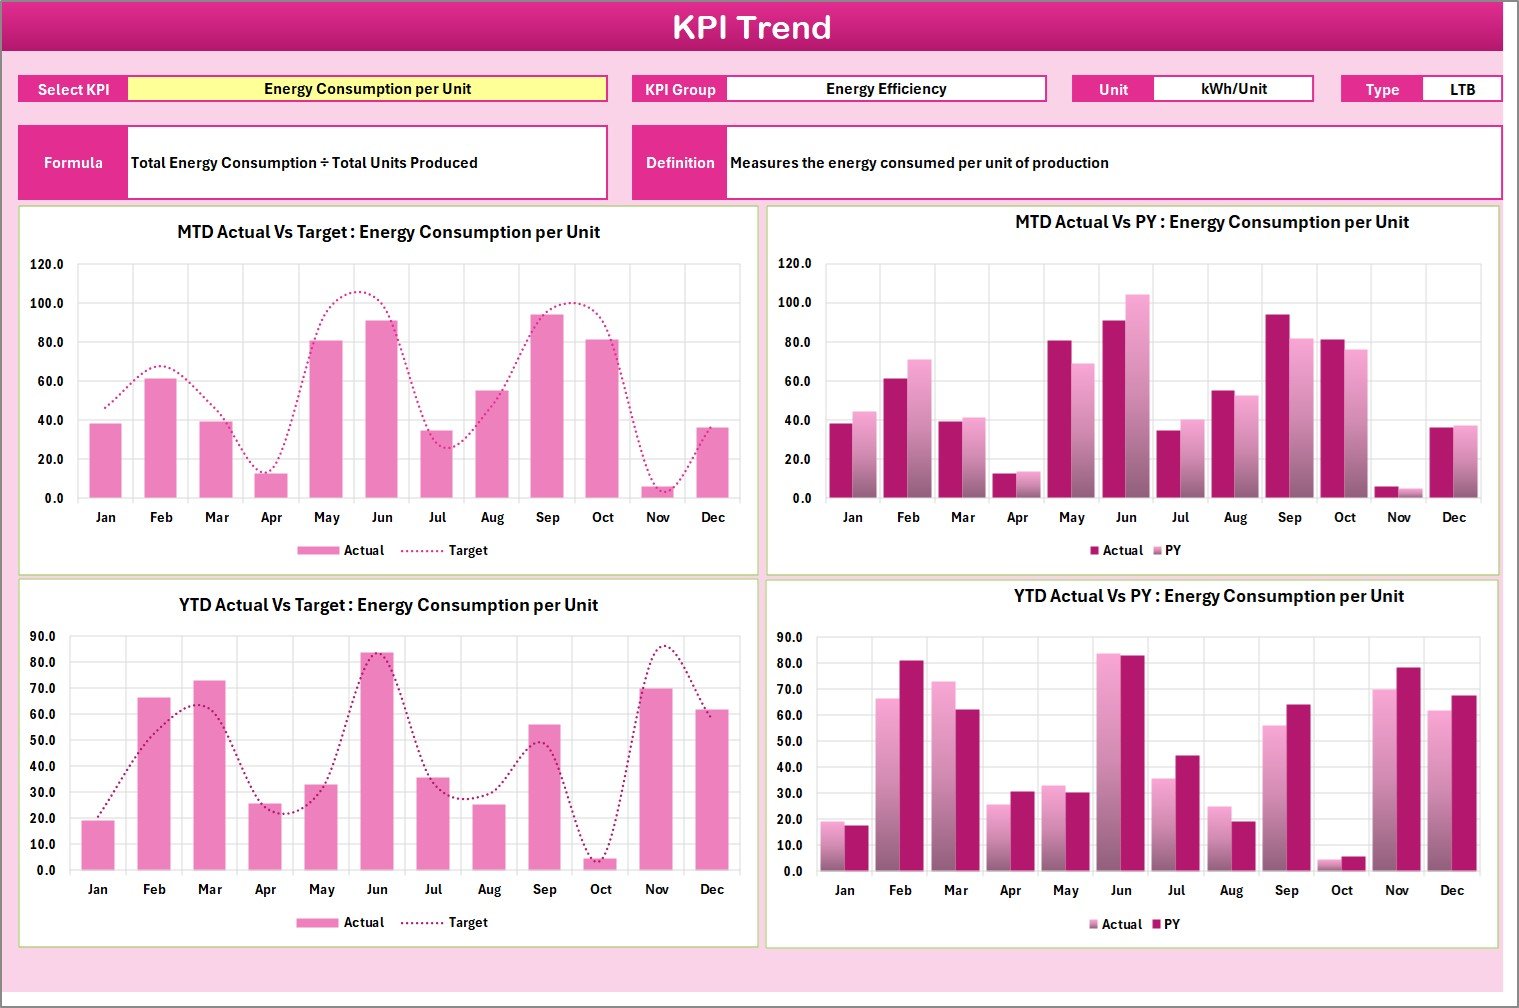
The KPI Trend Sheet helps visualize the performance pattern of each KPI over time. It is ideal for identifying trends, seasonal variations, or anomalies in energy consumption and cost data.
Key Features:
📌 Dropdown Selection: Choose a KPI name from the dropdown in cell C3 to filter the view dynamically.
🧩 KPI Details: Displays KPI Group, Unit, Formula, Type (LTB – Lower the Better or UTB – Upper the Better), and Definition.
📈 Trend Charts: View MTD and YTD performance trends for Actual, Target, and Previous Year (PY) values.
Why It Matters:
Trend analysis helps energy managers detect inefficiencies and understand whether ongoing initiatives deliver measurable results.
3️⃣ Input Data Sheet – Manage All Energy Metrics
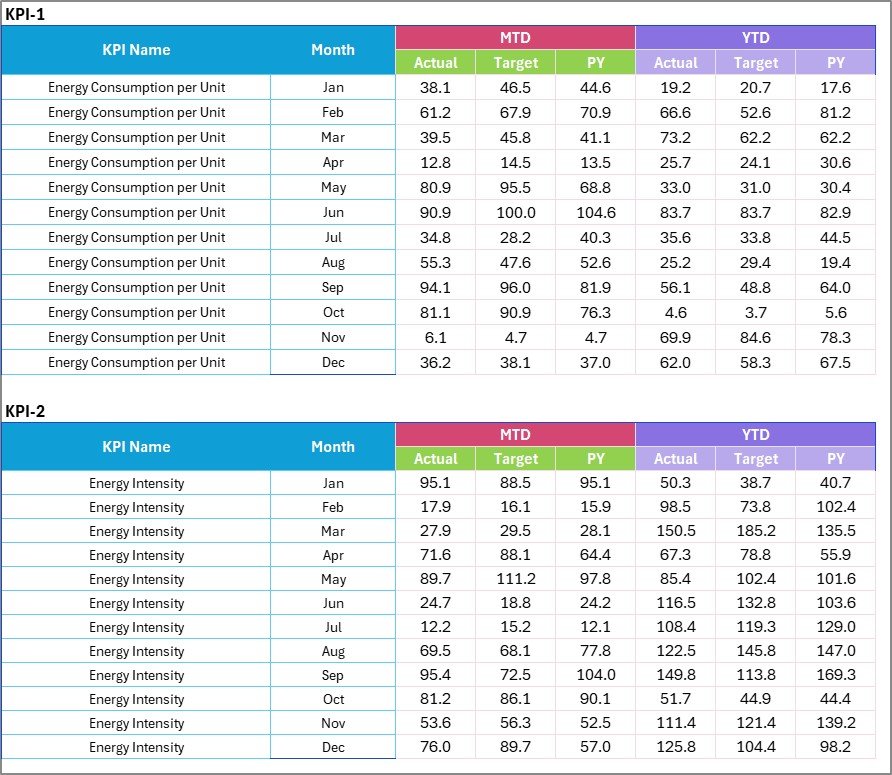
The Input Data Sheet is the backbone of the scorecard, where you record raw data such as energy usage, cost, efficiency ratios, and other relevant metrics.
Key Features:
-
📝 Data Entry Made Easy: Enter Actual, Target, and Previous Year data for each KPI and month.
-
🔄 Dynamic Updates: Easily modify or append new data as results come in.
-
⚙️ Consistency: Maintain accurate and up-to-date records for reliable reporting.
Why It Matters:
This sheet eliminates data duplication and errors by maintaining a centralized location for all performance metrics.
4️⃣ KPI Definition Sheet – Clarify the Metrics
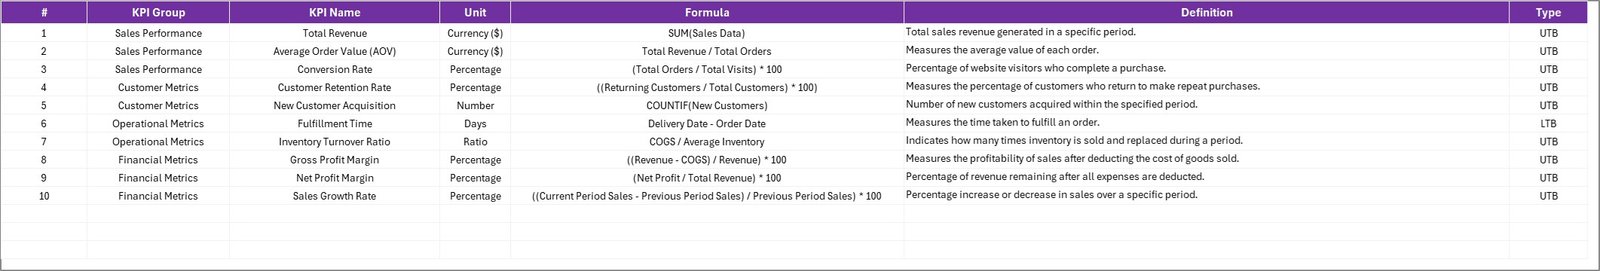
The KPI Definition Sheet defines every KPI included in the scorecard. It’s the go-to reference for understanding how each metric is calculated and why it matters.
Key Features:
-
📚 Comprehensive List: Includes KPI Name, Group, Unit, Formula, and Definition.
-
🔍 Type Classification: Indicates whether a KPI’s performance improves when the value is higher (UTB) or lower (LTB).
-
🎯 Transparency: Ensures all stakeholders interpret KPIs consistently.
Why It Matters:
This sheet fosters accountability and clarity by documenting how energy metrics are measured across departments.
⚡ Importance of Energy KPIs in Business Operations
Tracking energy performance indicators is not just about measuring usage—it’s about driving efficiency, sustainability, and profitability. Here’s why organizations rely on Energy KPI Scorecards:
🌎 Sustainability Compliance: Many industries must report energy and emission data for sustainability compliance.
💰 Cost Management: Monitoring energy use helps reduce waste and control utility costs.
🏭 Operational Efficiency: Identifying inefficient equipment or processes leads to smarter energy use.
🔋 Performance Benchmarking: Comparing performance against past data and targets helps evaluate improvements.
📈 Data-Driven Strategy: Energy KPIs guide investment in renewable energy and technology upgrades.
💡 Advantages of Energy KPI Scorecard in Excel
Implementing an Energy KPI Scorecard provides several tangible and strategic benefits:
🔸 Centralized Monitoring
Track all key metrics—costs, consumption, and emissions—in one organized file, simplifying analysis and reporting.
🔸 Improved Decision-Making
Visual indicators help management identify which KPIs require attention, enabling data-driven energy-saving initiatives.
🔸 Cost Reduction
By identifying inefficiencies and excessive consumption, businesses can reduce utility expenses significantly.
🔸 Sustainability Tracking
Organizations can measure carbon footprint and renewable energy usage, supporting ESG and sustainability goals.
🔸 Customization Flexibility
Excel offers customization options for formulas, visuals, and KPI selection, adapting the tool to any energy management strategy.
🔸 Easy to Use and Maintain
No complex software or licensing required—Excel makes energy tracking accessible to everyone.
Click to Purchases Energy KPI Scorecard in Excel
📊 How to Use the Energy KPI Scorecard Step-by-Step
-
Set Up KPI Definitions – Define all KPIs in the KPI Definition Sheet.
-
Enter Data Monthly – Record Actual, Target, and Previous Year data in the Input Data Sheet.
-
View Trends – Use the KPI Trend Sheet to analyze performance over time.
-
Evaluate Performance – Review MTD/YTD results on the Scorecard Sheet.
-
Update Regularly – Refresh the data monthly for accurate tracking and reporting.
🔍 Opportunities for Improvement
Even with a strong foundation, organizations can enhance their Energy KPI tracking by focusing on:
🧠 Automated Data Collection: Integrate data import from IoT meters or energy software to reduce manual effort.
📱 Interactive Dashboards: Add Excel slicers and pivot charts for dynamic filtering.
📆 Goal Alignment: Link KPIs with departmental goals for strategic energy management.
🔁 Periodic Review: Regularly revisit KPI definitions to align with changing business objectives.
🌍 Benchmark Comparison: Compare your data with industry standards or peers for competitive insights.
🧭 Best Practices for Using the Energy KPI Scorecard in Excel
Following best practices ensures accuracy, consistency, and actionable insights.
✅ 1. Define SMART KPIs
Ensure each KPI is Specific, Measurable, Achievable, Relevant, and Time-bound.
✅ 2. Keep Data Updated
Update KPI data monthly or weekly to maintain real-time visibility into performance.
✅ 3. Standardize Units and Definitions
Use consistent measurement units (e.g., kWh, CO₂, USD) and definitions across all departments.
✅ 4. Use Conditional Formatting
Leverage Excel’s color-coded visualizations (red, yellow, green) to make data interpretation intuitive.
✅ 5. Integrate with Other Systems
Import data from ERP or Building Management Systems to automate data updates.
✅ 6. Protect Data Integrity
Lock formula cells and use dropdown lists to prevent accidental edits.
✅ 7. Review Trends Periodically
Regularly check the KPI Trend Sheet to ensure long-term performance improvements.
🏁 Conclusion
The Energy KPI Scorecard in Excel empowers organizations to monitor, analyze, and improve their energy performance in an efficient and structured manner. It bridges the gap between raw data and actionable insights, helping decision-makers reduce costs, enhance sustainability, and drive performance excellence.
By leveraging Excel’s simplicity and analytical power, this tool becomes a cornerstone for achieving operational efficiency and meeting sustainability objectives. Whether you’re managing a single facility or an enterprise-wide energy portfolio, this scorecard will help you stay on top of every metric that matters.
Click to Purchases Energy KPI Scorecard in Excel
Frequently Asked Questions (FAQs)
1. What is an Energy KPI Scorecard used for?
An Energy KPI Scorecard is used to monitor and analyze energy performance metrics like consumption, cost, efficiency, and emissions. It helps businesses identify inefficiencies and implement corrective measures.
2. Why should I use Excel for Energy KPIs?
Excel provides flexibility, cost-effectiveness, and accessibility. You can easily customize the scorecard, visualize trends, and perform data analysis without needing specialized software.
3. How often should the Energy Scorecard be updated?
Ideally, the scorecard should be updated monthly or weekly to ensure that decisions are based on the most current data available.
4. What are the most common Energy KPIs to track?
Typical KPIs include total energy consumption, energy cost, carbon emissions, renewable energy ratio, and equipment efficiency.
5. Can this Excel Scorecard handle multiple facilities?
Yes. You can expand the template by adding a “Location” column or using filters and pivot tables to analyze multiple sites.
6. How can the Energy KPI Scorecard improve sustainability?
By tracking renewable energy usage, carbon emissions, and energy intensity, the scorecard helps organizations achieve their sustainability and ESG targets.
7. Is it suitable for small businesses?
Absolutely! The Excel-based scorecard is scalable and can be adapted for small offices, factories, or large organizations.
8. Can I integrate this scorecard with Power BI or Google Sheets?
Yes. You can export data from Excel to Power BI or Google Sheets for advanced visualization and dashboard automation.
Click to Purchases Energy KPI Scorecard in Excel
Visit our YouTube channel to learn step-by-step video tutorials