Managing employee retention in sustainability-focused organizations is more critical than ever. In the race toward environmental responsibility, retaining skilled and purpose-driven employees can make or break your green mission. That’s where the Environmental and Sustainability Employee Retention KPI Dashboard in Excel becomes a game-changer.
In this comprehensive article, we’ll walk you through everything you need to know about this Excel-based dashboard—how it works, its key features, best practices, advantages, and much more. Whether you’re an HR professional, sustainability officer, or data analyst, this tool helps you track what really matters—employee engagement, stability, and retention in green operations.
Click to Purchases Environmental and Sustainability Employee Retention KPI Dashboard in Excel
What Is the Environmental and Sustainability Employee Retention KPI Dashboard in Excel?
This is not just a spreadsheet—it’s a ready-to-use KPI dashboard built in Excel to help organizations monitor, track, and improve employee retention metrics directly linked to environmental and sustainability roles. Designed for professionals managing CSR, ESG, green operations, or HR teams supporting these functions, the dashboard is simple, dynamic, and actionable.
The tool includes 7 structured worksheet tabs, enabling users to interact with data, visualize KPI trends, and draw actionable insights with just a few clicks.
Key Features of the KPI Dashboard
Here are the main highlights that make this Excel dashboard stand out:
Home Sheet – Your Command Center

-
This index sheet contains 6 buttons for quick navigation to other sheets.
-
It acts as a central hub where users can quickly jump to key dashboards and input sheets.
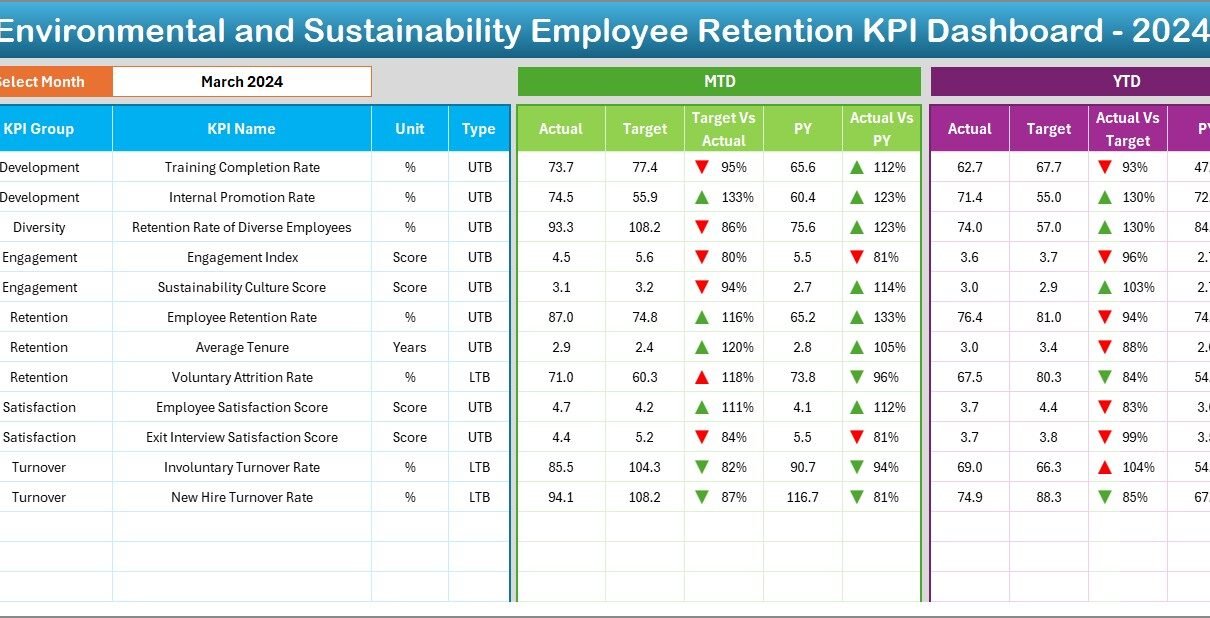
Dashboard Sheet Tab – Visualize Employee Retention KPIs

-
Select any month using the drop-down in cell D3.
Instantly view updated metrics including:
- MTD Actual vs Target
- MTD Actual vs Previous Year
- YTD Actual vs Target
- YTD Actual vs Previous Year
-
Smart conditional formatting (with arrow indicators) instantly shows performance trends.
KPI Trend Sheet Tab – Deep Dive Into Trends

Choose any KPI from a dropdown (cell C3) to view:
- KPI group, unit, formula, and type (UTB or LTB)
- Clear MTD and YTD trend charts comparing actuals vs targets and previous year
Actual Numbers Input Sheet

-
Input your MTD and YTD actual values here.
-
Update the starting month using cell E1 to reflect your fiscal year start.
Target Sheet Tab

-
Enter MTD and YTD target values for each KPI monthly.
Previous Year Number Sheet

-
Add the corresponding last year’s MTD and YTD numbers for benchmarking.
KPI Definition Sheet

Enter complete KPI metadata:
- KPI Name, Group, Unit, Formula, and Definition
- Define whether it’s a UTB (Upper the Better) or LTB (Lower the Better)
Advantages of Using an Employee Retention KPI Dashboard
Using this dashboard brings several advantages for environmentally conscious teams:
Improve HR Decision-Making
-
Understand why employees in green roles stay or leave.
-
Pinpoint key areas of dissatisfaction and address them proactively.
Visualize KPI Trends Over Time
-
Instant charts and arrows tell you what’s improving or declining.
-
Detect seasonal patterns, retention spikes, or downturns.
Measure Against Targets and Past Performance
-
Always know how your current performance stacks up against targets and the previous year.
Track Multiple KPIs Simultaneously
-
From Average Tenure of Sustainability Staff to Exit Rate in Green Roles, monitor 12+ KPIs in one place.
Fully Customizable and Scalable
-
Add your own formulas, KPIs, and departments.
-
Fits any small business or large enterprise with environmental operations.
Click to Purchases Environmental and Sustainability Employee Retention KPI Dashboard in Excel
How to Use the Dashboard – Step-by-Step
Step 1: Start at the Home Sheet
Use the index buttons to quickly jump to the relevant section.
Step 2: Enter Your Data
-
Update actual values on the Actual Numbers Input tab.
-
Define your month start in cell E1.
-
Fill in your monthly targets in the Target tab.
-
Add last year’s numbers in the Previous Year tab.
Step 3: Analyze the Dashboard
-
Go to the Dashboard tab.
-
Choose the month in cell D3.
-
View instantly updated cards, charts, and KPI trends.
Step 4: Track Trends Over Time
-
Use the KPI Trend tab to view graphical changes month-to-month.
-
Drill down by KPI to see what’s moving in the right direction—or not.
Best Practices for the Environmental Retention KPI Dashboard
To get the most out of this dashboard, follow these best practices:
✅ Keep the KPI List Clear and Focused
Avoid overcrowding the dashboard. Stick to 10–15 high-impact KPIs.
📅 Update Monthly Without Fail
Timely updates ensure that MTD and YTD comparisons remain meaningful.
📈 Use Previous Year Comparisons Strategically
Understanding past trends gives you the context to evaluate current performance.
🧠 Use the Data to Drive Action
Don’t just track data—act on insights. Low engagement? Run a survey. High turnover? Review exit interviews.
🛠 Customize to Your Organization
Add department-specific filters, rename KPIs, or include salary breakdowns based on your structure.
Why Excel for Environmental HR Dashboards?
You might wonder: Why not Power BI or Google Sheets?
Here’s why Excel is perfect for this kind of dashboard:
-
💻 Offline & Lightweight – No internet needed, works on any machine.
-
🧮 Customizable – Use formulas, macros, and pivot tables as per your requirement.
-
🧾 Printable Reports – Easy export to PDF or print for board meetings.
-
🔄 Built-in Controls – Conditional formatting, dropdowns, and slicers for interaction.
Who Can Benefit From This Dashboard?
This tool is ideal for:
-
HR Managers in sustainability-focused companies
-
CSR and ESG Professionals
-
Sustainability Department Heads
-
HR Analytics Consultants
-
Environmental NGOs
-
Green Manufacturing Units
Use Cases and Real-World Scenarios
1. CSR Department in a Renewable Energy Company
Track retention and exit rate of solar engineers and sustainability experts. Improve onboarding and engagement based on historical trends.
2. Green Startups
Monitor whether your startup is retaining mission-driven employees. Identify if high exit rates are linked to project stress or lack of recognition.
3. Government Sustainability Division
Evaluate how training and engagement programs are helping retain climate-focused staff across regions.
Sample Visualization from the Dashboard
Here’s what you’ll see once data is entered:
-
📊 Bar Charts: “Monthly Exit Rate vs Target”
-
📈 Line Graphs: “YTD Retention Rate Trend”
-
🧭 Arrow Indicators: Green for improvement, red for decline
-
💬 KPI Cards: Retention Rate, Average Tenure, Satisfaction Index, and more
Conclusion
The Environmental and Sustainability Employee Retention KPI Dashboard in Excel empowers organizations to monitor key workforce metrics, improve team stability, and support long-term sustainability goals. By providing a visual, interactive, and customizable interface, this tool transforms raw HR data into actionable insights.
If your organization cares about both people and the planet, then this dashboard is your go-to solution for retention tracking in sustainability roles. Try it, tweak it, and watch your impact grow!
❓ Frequently Asked Questions (FAQs)
1. What KPIs are best for tracking retention in sustainability teams?
You should track retention rate, average tenure, exit rate, employee engagement, and training hours—especially in ESG and green roles.
2. Is this dashboard suitable for small businesses?
Absolutely! Whether you’re a 10-person startup or a large company, the dashboard is fully scalable and customizable.
3. Can I add my own KPIs to the dashboard?
Yes. Just update the KPI Definition sheet and align your formulas in the Target and Actuals sheets.
4. Do I need Excel VBA to use this dashboard?
No. This dashboard runs entirely on standard Excel features such as formulas, charts, slicers, and conditional formatting.
5. Can I use this tool for non-environmental roles?
Yes, although it’s tailored for sustainability teams, you can easily adapt the KPIs to suit any department.
Visit our YouTube channel to learn step-by-step video tutorials