In today’s business landscape, sustainability is no longer just a buzzword—it’s a strategic imperative. Companies worldwide are now integrating environmental considerations into their product development process. But how do you measure and track performance in this evolving area? The answer lies in a powerful tool: the Environmental and Sustainability Product Development KPI Dashboard in Excel.
This ready-to-use Excel dashboard offers a comprehensive way to monitor sustainability-focused key performance indicators (KPIs) related to product development. With structured data input, dynamic visualizations, and month-wise tracking, this tool empowers organizations to make informed, eco-friendly decisions.
Click to Purchases Environmental and Sustainability Product Development KPI Dashboard in Excel
What is an Environmental and Sustainability Product Development KPI Dashboard?
The Environmental and Sustainability Product Development KPI Dashboard is an Excel-based tool that helps organizations monitor their sustainability efforts throughout the product development cycle. It provides real-time insights into how well the company aligns with environmental goals while developing new products or improving existing ones.
By capturing data such as energy consumption, carbon footprint, recycled content usage, compliance rates, and more, this dashboard transforms raw data into meaningful visuals and performance trends.
Key Features of the Dashboard
This Excel-based template contains seven well-structured worksheets, each serving a distinct purpose for effective KPI monitoring:
Home Sheet
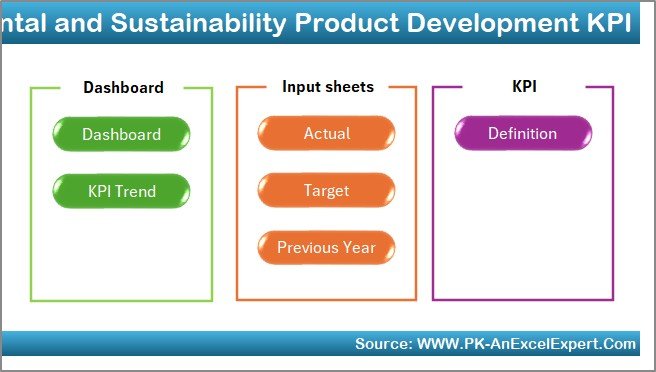
The Home sheet functions as a navigational hub. It features six clickable buttons that let users quickly jump to relevant sections of the dashboard. This centralized access improves usability and saves time.
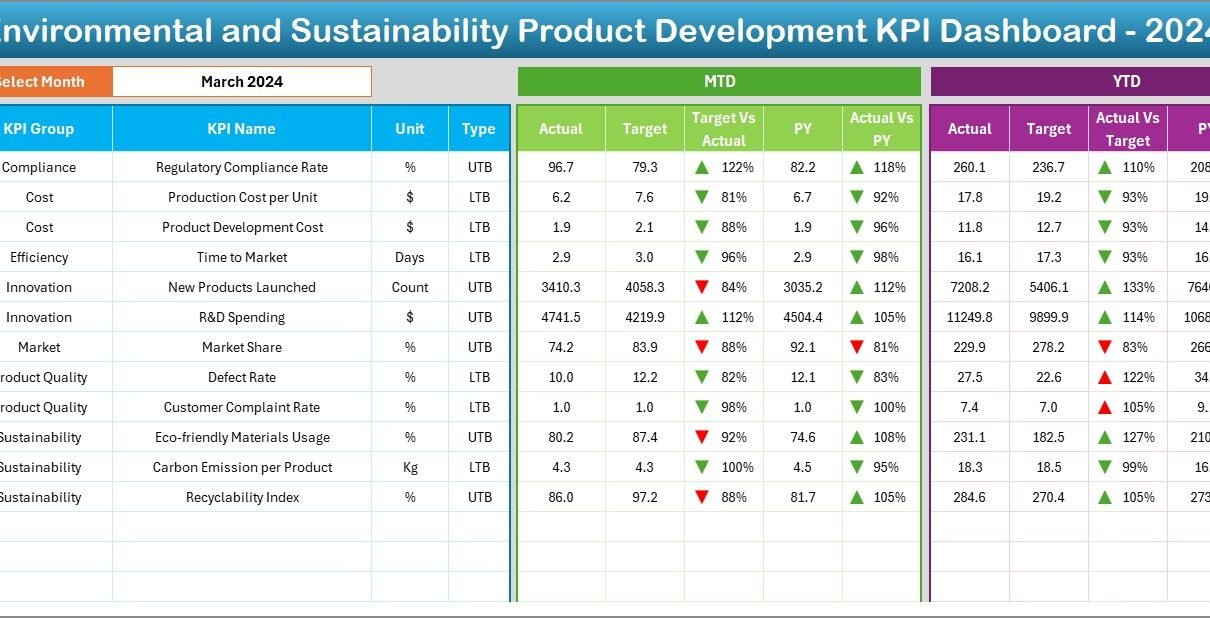
Dashboard Sheet

This is the main visualization sheet of the entire tool. You can choose a specific month from the dropdown at cell D3, and the entire dashboard updates instantly to show:
-
MTD (Month-to-Date) Actual, Target, and Previous Year numbers
-
YTD (Year-to-Date) Actual, Target, and Previous Year numbers
-
Conditional formatting with up/down arrows to indicate performance trends
It provides both Target vs. Actual and PY (Previous Year) vs. Actual comparisons, giving users an at-a-glance understanding of progress.
KPI Trend Sheet
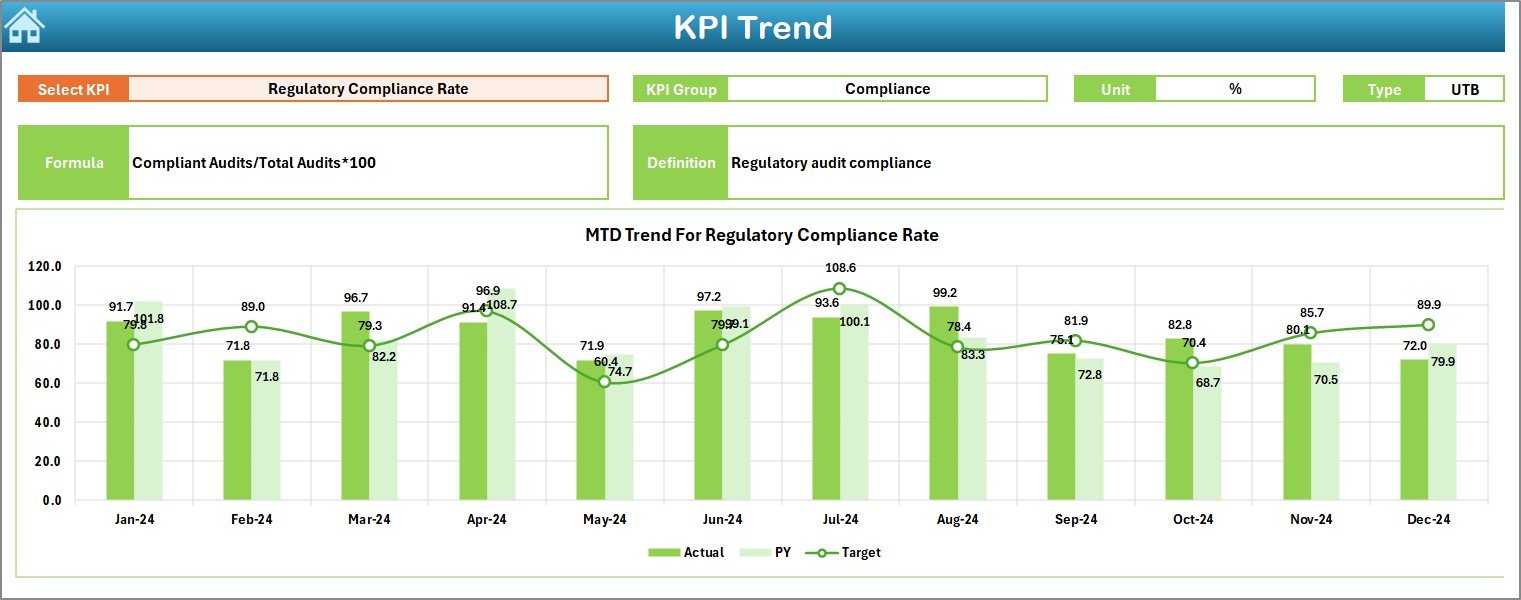
This sheet allows users to:
-
Select a specific KPI from a dropdown menu (cell C3)
View KPI details including:
- Group
- Unit
- Type (UTB: Upper The Better or LTB: Lower The Better)
- Formula
- Definition
-
Track MTD and YTD performance trends through line charts for Actual, Target, and Previous Year
Actual Numbers Input Sheet
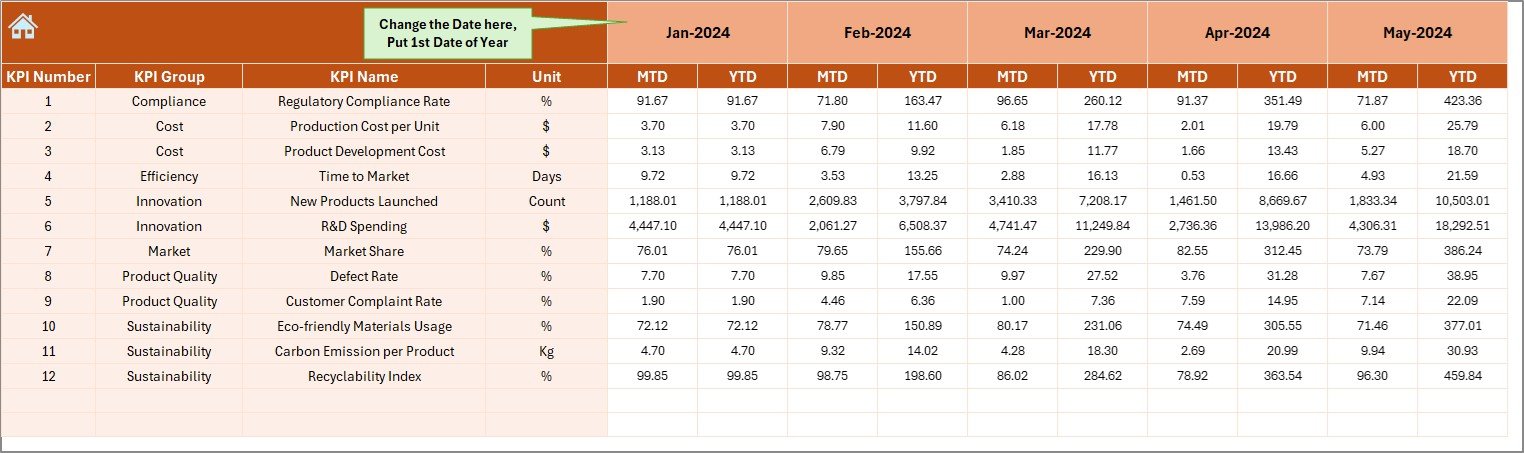
Users can input actual MTD and YTD figures for each month. The month starts from the value entered in cell E1, ensuring flexible customization based on the organization’s fiscal calendar.
Target Sheet
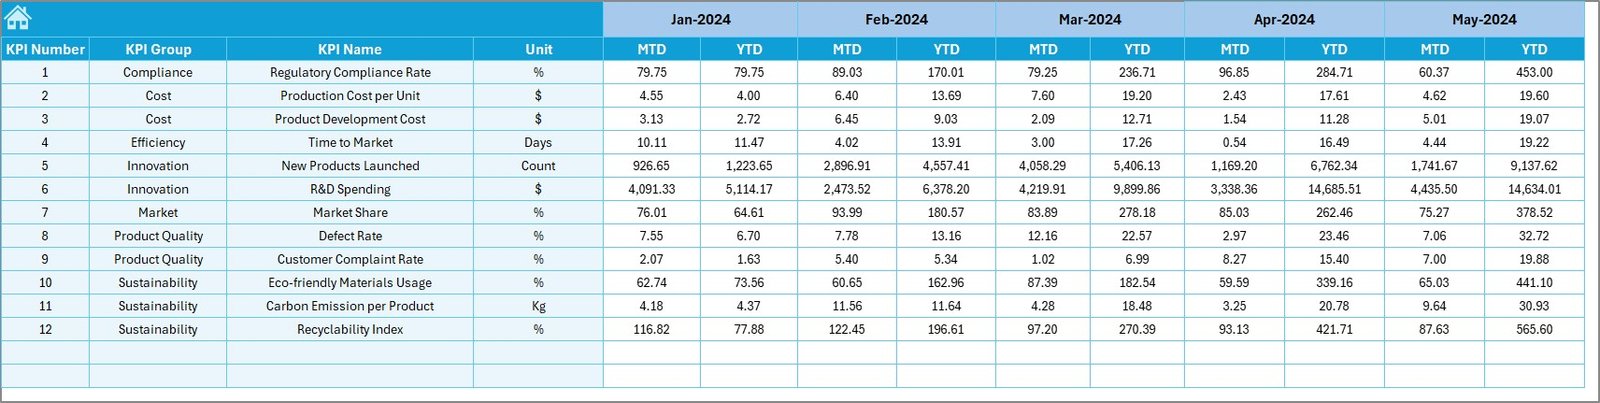
This sheet holds monthly and yearly target values for all defined KPIs. Entering accurate targets helps in identifying gaps and tracking performance effectively.
Click to Purchases Environmental and Sustainability Product Development KPI Dashboard in Excel
Previous Year Number Sheet
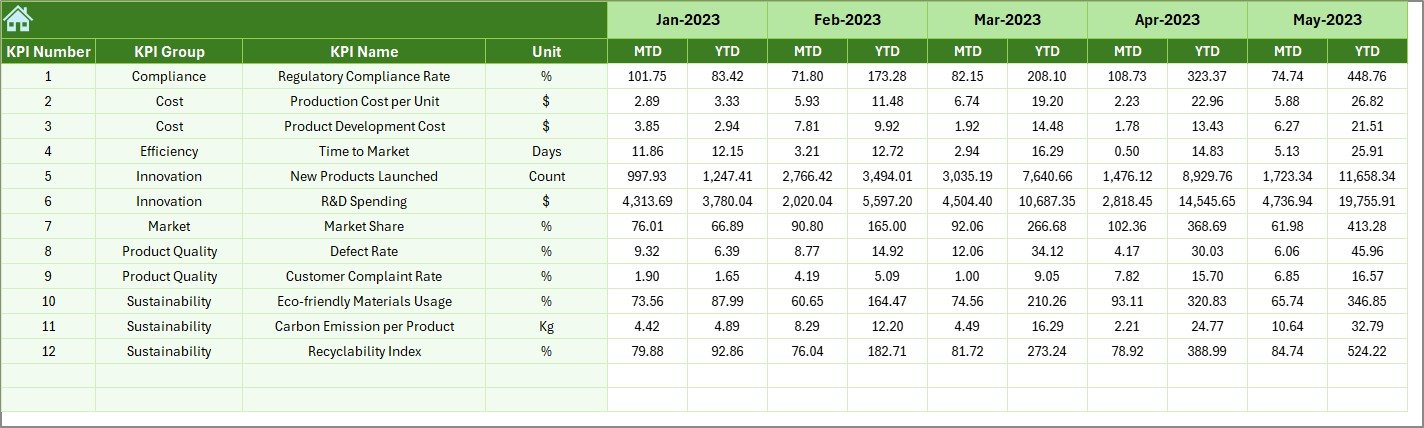
Here, users can input corresponding performance data for the previous year. This makes year-over-year comparisons seamless.
KPI Definition Sheet
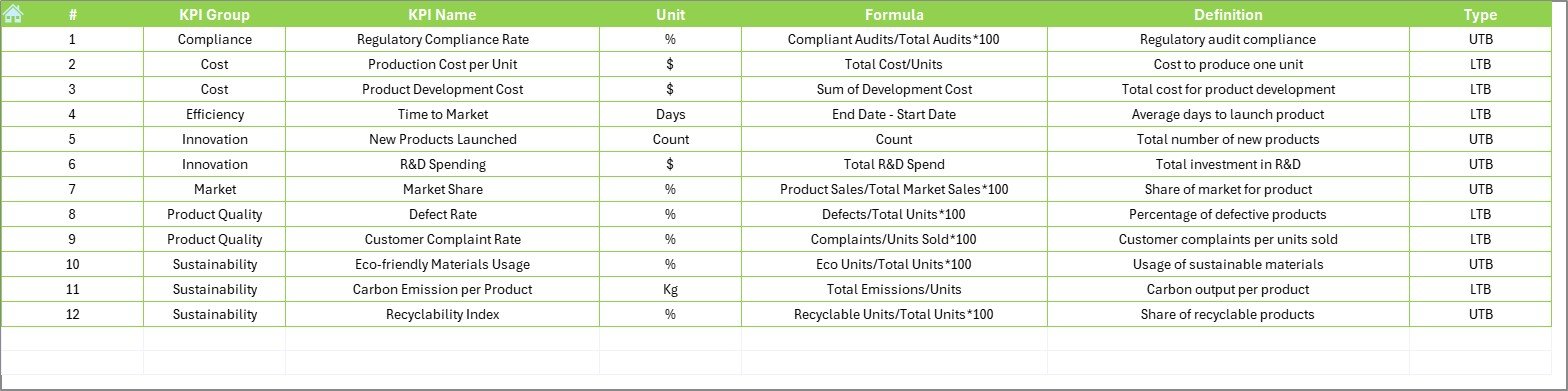
This is the foundational tab where users define:
-
KPI Name
-
KPI Group
-
Unit
-
Formula
-
Short Definition
These definitions ensure every team member interprets the KPIs consistently and correctly.
Why Use a Sustainability KPI Dashboard?
Organizations face increasing pressure from regulators, investors, and customers to demonstrate environmental accountability. A well-structured dashboard helps organizations:
-
Track environmental performance across product development
-
Identify areas where sustainability goals fall short
-
Make data-driven improvements
-
Meet ESG (Environmental, Social, Governance) reporting requirements
What KPIs Can You Track with This Dashboard?
Here are some commonly tracked environmental and sustainability product development KPIs:
-
Energy consumption per product unit
-
Water usage in development processes
-
% of recycled materials used
-
Number of eco-certified products
-
Carbon emissions per product lifecycle
-
% of R&D spend on sustainable innovation
-
Compliance rate with green standards (e.g., RoHS, REACH)
You can customize the dashboard to reflect your unique KPIs.
Advantages of Using the KPI Dashboard in Excel
Using Excel for KPI tracking comes with several strategic and operational benefits.
✅ Easy to Use and Customize
-
Excel is familiar to most users
-
Formulas and structure can be tailored to specific needs
📉 Real-Time Performance Monitoring
-
View performance monthly and yearly
-
Visual indicators show if you’re meeting targets or falling behind
🔄 Improved Data Consistency
-
Centralized entry points ensure consistent, error-free reporting
📊 Professional-Quality Visualizations
-
Dynamic charts and trend lines communicate data effectively
🌱 Sustainability-Driven Culture
-
Keeps environmental performance front and center during product development
Best Practices for the Environmental and Sustainability KPI Dashboard
To get the most out of your dashboard, follow these tried-and-true tips:
1. Define Clear and Relevant KPIs
Choose KPIs that align with your organization’s sustainability and product development goals. Avoid generic metrics.
2. Use Accurate and Updated Data
Ensure all actual and target data is updated monthly for meaningful analysis.
3. Involve Cross-Functional Teams
Collaborate with R&D, compliance, production, and sustainability teams to ensure comprehensive tracking.
4. Analyze Trends, Not Just Numbers
Use the KPI Trend sheet regularly to identify improvement opportunities or patterns of underperformance.
5. Review and Update KPI Definitions
Periodically revisit the KPI Definition tab to ensure clarity and alignment with changing business goals.
Opportunities for Improvement in Product Sustainability Tracking
While this dashboard covers a lot, you can further enhance your sustainability initiatives by:
-
Integrating supplier sustainability data
-
Adding a waste management KPI group
-
Using Power Query for automation
-
Connecting to live databases or IoT devices for real-time inputs
-
Linking the dashboard with corporate ESG platforms
How to Implement This Dashboard in Your Organization?
Follow these steps to implement the dashboard smoothly:
-
Customize KPI Definitions: Input your business-specific KPIs and categories.
-
Set Monthly and Yearly Targets: Enter realistic but challenging goals.
-
Collect Historical Data: Fill in the previous year’s numbers for baseline analysis.
-
Train Your Team: Ensure everyone knows how to input data and read the dashboard.
-
Monitor and Improve: Hold monthly reviews to evaluate and optimize strategies.
What Makes This Excel Dashboard Unique?
-
Ready to use out-of-the-box
-
Fully editable and customizable
-
Designed with sustainability goals in mind
-
Visualizations update dynamically with one dropdown selection
-
Includes both MTD and YTD insights for actionable decisions
Whether you’re a sustainability analyst, a product manager, or a business executive, this tool brings structure and insight to your environmental tracking efforts.
Conclusion
The Environmental and Sustainability Product Development KPI Dashboard in Excel is a game-changing tool for businesses committed to eco-conscious innovation. By organizing, visualizing, and analyzing your environmental performance data, you not only ensure compliance but also drive real impact.
Incorporating this dashboard into your operations will help build transparency, boost efficiency, and foster a culture of sustainability—all within a familiar Excel environment.
Frequently Asked Questions (FAQs)
❓ What is the purpose of a Sustainability KPI Dashboard?
A Sustainability KPI Dashboard helps businesses track their environmental performance in areas like product development, resource usage, emissions, and compliance.
❓ Can I customize the dashboard for different industries?
Yes. The dashboard is fully editable, allowing you to tailor KPI names, formulas, and visuals to your specific industry or organizational goals.
❓ How do I input actual numbers and targets?
Use the “Actual Numbers Input” sheet to input MTD and YTD values and the “Target” sheet to define your monthly and yearly targets.
❓ What if I want to track more than 12 KPIs?
You can extend the KPI Definition and related sheets to accommodate more KPIs. Just ensure consistent formula referencing.
❓ Is Excel a good tool for sustainability reporting?
Absolutely. Excel is highly versatile, and with templates like this, you can track detailed sustainability metrics without needing expensive software.
❓ Can I automate data entry in this dashboard?
Yes. You can enhance the dashboard using Power Query, VBA, or by connecting it to cloud data sources to automate inputs.
Visit our YouTube channel to learn step-by-step video tutorials