In the modern era of sustainability and corporate responsibility, every organization strives to reduce its environmental footprint while improving operational efficiency. Businesses now need accurate tools to measure, monitor, and report their environmental performance.
That’s where the Environmental KPI Scorecard in Excel comes in — a simple yet powerful way to visualize key performance indicators (KPIs) related to sustainability, energy efficiency, and waste management.
This article explains everything you need to know about this scorecard — what it is, how it works, its benefits, best practices, and frequently asked questions.
Click to buy Environmental KPI Scorecard in Excel
What Is an Environmental KPI Scorecard in Excel?
An Environmental KPI Scorecard is a performance management tool designed in Microsoft Excel to track and analyze sustainability metrics. It brings together all critical environmental indicators into a single, interactive interface — helping organizations evaluate their performance against set targets.
This Excel-based scorecard provides a structured view of environmental performance across various areas such as:
- Energy consumption
- Water usage
- Carbon emissions
- Waste recycling rate
- Renewable energy share
- Environmental compliance
By monitoring these KPIs regularly, businesses can make data-driven decisions that support long-term sustainability goals.
Structure of the Environmental KPI Scorecard in Excel
The Environmental KPI Scorecard template includes four main worksheets, each serving a unique purpose:
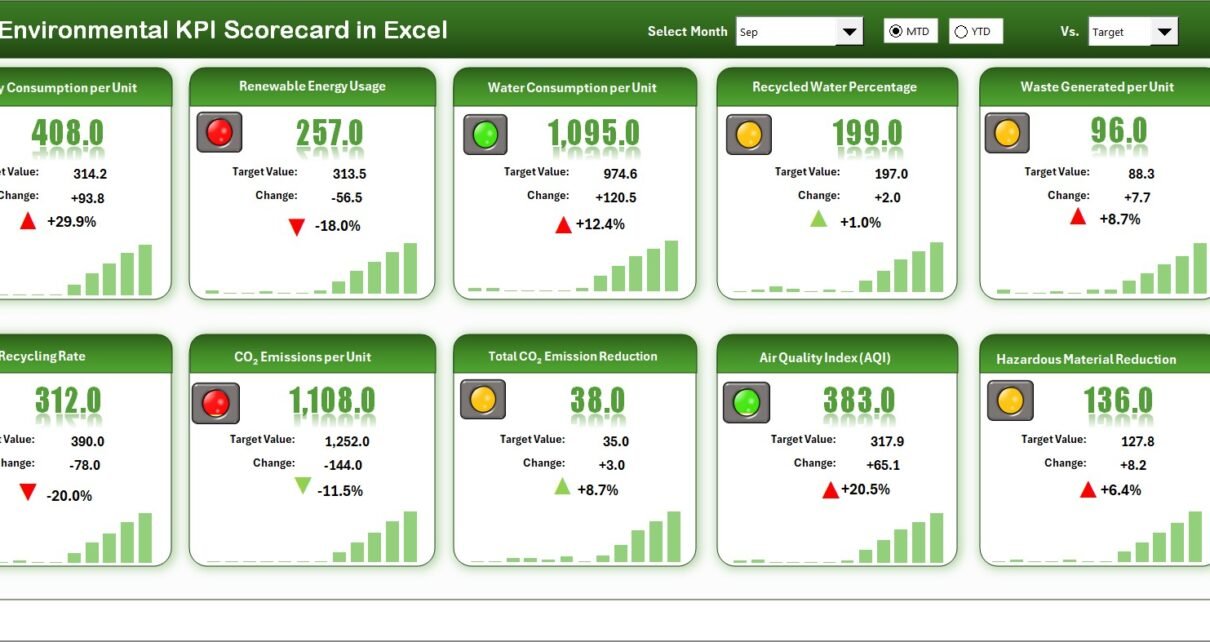
Scorecard Sheet
This is the main dashboard where all KPIs are summarized visually.

Click to buy Environmental KPI Scorecard in Excel
Key features include:
- Dropdown Menus: Select the month, MTD (Month-to-Date), or YTD (Year-to-Date) for quick performance review.
- Actual vs Target Comparison: Evaluate progress by comparing actual performance against defined targets.
- Visual Indicators: Easily identify trends with color-coded visuals (green for achieved, red for below target).
- Comprehensive Overview: View all KPIs, their units, and performance metrics at a glance.
- Multi-KPI Display: The sheet displays 10 KPIs per view, offering a balanced snapshot of environmental progress.
This design allows managers and sustainability teams to instantly understand which areas are performing well and which need corrective action.
KPI Trend Sheet Tab
The KPI Trend sheet focuses on the detailed performance of individual KPIs.
Key highlights:
- KPI Selection Dropdown: Choose any KPI from a dropdown (cell C3) to view detailed insights.
- Metadata Display: Shows the KPI Group, Unit, Type (Lower the Better or Upper the Better), Formula, and Definition.
- MTD and YTD Trend Charts: Visualize monthly and yearly performance for Actual, Target, and Previous Year (PY) data.
- Comparative Analytics: Quickly understand trends over time and identify consistent improvements or declines.
This trend sheet helps managers monitor performance fluctuations and make data-backed environmental decisions.

Click to buy Environmental KPI Scorecard in Excel
Input Data Sheet
The Input Data Sheet serves as the data entry section of the scorecard.
Here’s what makes it useful:
- Data Entry Fields: Input monthly actuals, targets, and PY values for each KPI.
- Flexible Structure: Add or update data anytime to keep the scorecard current.
- Automated Updates: As you enter new values, charts and visuals in the dashboard automatically refresh.
This structure ensures accuracy and transparency in environmental reporting.

KPI Definition Sheet Tab
This sheet defines each KPI clearly to avoid confusion or misinterpretation.
Includes the following fields:
- KPI Name – The name of the environmental metric.
- KPI Group – The category (e.g., Energy, Water, Waste).
- Unit – The measurement unit (e.g., kWh, liters, tons).
- Formula – The calculation logic used to derive the KPI.
- Definition – A brief description explaining the purpose of the metric.
This tab ensures that all team members understand how each KPI is calculated and interpreted.
Why Businesses Need an Environmental KPI Scorecard in Excel
Many organizations struggle to centralize and analyze their environmental performance data. The Environmental KPI Scorecard in Excel solves this by providing:
- A unified view of sustainability performance.
- Real-time comparisons of actual vs target data.
- Automated trend visualization with easy customization.
- Compatibility with any industry or sector.
Whether you are a manufacturing firm, logistics company, or service provider, this scorecard helps ensure compliance, improve performance, and support your sustainability goals.
Key Environmental KPIs You Can Track
How to Use the Environmental KPI Scorecard in Excel
Follow these steps to get started with your scorecard:
- Open the Template: Download and open the Environmental KPI Scorecard Excel file.
- Define KPIs: Enter KPI names, formulas, and definitions in the KPI Definition sheet.
- Input Data: Add monthly actual, target, and PY values in the Input Data sheet.
- Select Month: Go to the Scorecard sheet and choose a month from the dropdown menu.
- Analyze Trends: Use the KPI Trend sheet to examine performance visually.
- Take Action: Identify improvement areas and adjust your sustainability strategy accordingly.
This step-by-step process makes it easy for even non-technical users to track environmental progress effectively.
Advantages of the Environmental KPI Scorecard in Excel
Let’s explore why this scorecard is so valuable for organizations pursuing sustainability.
- Centralized Performance Tracking
All KPIs appear in one view, eliminating the need for multiple spreadsheets and manual calculations.
- Enhanced Decision-Making
The scorecard highlights performance gaps, enabling quick and informed environmental management decisions.
- Visual Clarity
Charts and conditional formatting make data easy to understand at a glance — ideal for management presentations.
- Real-Time Monitoring
Instant updates when you input new data ensure your reports always reflect the latest environmental performance.
- Customizable and Scalable
Users can easily modify the KPIs, add new metrics, or adjust visuals based on company requirements.
- Supports Regulatory Compliance
Helps ensure compliance with environmental regulations by tracking emission levels and sustainability goals.
- Cost-Effective Sustainability Management
Built entirely in Excel — no additional software or subscription required.
Best Practices for Using the Environmental KPI Scorecard in Excel
To make the most out of your Environmental KPI Scorecard, follow these best practices:
1. Define Clear KPI Targets
Set realistic and measurable targets for every KPI. For example, “reduce energy consumption by 10% over the next 6 months.”
2. Use Consistent Data Sources
Always collect data from verified and consistent sources to maintain accuracy and reliability.
3. Update Regularly
Enter monthly or quarterly data promptly to maintain accurate MTD and YTD comparisons.
4. Review Trends Frequently
Use trend charts to identify seasonal variations and long-term improvements.
5. Engage All Departments
Involve every department — from operations to HR — in the sustainability reporting process.
6. Benchmark Performance
Compare your KPIs with industry standards or previous years to gauge real improvement.
7. Automate Where Possible
Use Excel formulas and pivot charts to automate calculations and improve efficiency.
By following these best practices, your environmental scorecard will remain accurate, actionable, and impactful.
Real-World Applications of the Environmental KPI Scorecard
Organizations across various sectors use this tool for sustainability management:
- Manufacturing: Track energy, water, and waste metrics for production efficiency.
- Hospitality: Monitor carbon footprint per guest and water consumption per stay.
- Retail: Measure packaging waste and renewable energy usage.
- Education: Assess campus sustainability initiatives like recycling programs.
- Corporate Offices: Monitor energy efficiency and paper usage reduction campaigns.
This versatility makes it one of the most practical tools for eco-conscious organizations.
How the Scorecard Improves Sustainability Strategy
Using the Environmental KPI Scorecard in Excel helps you:
- Identify inefficiencies in energy and water usage.
- Track improvements in recycling and resource conservation.
- Evaluate progress against sustainability targets.
- Support reporting for ESG (Environmental, Social, and Governance) disclosures.
- Promote transparency in sustainability performance.
With every data update, your organization moves one step closer to achieving a greener footprint.
Conclusion
The Environmental KPI Scorecard in Excel is an essential tool for organizations committed to sustainability and continuous improvement.
It consolidates environmental performance data, tracks progress against targets, and simplifies reporting — all in a user-friendly format.
By using this scorecard regularly, you not only comply with environmental standards but also strengthen your organization’s commitment to a sustainable future.
Remember: what gets measured, gets improved. Start tracking your environmental KPIs today and make measurable progress toward a cleaner, greener tomorrow. 🌿
Frequently Asked Questions (FAQs)
- What is the main purpose of an Environmental KPI Scorecard?
It helps organizations measure, track, and visualize their environmental performance, ensuring alignment with sustainability goals.
- Can I customize the KPIs in the scorecard?
Yes. You can easily edit the KPI Definition sheet to add, remove, or modify KPIs based on your organization’s needs.
- How often should I update the scorecard?
You should update it monthly or quarterly, depending on how frequently your organization collects environmental data.
- Do I need advanced Excel skills to use this scorecard?
Not at all. The template is designed for ease of use with dropdowns, automated charts, and built-in calculations.
- Can this scorecard be used for ESG reporting?
Yes. The Environmental KPI Scorecard provides valuable data inputs for the Environmental pillar of ESG reporting.
- What industries benefit most from this scorecard?
Any organization with sustainability goals — including manufacturing, education, retail, or services — can benefit from it.
- Is it possible to track both MTD and YTD performance?
Absolutely. The dashboard allows you to switch between MTD and YTD metrics with a simple dropdown selection.
Visit our YouTube channel to learn step-by-step video tutorials
Watch the step-by-step video tutorial:
Click to buy Environmental KPI Scorecard in Excel