ERP consulting firms operate in a fast-moving and highly competitive environment. Projects demand precision. Clients expect timely delivery. Meanwhile, leadership teams must control revenue, margins, utilization, and quality at the same time. Therefore, you need a powerful reporting system that gives you instant clarity.
The ERP Consulting KPI Dashboard in Power BI delivers exactly that.
This ready-to-use dashboard transforms structured Excel data into dynamic, interactive, and intelligent visuals. As a result, ERP consulting leaders can track performance in real time, compare trends, and make confident decisions.
Let us explore everything step by step.
Click to Purchases ERP Consulting KPI Dashboard in Power BI
What Is an ERP Consulting KPI Dashboard in Power BI?
An ERP Consulting KPI Dashboard in Power BI is an interactive business intelligence solution designed to monitor key performance indicators across ERP consulting operations.
Instead of relying on static Excel reports, you can:
-
Monitor MTD (Month-to-Date) performance
-
Analyze YTD (Year-to-Date) progress
-
Compare Current Year vs Previous Year
-
Track Target vs Actual achievement
-
Drill through to KPI definitions
-
Visualize trends instantly
Because the dashboard runs inside Power BI, it provides dynamic filtering, slicers, and interactive charts. Consequently, you gain full visibility into your consulting performance.
Why Do ERP Consulting Firms Need a KPI Dashboard in Power BI?
ERP consulting projects involve complex timelines, multiple stakeholders, and strict budgets. However, many firms still use disconnected spreadsheets. As a result, leaders often react late.
Without structured KPIs:
-
Utilization drops
-
Profit margins shrink
-
Deadlines slip
-
Client satisfaction declines
On the other hand, when you implement a KPI Dashboard in Power BI:
-
You identify problems early.
-
You improve resource allocation.
-
You align teams with targets.
-
You strengthen profitability.
Therefore, a Power BI dashboard becomes essential for sustainable growth.
Click to Purchases ERP Consulting KPI Dashboard in Power BI
Key Features of ERP Consulting KPI Dashboard in Power BI
This ready-to-use dashboard includes 3 structured pages inside the Power BI Desktop file. Each page serves a clear purpose.
Let us break them down.
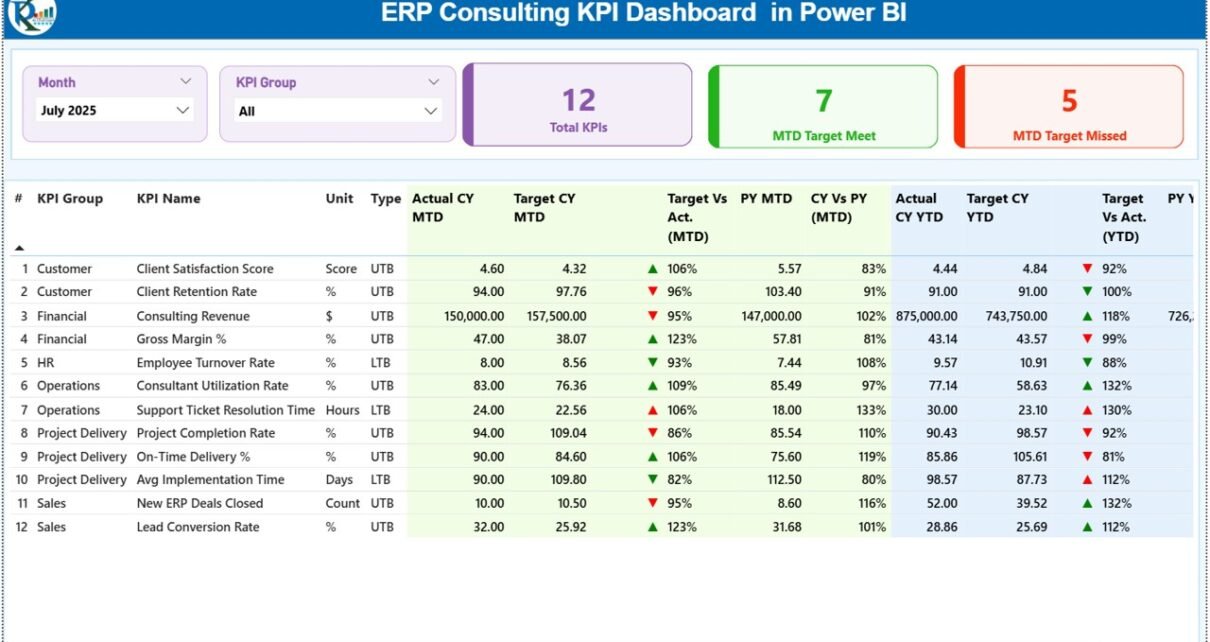
1️⃣ Summary Page – The Executive Control Center
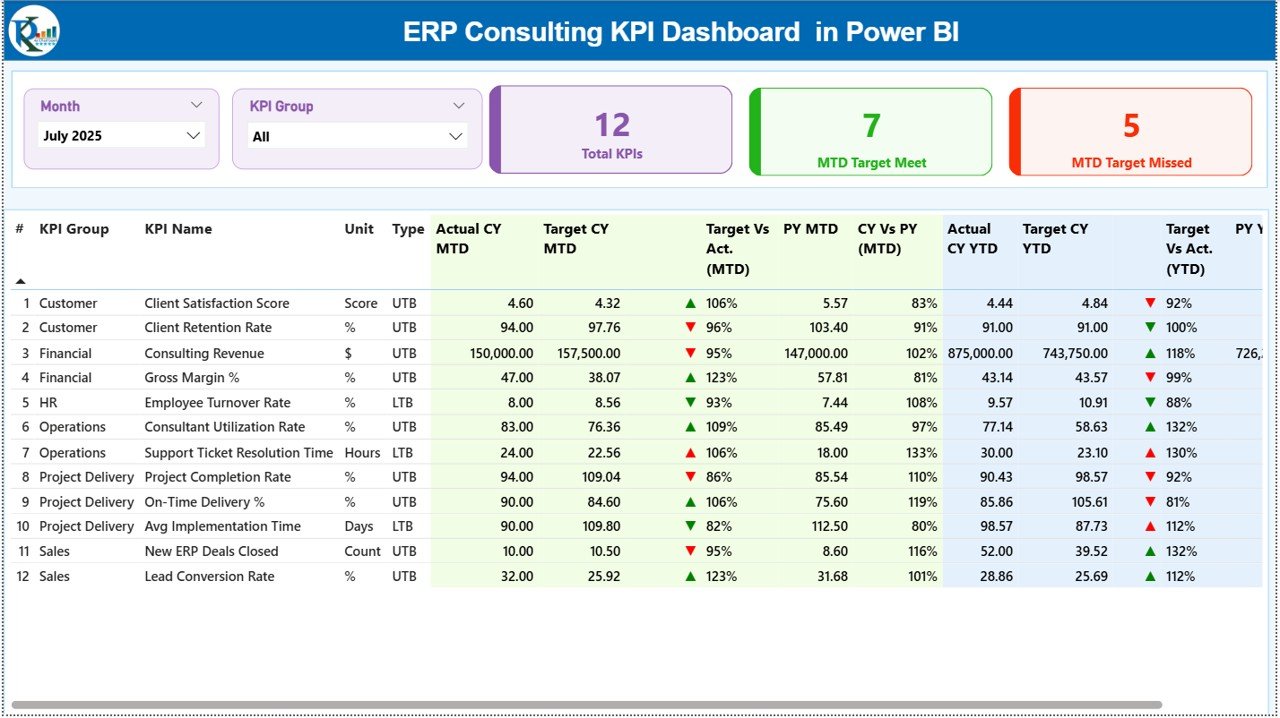
The Summary Page acts as the main performance overview.
What Do You See on the Top?
At the top of the page, you will find:
-
Month slicer
-
KPI Group slicer
Because of these slicers, you can filter performance instantly by month or KPI category.
What KPI Cards Are Displayed?
Three key summary cards provide quick insights:
-
Total KPIs Count
-
MTD Target Meet Count
-
MTD Target Missed Count
Therefore, within seconds, you understand how many KPIs perform well and how many require attention.
What Does the Detailed KPI Table Show?
Below the cards, a structured KPI table displays complete performance data.
KPI Information Included:
-
KPI Number
-
KPI Group
-
KPI Name
-
Unit
-
Type (LTB or UTB)
MTD Section Includes:
-
Actual CY MTD
-
Target CY MTD
-
MTD Icon (▲ green / ▼ red)
-
Target vs Actual % (MTD)
-
PY MTD
-
CY vs PY % (MTD)
YTD Section Includes:
-
Actual CY YTD
-
Target CY YTD
-
YTD Icon (▲ green / ▼ red)
-
Target vs Actual % (YTD)
-
PY YTD
-
CY vs PY % (YTD)
Because this layout combines all comparisons in one view, managers can analyze performance quickly.
How Does the MTD and YTD Icon System Help?
The dashboard uses:
-
▲ Green Arrow for strong performance
-
▼ Red Arrow for underperformance
The system compares:
-
Actual vs Target
-
Current Year vs Previous Year
As a result, leaders instantly recognize trends without reading complex numbers.
Click to Purchases ERP Consulting KPI Dashboard in Power BI
2️⃣ KPI Trend Page – Detailed Performance Analysis
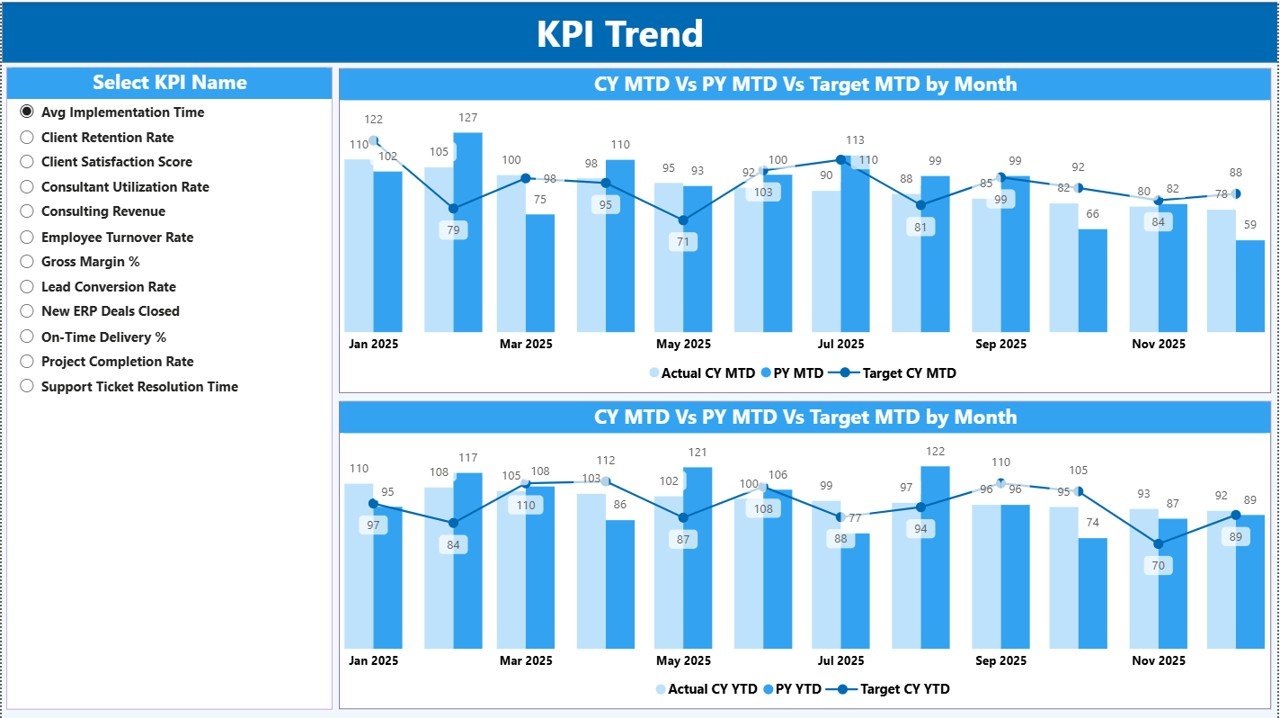
The KPI Trend Page allows deep analysis for each KPI.
How Do You Use It?
On the left side, you can select a KPI from the slicer. Once selected, the dashboard updates automatically.
What Charts Are Available?
The page includes:
-
Combo chart for MTD comparison
-
Combo chart for YTD comparison
Each chart shows:
-
Current Year Actual
-
Previous Year Actual
-
Target Values
Because the charts display side-by-side comparisons, you can easily spot growth patterns and seasonal changes.
3️⃣ KPI Definition Page – Drill Through Intelligence
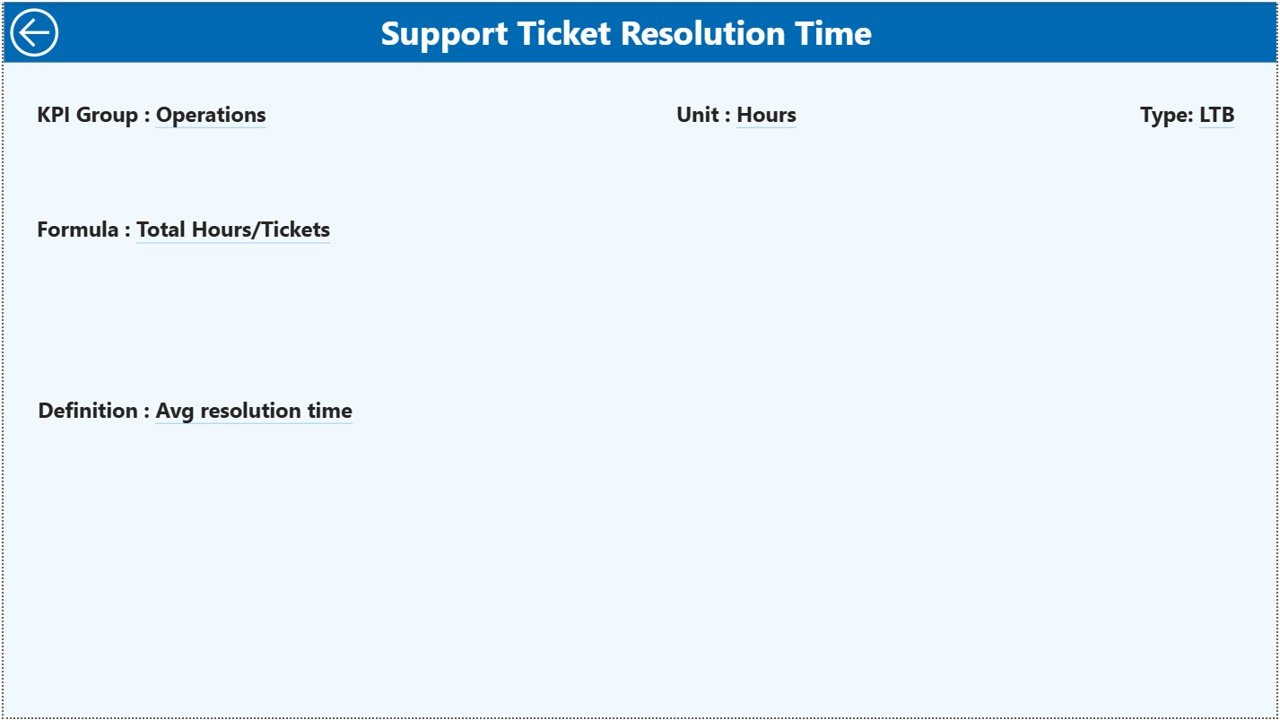
The KPI Definition Page works as a drill-through page. The dashboard keeps it hidden by default.
How Does It Work?
From the Summary Page, you can drill through a specific KPI. Once you drill through, you can see:
-
KPI Formula
-
KPI Definition
-
KPI Group
-
KPI Type (LTB or UTB)
To return, simply click the back button on the top-left corner.
Therefore, leadership teams can understand both the numbers and the logic behind each KPI.
Click to Purchases ERP Consulting KPI Dashboard in Power BI
What Data Source Does the Dashboard Use?
The ERP Consulting KPI Dashboard in Power BI connects to an Excel file as its data source.
You must fill three worksheets:
1️⃣ Input_Actual Sheet
In this sheet, enter:
-
KPI Name
-
Month (first date of the month)
-
MTD Number
-
YTD Number
Because the dashboard connects directly to this data, Power BI updates automatically after refresh.
2️⃣ Input_Target Sheet
In this sheet, enter:
-
KPI Name
-
Month
-
MTD Target
-
YTD Target
Clear targets create measurable accountability.
3️⃣ KPI Definition Sheet
In this sheet, enter:
-
KPI Number
-
KPI Group
-
KPI Name
-
Unit
-
Formula
-
Definition
-
Type (LTB or UTB)
Since this sheet drives drill-through functionality, it ensures consistency.
What KPIs Should ERP Consulting Firms Track?
You can customize KPIs based on your business model. However, most ERP consulting firms track the following:
Financial KPIs
-
Revenue per Consultant
-
Gross Margin %
-
Billing Rate
-
Project Profitability
-
Cost Variance %
Operational KPIs
-
Utilization Rate %
-
On-Time Project Delivery %
-
Billable Hours Ratio
-
Implementation Cycle Time
Client KPIs
-
Client Satisfaction Score
-
Repeat Business %
-
Escalation Rate
Quality KPIs
-
Post-Go-Live Defects
-
Issue Resolution Time
-
System Stability Rate
Because Power BI allows flexible grouping, you can organize KPIs under financial, operational, client, or quality categories.
Click to Purchases ERP Consulting KPI Dashboard in Power BI
How Does This Dashboard Improve ERP Consulting Performance?
The ERP Consulting KPI Dashboard in Power BI enhances performance in multiple ways.
1️⃣ Real-Time Insights
As soon as you refresh data, all visuals update. Therefore, you always analyze the latest numbers.
2️⃣ Clear Target Tracking
The Target vs Actual percentage highlights performance gaps instantly.
3️⃣ Historical Comparison
Current Year vs Previous Year comparison helps measure growth.
4️⃣ Visual Intelligence
Charts communicate trends faster than raw tables.
5️⃣ Data-Driven Culture
When teams see measurable KPIs, they focus on results.
Advantages of ERP Consulting KPI Dashboard in Power BI
Let us explore the major advantages.
🚀 Centralized Reporting
You track all ERP consulting KPIs in one dashboard.
🚀 Interactive Filtering
Slicers allow instant filtering by month and KPI group.
🚀 Drill-Through Capability
You explore detailed KPI definitions with one click.
🚀 Automated Calculations
Power BI calculates percentages and comparisons automatically.
🚀 Strong Visualization
Combo charts simplify complex comparisons.
🚀 Scalability
You can expand the dashboard as your consulting firm grows.
Why Choose Power BI Over Manual Excel Reporting?
While Excel works well, Power BI offers advanced capabilities.
-
Interactive visuals
-
Advanced filtering
-
Drill-through navigation
-
Strong data modeling
-
Professional presentation
Therefore, Power BI suits growing ERP consulting firms that require deeper analytics.
Click to Purchases ERP Consulting KPI Dashboard in Power BI
Best Practices for the ERP Consulting KPI Dashboard in Power BI
To maximize benefits, follow these best practices.
✅ Define Clear KPIs
Align KPIs with strategic business goals.
✅ Keep Data Clean
Maintain consistent formatting in Excel input sheets.
✅ Update Data Regularly
Refresh dashboard monthly for accurate reporting.
✅ Review Performance in Meetings
Discuss KPI results with leadership teams.
✅ Focus on Actionable Insights
Do not just review numbers. Take corrective actions.
✅ Limit KPI Count
Track 10–20 high-impact KPIs instead of tracking everything.
How Does This Dashboard Increase Profitability?
Profitability improves when:
-
Utilization increases
-
Billing accuracy improves
-
Cost overruns decrease
-
Projects deliver on time
The dashboard highlights underperforming KPIs immediately. Therefore, managers can intervene quickly.
Who Should Use This ERP Consulting KPI Dashboard?
This dashboard benefits:
-
ERP Consulting Firm Owners
-
Project Managers
-
Delivery Heads
-
Finance Managers
-
Operations Leaders
-
Strategy Teams
Because it combines financial and operational KPIs, it supports strategic decisions.
Click to Purchases ERP Consulting KPI Dashboard in Power BI
Conclusion: Should You Implement ERP Consulting KPI Dashboard in Power BI?
If you want better visibility, faster decisions, and stronger profitability, then yes — you should implement this dashboard.
It offers:
-
Complete KPI tracking
-
Target vs Actual comparison
-
Current vs Previous Year analysis
-
Trend visualization
-
Drill-through intelligence
-
Structured Excel data integration
Most importantly, it helps you move from reactive management to proactive leadership.
Therefore, if you aim to scale your ERP consulting business, this Power BI KPI Dashboard provides a smart and powerful foundation.
Frequently Asked Questions (FAQs)
1️⃣ What is an ERP Consulting KPI Dashboard in Power BI?
It is an interactive Power BI solution that tracks ERP consulting performance metrics such as revenue, utilization, and profitability.
2️⃣ Can I customize KPIs in this dashboard?
Yes. You can modify KPI definitions and input data through the connected Excel file.
3️⃣ Does the dashboard support MTD and YTD analysis?
Yes. It tracks both MTD and YTD values with Target and Previous Year comparison.
4️⃣ What does LTB and UTB mean?
LTB means Lower the Better. UTB means Upper the Better.
5️⃣ Can I drill through KPI details?
Yes. You can drill through to see KPI formula and definition on the hidden KPI Definition page.
6️⃣ Is Power BI better than Excel for KPI tracking?
Power BI provides stronger visualization and interactivity, especially for growing consulting firms.
7️⃣ How often should I update the dashboard?
You should update it monthly or as frequently as your reporting cycle requires.
Click to Purchases ERP Consulting KPI Dashboard in Power BI
Visit our YouTube channel to learn step-by-step video tutorials