Managing facilities effectively requires a structured approach to requests, maintenance, and reporting. Without a clear view of ongoing issues, pending tasks, and department-level analysis, organizations often face delays, inefficiencies, and higher costs. This is where a Facilities Management Dashboard in Excel comes in.
In this article, we will explore everything you need to know about this dashboard, its structure, features, advantages, best practices, and how it can transform the way facilities are managed. By the end, you’ll also find answers to the most frequently asked questions.
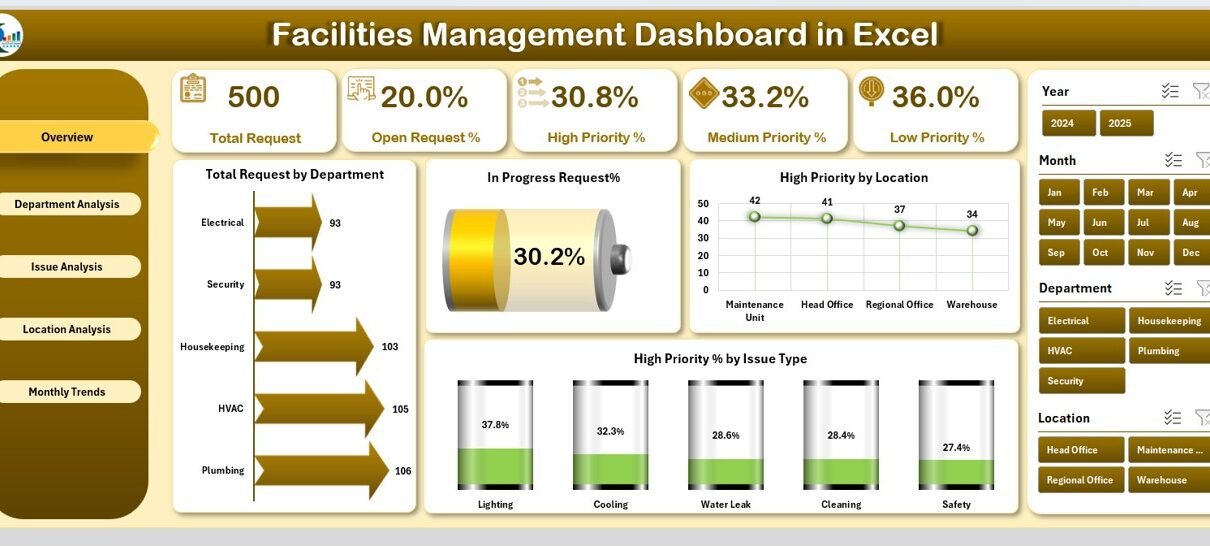
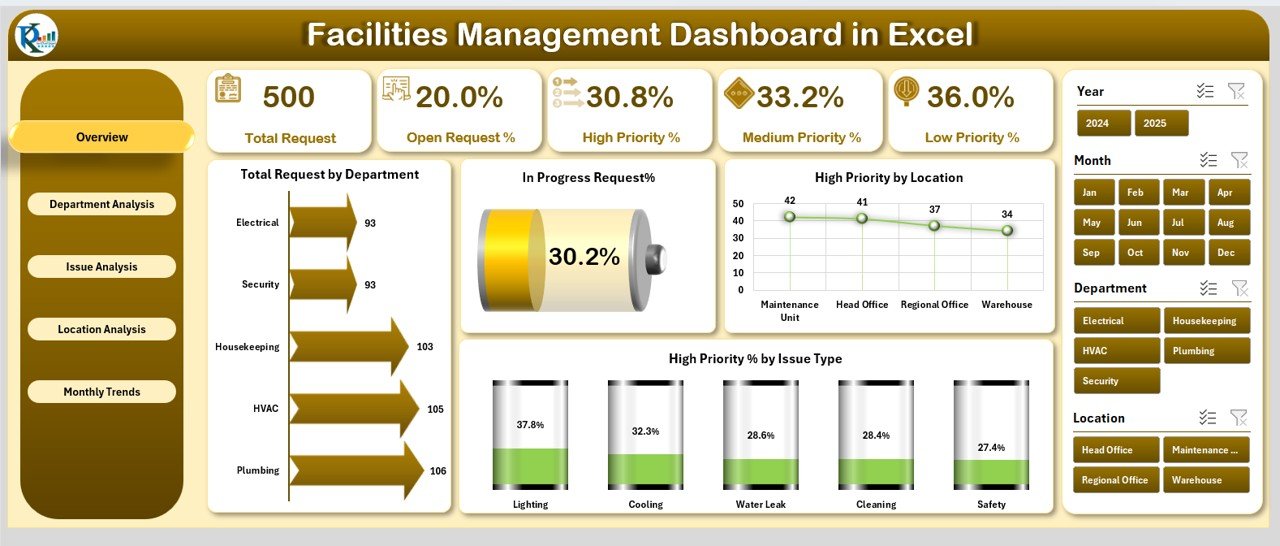
Facilities Management Dashboard in Excel
What Is a Facilities Management Dashboard in Excel?
A Facilities Management Dashboard is a centralized digital tool built in Microsoft Excel. It helps track, analyze, and report all facility-related data such as maintenance requests, issue types, department performance, and location trends.
Instead of handling scattered spreadsheets or manual reports, this dashboard brings all data into one interactive and user-friendly interface. With cards, charts, slicers, and navigation buttons, it enables facility managers to make informed decisions quickly.
Key Features of the Facilities Management Dashboard
This ready-to-use Excel dashboard includes five analytical pages along with a support sheet. Each page focuses on a different dimension of facility management. Let’s break it down:
Overview Page
-
Purpose: Acts as the central summary of all activities.
Components:
5 cards displaying key metrics.
4 charts:
- Provides a quick snapshot of the overall facility performance.
Department Analysis Page
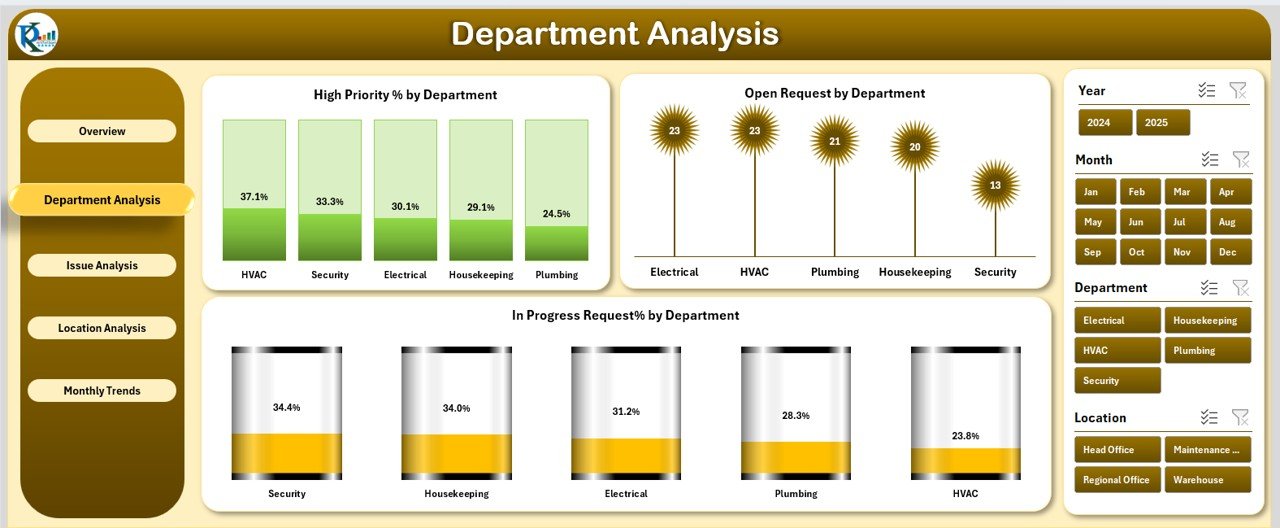
Purpose: Shows how different departments handle requests.
Charts Included:
- High Priority % by Department
- Open Requests by Department
- In-Progress Requests % by Department
-
Benefit: Helps identify overloaded departments and track efficiency levels.
Issue Analysis Page
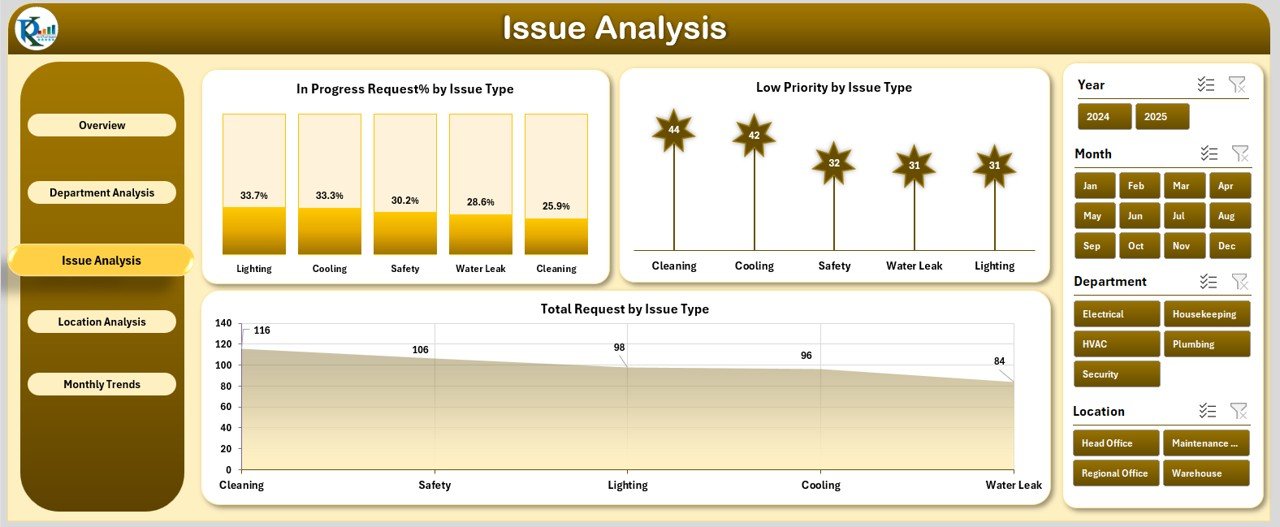
Purpose: Focuses on categorizing and analyzing issues.
Charts Included:
- In-Progress Requests % by Issue Type
- Low Priority Requests by Issue Type
- Total Requests by Issue Type
-
Benefit: Highlights the most recurring issue categories for better planning.
Location Analysis Page
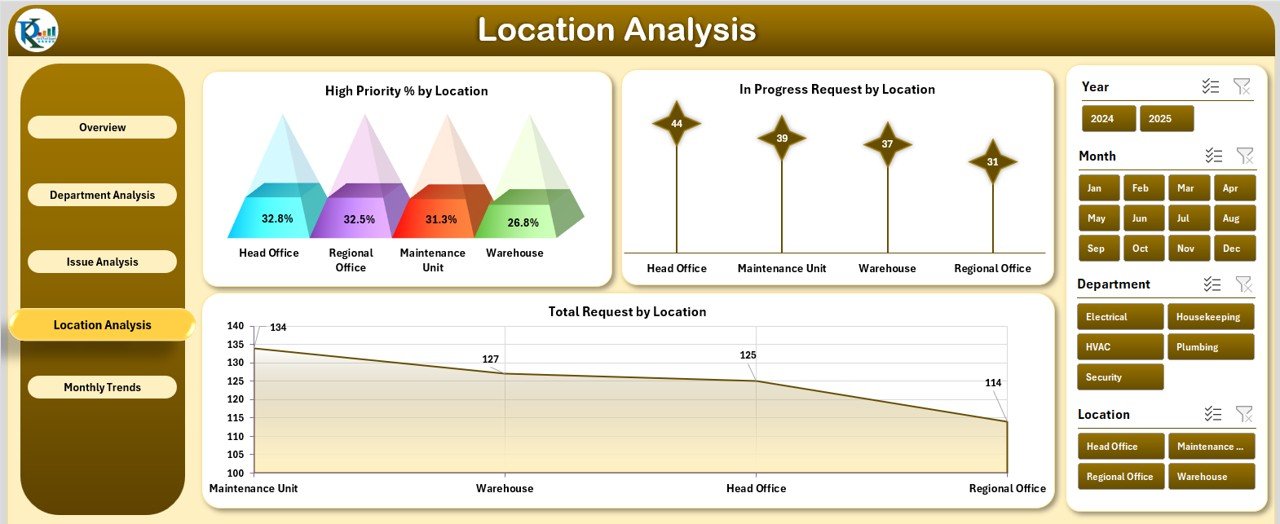
Purpose: Tracks requests and priorities by location.
Charts Included:
- High Priority % by Location
- In-Progress Requests by Location
- Total Requests by Location
-
Benefit: Identifies problem hotspots across different facilities or branches.
Facilities Management Dashboard in Excel
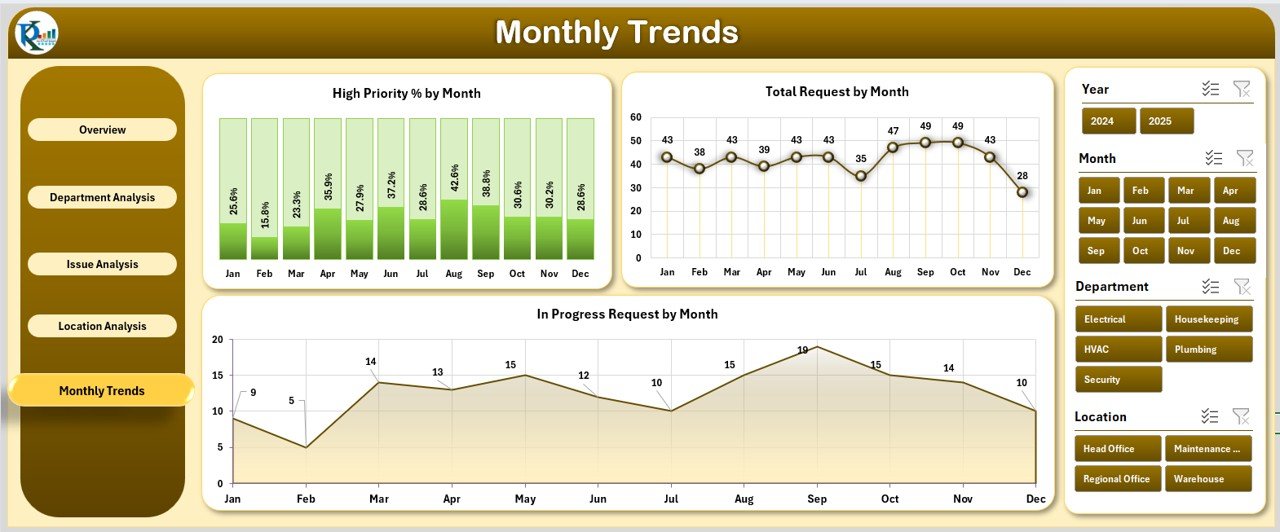
Monthly Trends Page
-
Purpose: Displays the performance of requests over time.
Charts Included:
- High Priority % by Month
- Total Requests by Month
- In-Progress Requests by Month
-
Benefit: Detects seasonal patterns and long-term performance trends.
Support Sheet
-
Works as a backend for storing raw data.
-
Enables easy updates without disrupting the dashboard’s design.
Why Use Excel for Facilities Management?
Many wonder why Excel is still relevant for dashboards when there are modern tools like Power BI or Tableau. Here’s why Excel works well:
-
Accessibility: Almost every organization has Excel.
-
Ease of Use: No need for advanced coding or technical skills.
-
Customization: Dashboards can be tailored to business-specific needs.
-
Integration: Can import/export data from ERP or maintenance software.
-
Cost-Effective: No additional licensing cost required.
Advantages of Facilities Management Dashboard in Excel
Using this dashboard provides numerous benefits for facility managers and organizations:
✅ Centralized Insights – All requests and performance metrics in one place.
✅ Improved Efficiency – Quickly track in-progress and pending requests.
✅ Better Prioritization – Identify high-priority issues instantly.
✅ Department-Level Accountability – Spot departments with backlogs.
✅ Data-Driven Decisions – Use trends and location analysis for smarter planning.
✅ Cost Savings – Reduce delays and downtime by addressing issues faster.
✅ Scalability – Can be easily modified as operations expand.
How to Use the Facilities Management Dashboard
Using this dashboard is simple, even for beginners. Here’s a step-by-step guide:
-
Input Data in Support Sheet
-
Record requests, departments, issue types, locations, and statuses.
-
Ensure dates and categories are consistent for accurate charts.
-
-
Navigate Through Pages
-
Use the Page Navigator on the left side to switch between Overview, Department, Issue, Location, and Monthly Trends.
-
-
Analyze Metrics
-
Review KPI cards for overall performance.
-
Drill down into department or location-specific data.
-
-
Take Action
-
Identify bottlenecks (e.g., departments with high open requests).
-
Reallocate resources where necessary.
-
Best Practices for Facilities Management Dashboard
To get the most out of your dashboard, follow these best practices:
-
Keep Data Updated: Refresh the support sheet regularly.
-
Use Standardized Categories: Avoid duplicate or inconsistent issue types.
-
Review Monthly Trends: Detect recurring issues before they escalate.
-
Focus on High Priority: Address critical issues first.
-
Engage Departments: Share dashboard insights with responsible teams.
-
Automate Data Entry: If possible, link the sheet to online request forms.
-
Train Staff: Ensure employees know how to log issues correctly.
Opportunities for Improvement in Facilities Management
Even with dashboards, organizations can always improve their facilities management process. Some areas to focus on include:
📌 Automation of Requests – Linking the dashboard to online forms or ticketing systems.
📌 Mobile Access – Making dashboards mobile-friendly for on-site staff.
📌 Predictive Analytics – Using historical data to predict equipment failures.
📌 Integration with IoT Devices – Collecting data directly from sensors.
📌 Employee Feedback Loops – Including satisfaction metrics for completed requests.
How This Dashboard Transforms Facility Operations
By implementing this Excel dashboard, organizations experience:
-
Faster turnaround times on maintenance and repair requests.
-
Transparent communication across departments.
-
Stronger accountability since requests are visible in real time.
-
Data-backed budgeting by analyzing request frequency and issue types.
This transformation not only saves time but also enhances workplace safety, comfort, and efficiency.
Conclusion
A Facilities Management Dashboard in Excel provides organizations with a powerful yet simple tool to manage their facilities effectively. With its five analytical pages, slicers, and support sheet, it consolidates data into one place, allowing managers to track requests, identify high-priority issues, and analyze trends.
By following best practices, updating data consistently, and focusing on continuous improvement, organizations can turn facilities management into a proactive, cost-saving, and efficiency-boosting process.
Frequently Asked Questions (FAQs)
1. What is a Facilities Management Dashboard?
It is a centralized tool in Excel that helps track, monitor, and analyze facility-related requests, priorities, and performance metrics.
2. Who can use this dashboard?
Facility managers, operations teams, HR departments, and any organization that handles maintenance and workplace requests.
3. Can this dashboard handle large data?
Yes. Excel can efficiently manage thousands of records, though for very large datasets, integration with Power BI may be useful.
4. Is this dashboard customizable?
Absolutely. You can add new charts, KPIs, or departments as per organizational needs.
5. How often should the dashboard be updated?
Ideally, update it daily or weekly depending on the volume of facility requests.
6. Can non-technical users operate this dashboard?
Yes. It is designed with slicers, buttons, and charts for easy navigation and interpretation.
7. What kind of insights can I gain from this dashboard?
You can track high-priority issues, department efficiency, recurring problems, and trends over time.
Visit our YouTube channel to learn step-by-step video tutorials