In today’s fast-moving business environment, facilities play a critical role in productivity, safety, and operational efficiency. Offices, factories, hospitals, campuses, malls, and commercial buildings generate massive amounts of operational data every day. However, raw data alone does not help decision-makers. You must convert that data into clear, actionable insights.
That is exactly where a Facilities Management KPI Dashboard in Excel becomes a powerful solution.
In this detailed guide, you will learn what a Facilities Management KPI Dashboard in Excel is, why it matters, how it works, its complete sheet-wise structure, advantages, best practices, and frequently asked questions. Moreover, this article uses simple language, clear explanations, and real-world logic so you can apply everything immediately.
Click to buy Facilities Management KPI Dashboard in Excel
What Is a Facilities Management KPI Dashboard in Excel?
A Facilities Management KPI Dashboard in Excel is a centralized reporting and monitoring tool that tracks key performance indicators related to building operations, maintenance, utilities, safety, and service quality.
Instead of checking multiple reports, emails, or software tools, this dashboard brings all critical KPIs into one interactive Excel file. As a result, facility managers gain instant visibility into performance trends, efficiency gaps, and improvement areas.
Moreover, Excel dashboards offer flexibility, ease of use, and cost-effectiveness. Therefore, many organizations prefer Excel-based dashboards for facilities management reporting.
Why Do Facilities Management Teams Need a KPI Dashboard?
Facilities management involves many moving parts. Maintenance costs, energy usage, asset downtime, vendor performance, and safety compliance all require continuous tracking. Without a structured dashboard, teams struggle with delays, errors, and missed insights.
A Facilities Management KPI Dashboard in Excel solves these challenges by providing:
- Clear performance visibility
- Faster decision-making
- Consistent KPI tracking
- Month-to-date and year-to-date analysis
- Target vs actual comparisons
As a result, organizations improve efficiency while reducing operational risks.
What Problems Does a Facilities Management KPI Dashboard Solve?
Facilities teams face recurring issues every day. However, a well-designed KPI dashboard addresses them directly.
Common Challenges Without a Dashboard
- Scattered data across multiple sheets
- Manual reporting errors
- No clear KPI ownership
- Delayed performance reviews
- Poor trend visibility
How the Dashboard Helps
- Centralizes all KPI data
- Automates calculations
- Highlights performance gaps visually
- Tracks trends month by month
- Improves accountability
Therefore, teams move from reactive management to proactive planning.
What KPIs Are Tracked in a Facilities Management Dashboard?
Facilities KPIs vary by industry and building type. However, most dashboards include KPIs across maintenance, energy, safety, and service quality.
Common Facilities Management KPI Groups
- Maintenance Performance
- Energy & Utilities
- Asset Management
- Safety & Compliance
- Vendor & Service Quality
Examples include maintenance response time, energy consumption, equipment downtime, safety incident rate, and cost per square foot.
Overview of the Facilities Management KPI Dashboard in Excel
This Facilities Management KPI Dashboard in Excel is a ready-to-use template designed for real-world usage. It uses structured input sheets, automated calculations, and dynamic visuals.
Most importantly, the dashboard follows a clean and logical flow so users can navigate easily.
How Many Worksheets Are Included in the Dashboard?
This dashboard contains 7 well-structured worksheets, each serving a specific purpose.
Let’s explore each sheet in detail.
Summary Page
The Summary Page works as the index sheet of the dashboard.
Key Features of the Summary Page
- Central landing page
- Six navigation buttons
- Quick access to all other sheets
Because of this design, users do not waste time searching for sheets. Instead, they move quickly to the required analysis.

Click to buy Facilities Management KPI Dashboard in Excel
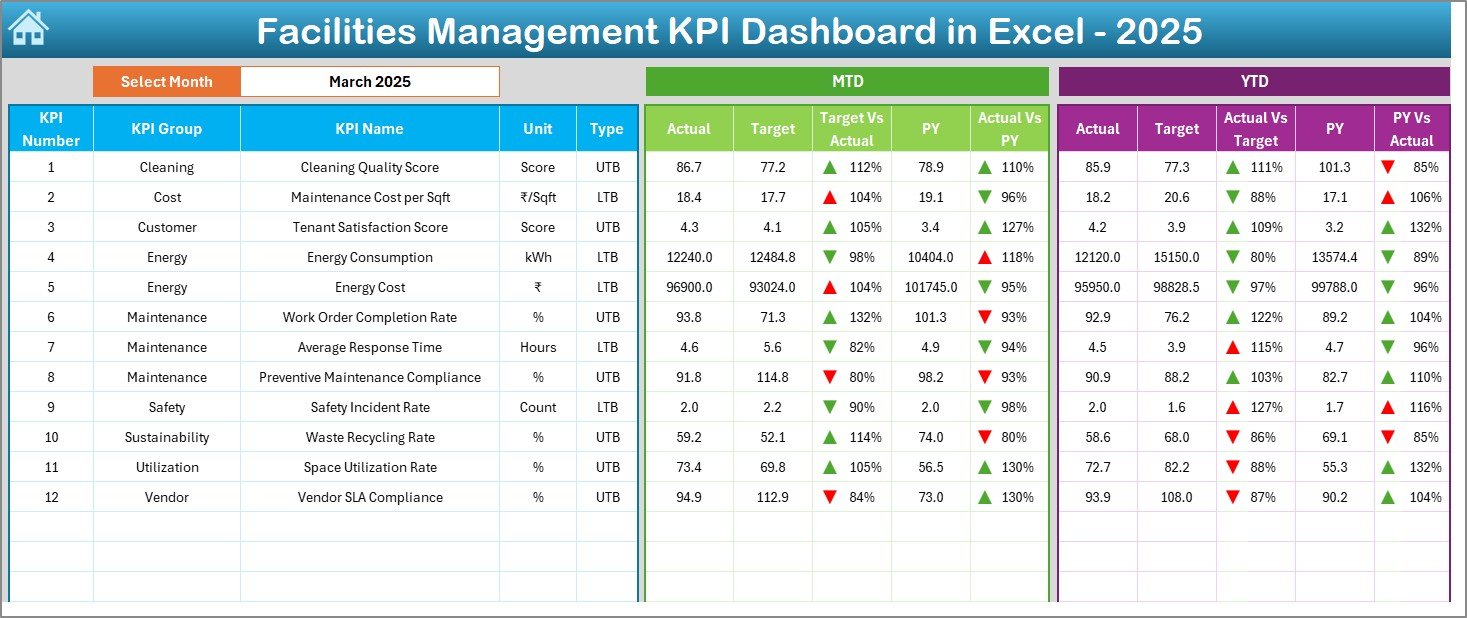
Dashboard Sheet
The Dashboard Sheet is the core of the Facilities Management KPI Dashboard in Excel.
How Does the Dashboard Sheet Work?
- Month selection available in cell D3
- Dynamic KPI calculations based on selected month
- Automatic update of all numbers and charts
KPIs Displayed on the Dashboard Sheet
- MTD Actual values
- MTD Target values
- Previous Year values
- Target vs Actual comparison
- Previous Year vs Actual comparison
Moreover, the dashboard uses conditional formatting with up and down arrows, which instantly highlights performance status.
YTD Analysis on the Dashboard
- YTD Actual
- YTD Target
- YTD Previous Year
- Visual variance indicators
As a result, managers understand both short-term and long-term performance at a glance.
Click to buy Facilities Management KPI Dashboard in Excel
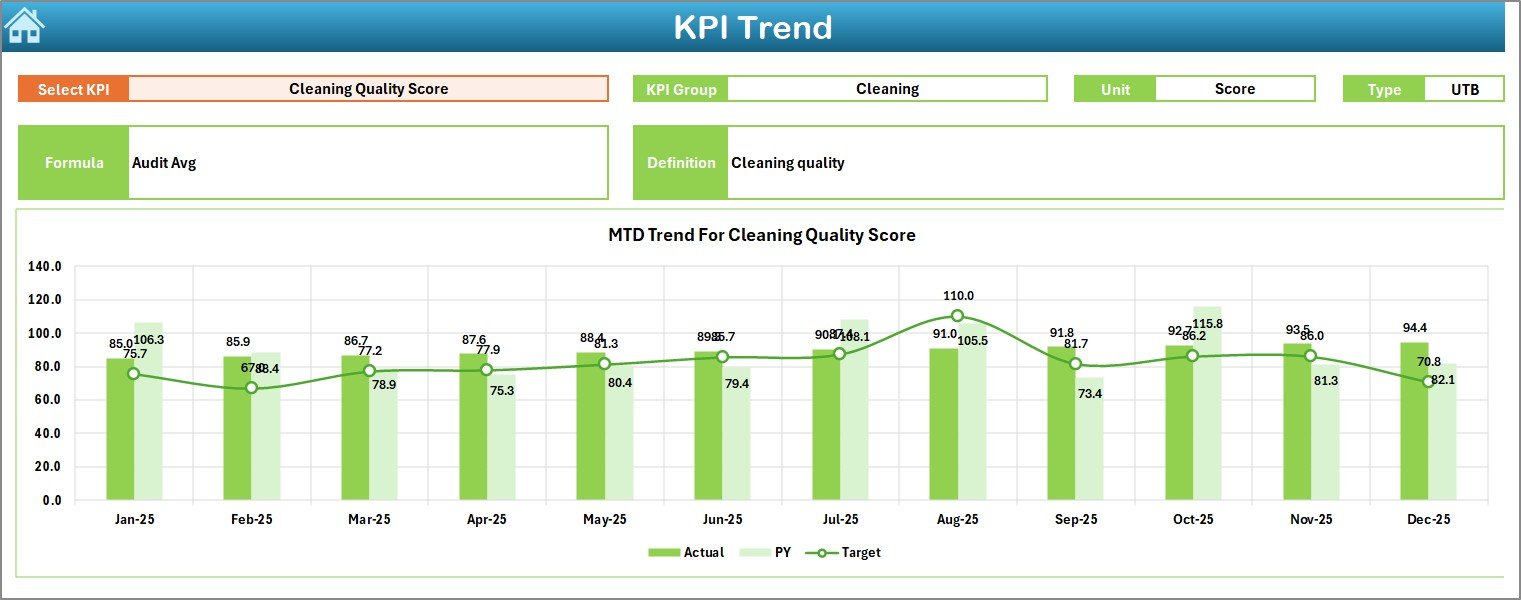
Trend Sheet
The Trend Sheet focuses on individual KPI analysis.
How Does the Trend Sheet Help?
- KPI selection dropdown in cell C3
- Displays KPI Group, Unit, and Type
- Shows KPI Formula and Definition
Charts Available in the Trend Sheet
- MTD trend chart
- YTD trend chart
- Actual vs Target vs Previous Year comparison
Therefore, users analyze how each KPI performs over time rather than relying on static numbers.
Click to buy Facilities Management KPI Dashboard in Excel
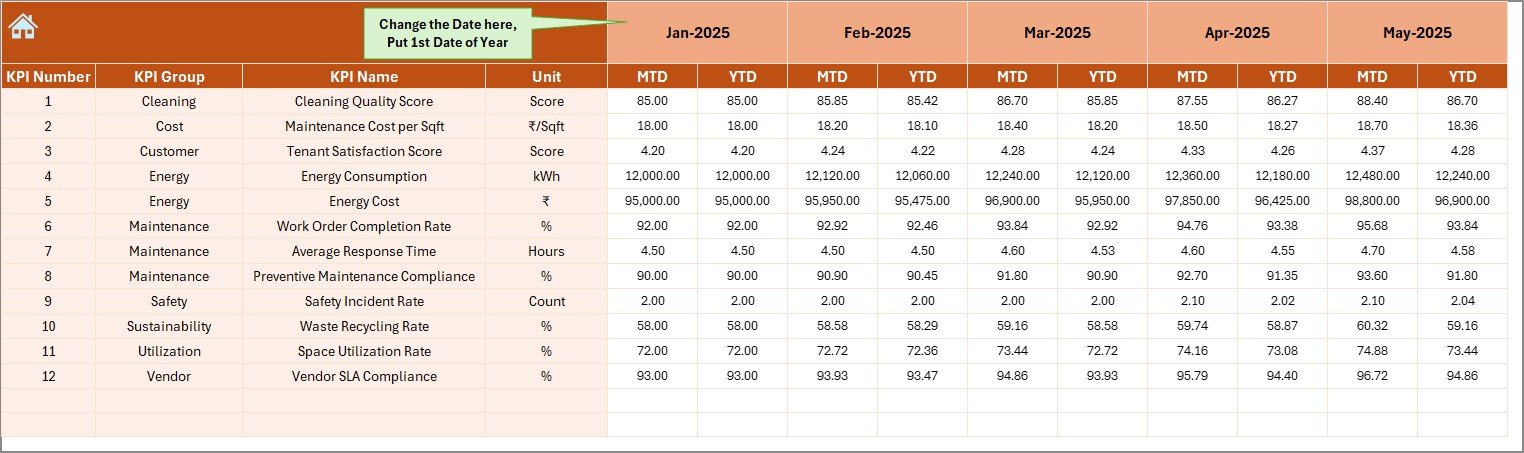
Actual Numbers
The Actual Numbers Input Sheet captures real performance data.
How Do You Use This Sheet?
- Enter actual MTD and YTD values
- Select the month from cell E1
- Input the first month of the year once
This design ensures consistency while reducing data entry errors.
Click to buy Facilities Management KPI Dashboard in Excel
Target Sheet
The Target Sheet defines performance expectations.
Purpose of the Target Sheet
- Enter monthly MTD targets
- Enter YTD targets for each KPI
- Maintain consistent benchmarks
As a result, the dashboard compares actual performance against predefined goals accurately.

Click to buy Facilities Management KPI Dashboard in Excel
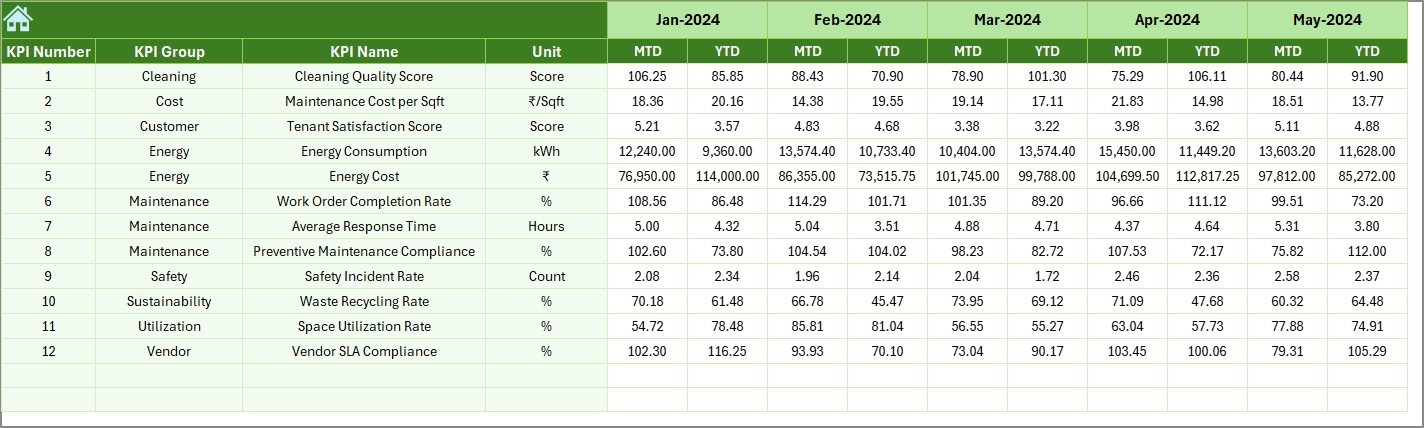
Previous Year Numbers Sheet
The Previous Year Numbers Sheet stores historical data.
Why Is This Sheet Important?
- Enables year-over-year comparison
- Identifies performance improvement or decline
- Supports long-term planning
By using this sheet, teams measure progress instead of guessing outcomes.
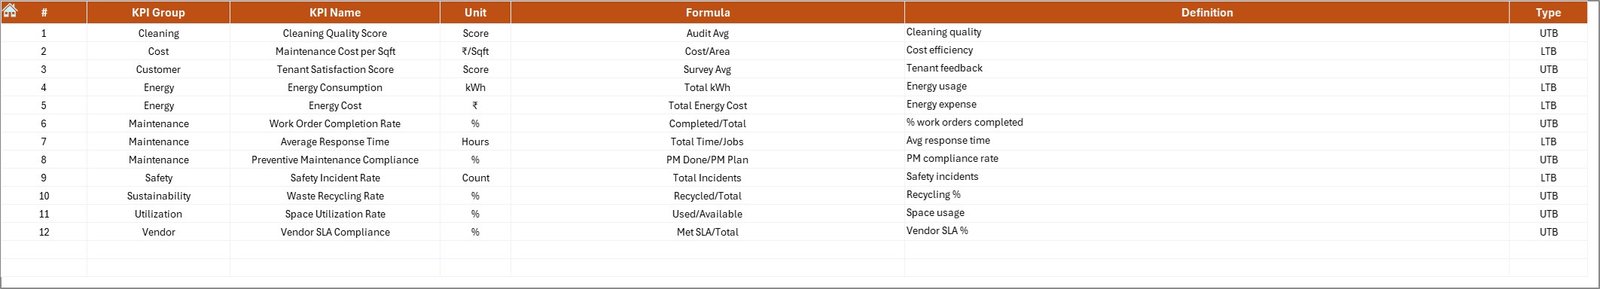
KPI Definition Sheet
The KPI Definition Sheet acts as the foundation of the dashboard.
What Information Does This Sheet Contain?
- KPI Name
- KPI Group
- Unit of measurement
- KPI Formula
- KPI Definition
Because of this structure, all users interpret KPIs consistently.
Click to buy Facilities Management KPI Dashboard in Excel
How Does the Facilities Management KPI Dashboard Improve Decision-Making?
The dashboard transforms raw data into actionable insights.
Key Decision-Making Benefits
- Faster issue identification
- Better resource allocation
- Improved maintenance planning
- Reduced operational risks
Therefore, leaders make confident decisions based on facts, not assumptions.
Advantages of Facilities Management KPI Dashboard in Excel
Using a Facilities Management KPI Dashboard in Excel delivers multiple benefits across teams and organizations.
- Centralized Performance Tracking
All KPIs stay in one place. As a result, teams avoid confusion and duplication.
- Real-Time Performance Visibility
Month selection instantly updates the dashboard. Therefore, managers always see current data.
- Easy to Customize
Excel allows easy KPI additions, formula updates, and layout changes.
- Cost-Effective Solution
Excel dashboards reduce dependency on expensive software tools.
- Improved Accountability
Clear KPI definitions and targets create ownership across teams.
Who Can Use a Facilities Management KPI Dashboard?
This dashboard suits many roles and industries.
Ideal Users Include
- Facility Managers
- Operations Managers
- Maintenance Teams
- Property Managers
- Corporate Admin Teams
Because Excel is widely used, adoption remains simple and fast.
How Does This Dashboard Support Continuous Improvement?
Continuous improvement requires consistent tracking and review.
Dashboard Support for Improvement
- Monthly performance reviews
- Trend-based analysis
- Root cause identification
- Target refinement
As a result, facilities teams improve efficiency month after month.
Best Practices for the Facilities Management KPI Dashboard in Excel
Following best practices ensures maximum value from the dashboard.
- Define Clear KPIs
Always use measurable, relevant, and actionable KPIs.
- Maintain Data Accuracy
Update actual numbers regularly to avoid misleading insights.
- Review KPIs Monthly
Monthly reviews help catch issues early.
- Align KPIs with Business Goals
Ensure facility KPIs support organizational objectives.
- Keep KPI Definitions Updated
Consistent definitions avoid misinterpretation across teams.
How Often Should You Update the Dashboard?
You should update the dashboard at least once a month. However, high-activity facilities may require weekly updates.
Regular updates ensure accurate trend analysis and timely decisions.
Common Mistakes to Avoid While Using Facilities Management Dashboards
Avoiding mistakes improves dashboard reliability.
Common Errors
- Inconsistent data entry
- Undefined KPI ownership
- Ignoring trend analysis
- Overloading dashboards with too many KPIs
Instead, focus on clarity, relevance, and accuracy.
How Can This Dashboard Be Scaled for Large Organizations?
Excel dashboards scale easily with structured design.
Scaling Tips
- Use standardized KPI definitions
- Add department-wise KPI groups
- Protect formula cells
- Use data validation controls
As a result, large organizations maintain consistency across locations.
Conclusion
A Facilities Management KPI Dashboard in Excel is not just a reporting tool. Instead, it acts as a strategic decision-support system.
By using structured worksheets, dynamic month selection, automated calculations, and visual indicators, this dashboard transforms facility data into meaningful insights. Moreover, it improves operational efficiency, reduces costs, and enhances service quality.
When teams follow best practices and update data consistently, this dashboard becomes an essential part of facilities management success.
Frequently Asked Questions (FAQs)
- What is the main purpose of a Facilities Management KPI Dashboard in Excel?
The main purpose is to track, analyze, and visualize facility performance KPIs in one centralized Excel file.
- Can beginners use this Facilities Management KPI Dashboard?
Yes, the dashboard uses simple Excel features, dropdowns, and structured sheets, making it beginner-friendly.
- How many KPIs can this dashboard handle?
The dashboard supports multiple KPIs across different groups. Users can add more KPIs by extending the input and definition sheets.
- Does the dashboard support MTD and YTD analysis?
Yes, the dashboard includes both MTD and YTD actual, target, and previous year analysis.
- Can I customize KPIs and formulas?
Yes, Excel allows full customization of KPIs, formulas, units, and targets.
- How often should data be updated?
You should update the dashboard monthly or more frequently based on operational needs.
- Is this dashboard suitable for different industries?
Yes, the structure supports offices, hospitals, campuses, factories, and commercial buildings.
Visit our YouTube channel to learn step-by-step video tutorials
Watch the step-by-step video tutorial:
Click to buy Facilities Management KPI Dashboard in Excel