Managing facility services efficiently requires accurate tracking, performance measurement, and quick decision-making. Facilities teams often handle multiple tasks such as maintenance, cleaning, energy management, safety, and employee services. Without proper monitoring, it becomes difficult to ensure cost control, smooth operations, and high service quality.
This is where a Facility Services KPI Dashboard in Excel comes in. It acts as a centralized tool that allows facility managers to monitor key performance indicators (KPIs), compare performance against targets, and track trends over time. Unlike complex software, this Excel-based dashboard is easy to use, customizable, and cost-effective.
In this article, we will explore the structure, features, benefits, best practices, and practical applications of a Facility Services KPI Dashboard in Excel. By the end, you will have a clear understanding of how this tool can transform your facility management process.
Click to Purchases Facility Services KPI Dashboard in Excel
What Is a Facility Services KPI Dashboard in Excel?
A Facility Services KPI Dashboard in Excel is a ready-to-use performance monitoring tool designed to track and analyze facility management activities. It brings together data related to operational efficiency, cost, safety, and employee satisfaction into one place.
Instead of juggling multiple spreadsheets or relying on manual reports, managers can visualize insights through charts, KPI cards, and comparison metrics. The dashboard helps track:
-
Maintenance efficiency
-
Energy consumption trends
-
Safety compliance
-
Budget vs. actual expenses
-
Facility utilization rates
-
Service response times
By simplifying complex data into easy-to-read visuals, the dashboard supports evidence-based decisions and promotes better resource allocation.
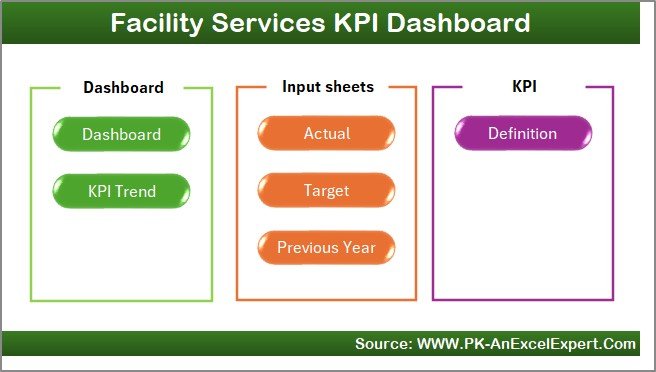
Key Features of the Facility Services KPI Dashboard in Excel
The dashboard is structured into 7 worksheet tabs, each serving a unique purpose.
1. Home Sheet
-
Acts as an index page with quick navigation buttons.
-
Users can jump to different worksheets with a single click.
-
Improves user experience by reducing time spent searching for data.
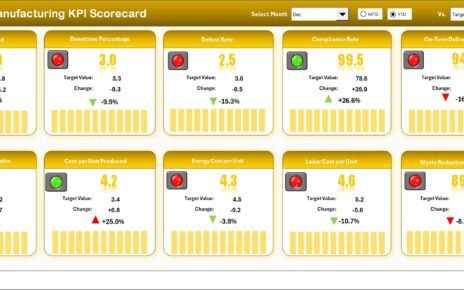
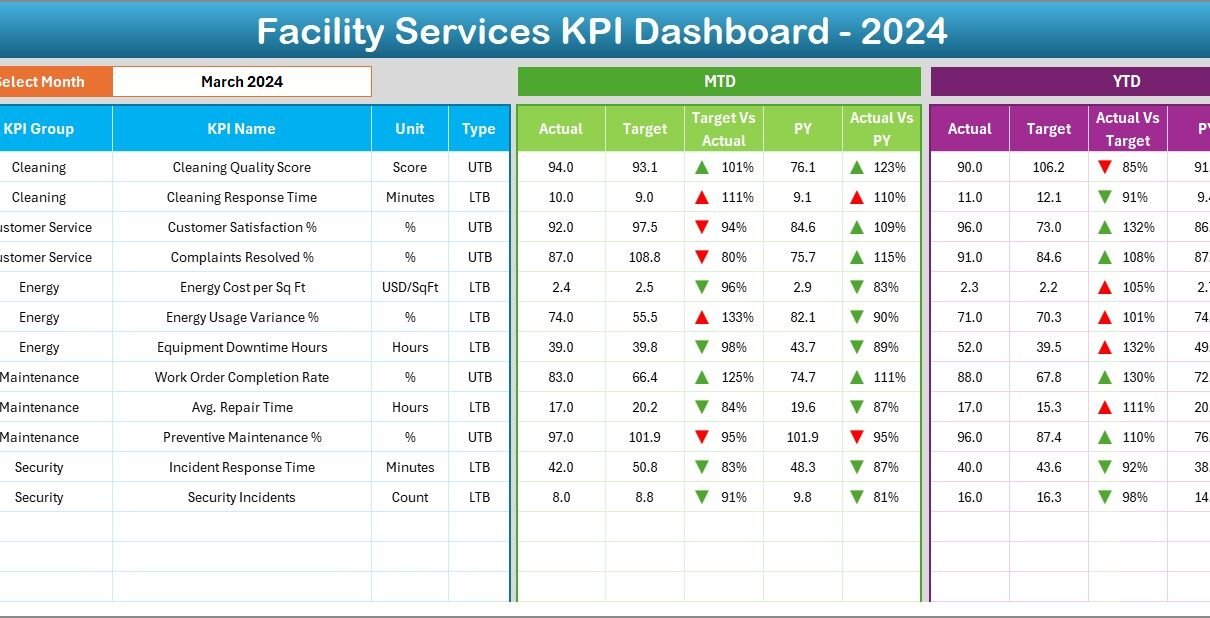
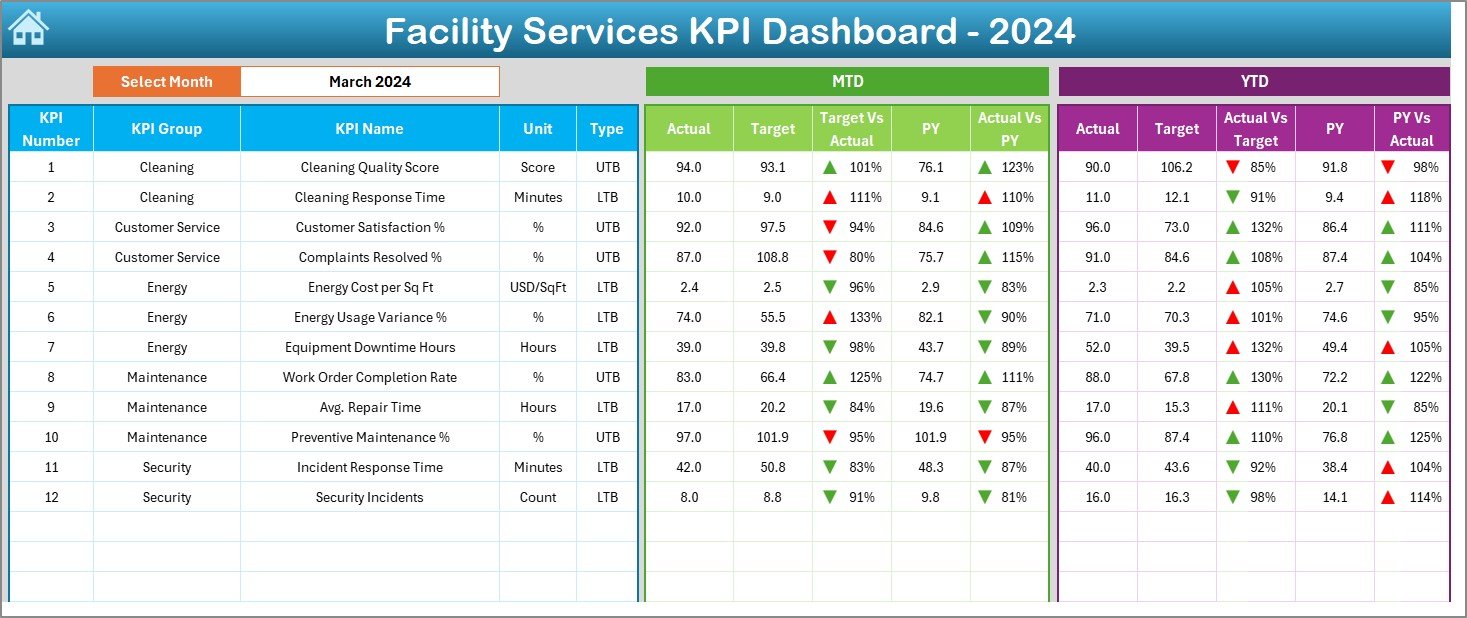
2. Dashboard Sheet
-
The main visual interface showing KPIs and charts.
-
Users can select a specific month from a drop-down (cell D3).
-
Displays Month-to-Date (MTD) and Year-to-Date (YTD) values.
-
Comparison available for:
-
Actual vs. Target
-
Actual vs. Previous Year
-
-
Conditional formatting with up/down arrows highlights performance trends.
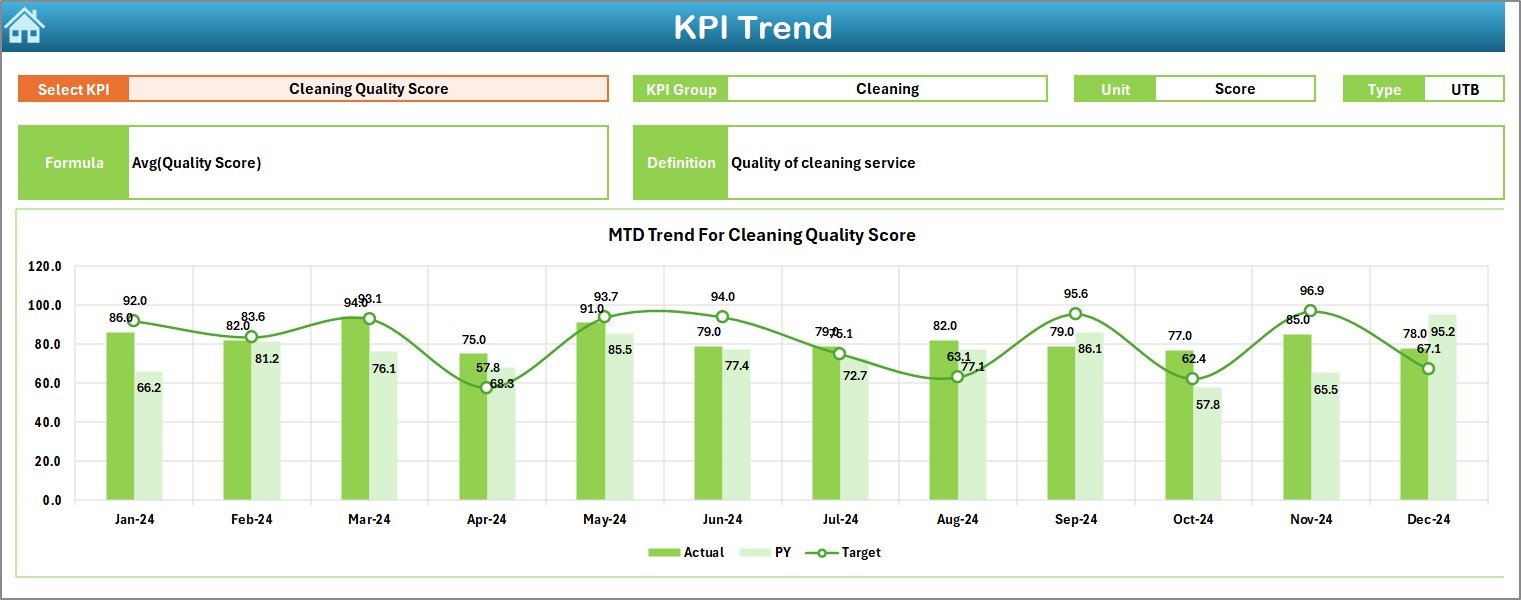
3. KPI Trend Sheet
-
Allows selection of KPI from a drop-down (cell C3).
-
Shows detailed MTD and YTD performance trends.
-
Includes Actual, Target, and Previous Year comparisons.
-
Displays KPI metadata such as:
-
KPI Group
-
Unit
-
Formula
-
Definition
-
Type (Lower the Better / Upper the Better)
-
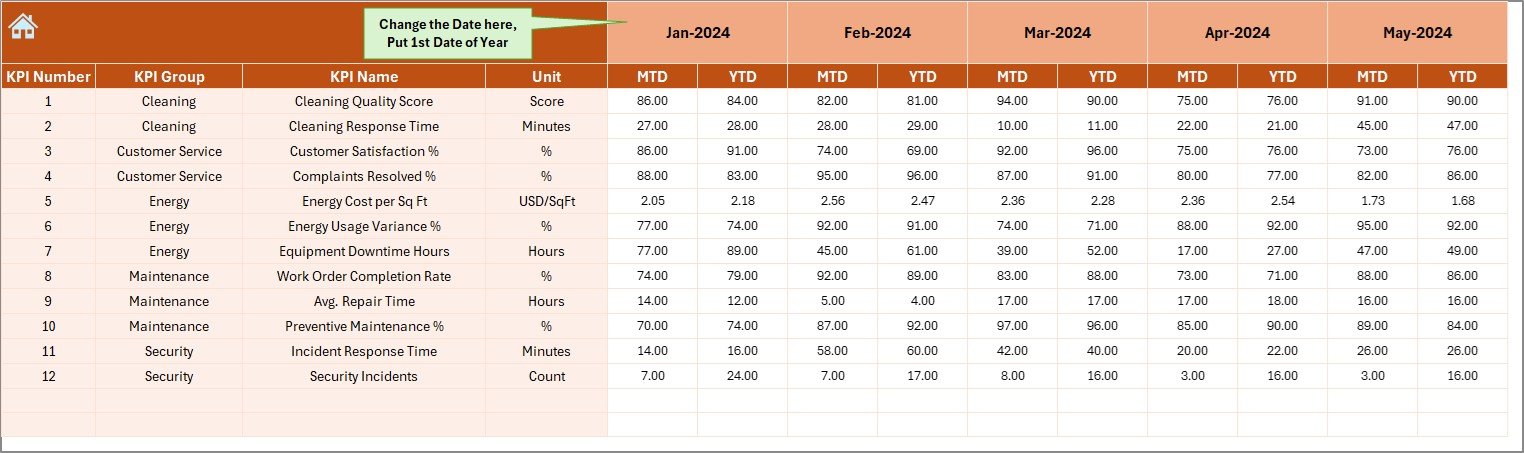
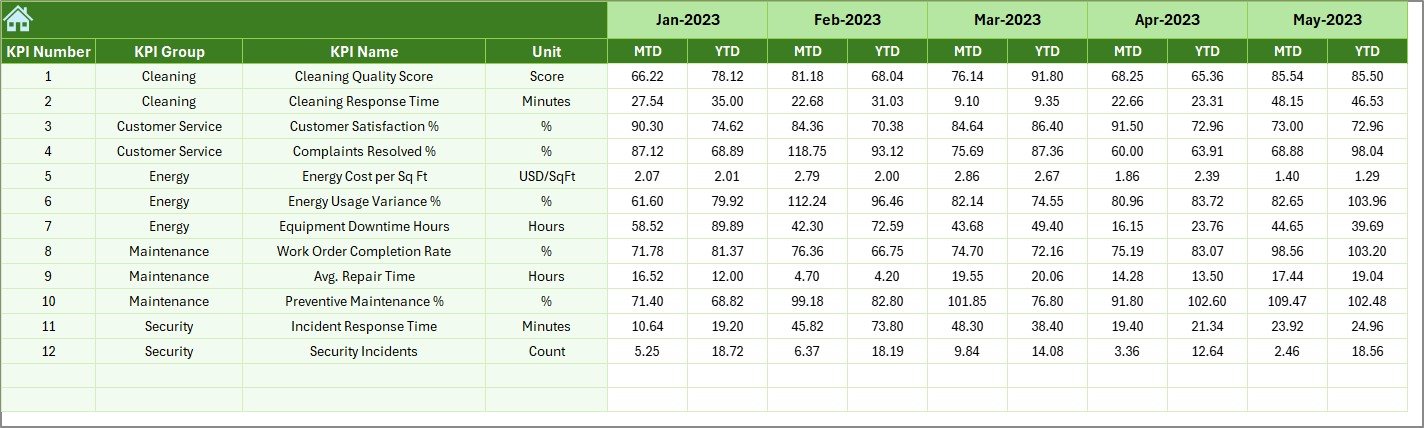
4. Actual Numbers Input Sheet
-
Data entry sheet for monthly Actual values.
-
Flexible starting month (cell E1) makes the tool adaptable for fiscal or calendar years.
5. Target Sheet
-
Stores monthly and yearly target values for each KPI.
-
Targets can be updated at the start of the year or adjusted as needed.
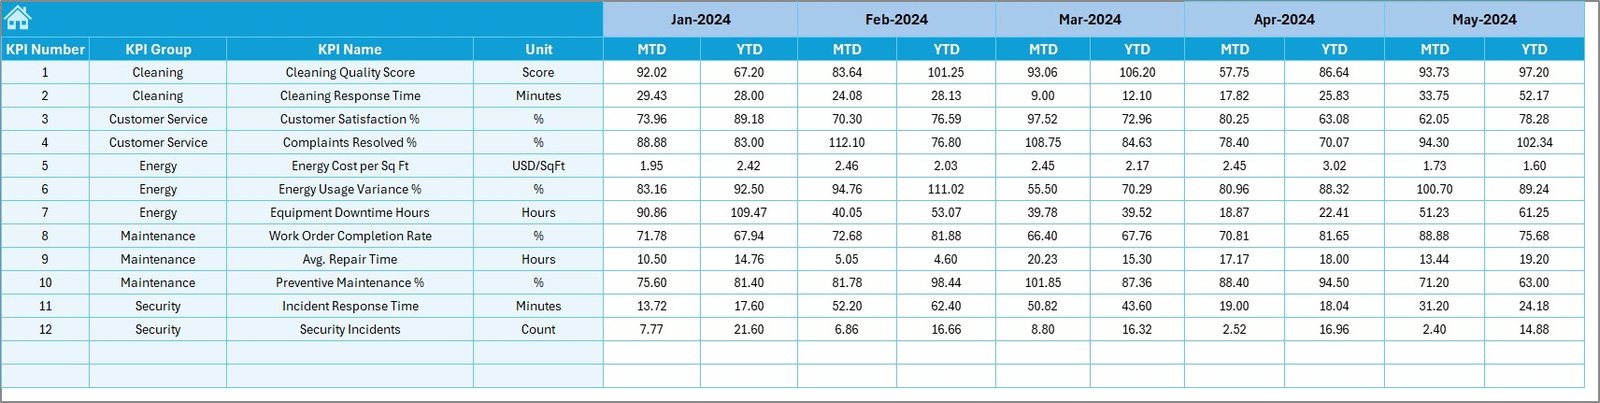
6. Previous Year Numbers Sheet
-
Historical data input for benchmarking performance.
-
Allows comparison with last year’s numbers to identify improvements.
7. KPI Definition Sheet
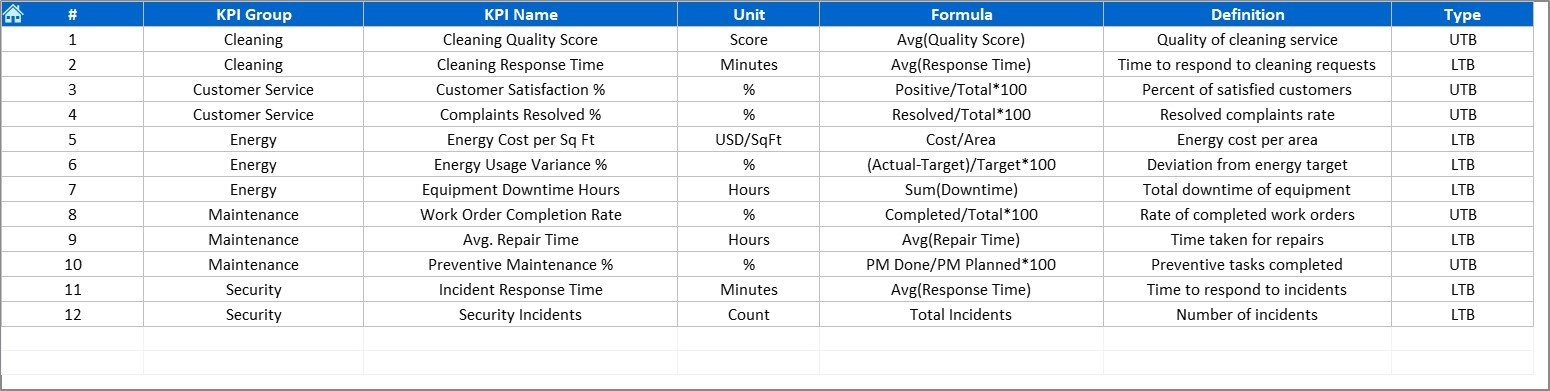
-
Stores complete details of each KPI:
-
Name, Group, Unit
-
Formula
-
Short definition
-
-
Ensures clarity for users across the team.
Why Do You Need a Facility Services KPI Dashboard?
Facility management is not just about fixing problems. It’s about optimizing resources, reducing costs, and maintaining a safe and productive workplace. A KPI dashboard helps you:
-
Measure performance in real-time
-
Identify problem areas before they escalate
-
Allocate resources efficiently
-
Track costs vs. budgets
-
Ensure compliance and safety standards
-
Improve employee satisfaction by maintaining service quality
Advantages of Facility Services KPI Dashboard in Excel
Using Excel for facility KPIs provides several advantages:
✅ Cost-Effective – No need for expensive software. Excel is widely available and accessible.
✅ User-Friendly – Easy to navigate with buttons, drop-downs, and charts.
✅ Customizable – Add, remove, or modify KPIs as per organizational needs.
✅ Data Centralization – All facility data in one file, reducing duplication.
✅ Trend Analysis – Compare MTD, YTD, and historical performance.
✅ Quick Decision Making – Visuals like arrows, graphs, and KPI cards highlight issues instantly.
✅ Collaboration Ready – Can be shared easily across departments.
Click to Purchases Facility Services KPI Dashboard in Excel
How to Use the Facility Services KPI Dashboard in Excel
Using the dashboard involves a few simple steps:
-
Input Actual Data
-
Enter monthly Actual values in the “Actual Numbers” sheet.
-
-
Update Targets
-
Enter monthly and yearly targets in the “Target” sheet.
-
-
Add Historical Data
-
Enter previous year numbers in the “Previous Year” sheet for benchmarking.
-
-
Navigate Easily
-
Use the Home sheet buttons to move between pages.
-
-
Analyze Trends
-
Switch between months or KPIs to view performance visually.
-
-
Review KPI Definitions
-
Use the KPI Definition sheet to understand each KPI.
-
Best Practices for the Facility Services KPI Dashboard
To maximize the benefits of the dashboard, follow these best practices:
-
Select Relevant KPIs – Choose KPIs that align with organizational goals.
-
Update Data Regularly – Keep Actual values updated monthly for accurate insights.
-
Validate Inputs – Ensure correct units and formulas are used.
-
Compare Across Years – Use historical data for long-term analysis.
-
Customize Visuals – Add extra charts for department-specific tracking.
-
Train Users – Provide short training sessions for team members.
-
Review Targets – Adjust targets periodically based on performance.
Opportunities for Improvement in Facility Services Dashboards
Even with a well-designed Excel dashboard, organizations can further improve:
-
Automate data entry using Power Query or VBA.
-
Add real-time integration with facility management software.
-
Create department-wise drill-down dashboards.
-
Implement predictive analytics for maintenance and energy consumption.
-
Enhance visualization with advanced Excel charts.
Practical Applications of Facility Services KPI Dashboard
This dashboard can be used in different areas of facility management:
-
Maintenance Tracking – Monitor planned vs. unplanned maintenance.
-
Energy Management – Track energy usage and identify wastage.
-
Cleaning Services – Ensure hygiene standards with KPI tracking.
-
Safety & Compliance – Track incidents, response times, and audits.
-
Space Utilization – Measure efficiency of workspace usage.
-
Budget Monitoring – Compare expenses vs. allocated budgets.
Conclusion
The Facility Services KPI Dashboard in Excel is a powerful yet simple tool for facility managers. It helps in tracking performance, improving efficiency, reducing costs, and ensuring safety. By using this dashboard, organizations can move from reactive problem-solving to proactive facility management.
With features like KPI trends, Actual vs. Target comparisons, and department analysis, this dashboard enables data-driven decision-making. Whether you are a small business or a large enterprise, this tool can be customized to fit your needs.
Click to Purchases Facility Services KPI Dashboard in Excel
Frequently Asked Questions (FAQs)
1. What is the purpose of a Facility Services KPI Dashboard?
The main purpose is to track and analyze facility management performance through KPIs like cost, maintenance, energy, and safety.
2. Can I customize the KPIs in this dashboard?
Yes, the dashboard is fully customizable. You can add or modify KPIs in the KPI Definition sheet.
3. How often should I update the dashboard?
You should update Actual values monthly to keep MTD and YTD data accurate. Targets can be updated yearly or quarterly.
4. Do I need advanced Excel skills to use it?
No. Basic Excel knowledge is enough. The dashboard has drop-downs, buttons, and pre-set charts.
5. Can small businesses use this dashboard?
Absolutely. It is suitable for small businesses as well as large organizations.
6. What type of charts are included in the dashboard?
It includes trend charts, KPI cards, comparison visuals, and conditional arrows for performance status.
7. Is Excel better than specialized facility management software?
For basic and medium-level tracking, Excel is cost-effective and easy. For large-scale operations, integration with specialized tools may be beneficial.
Click to Purchases Facility Services KPI Dashboard in Excel
Visit our YouTube channel to learn step-by-step video tutorials