Managing finance and accounting performance has become more complex than ever. Every organization needs real-time visibility into revenue, costs, profitability, and efficiency. However, many finance teams still depend on static reports, delayed Excel files, and manual calculations. As a result, decision-making often becomes slow and reactive.
That is exactly why a Finance and Accounting KPI Dashboard in Power BI plays a critical role in modern financial management. This dashboard transforms raw financial data into meaningful insights using interactive visuals, slicers, and KPI indicators. Moreover, it helps finance leaders monitor performance, compare targets, and identify risks at the right time.
In this detailed and SEO-friendly blog post, you will learn what a Finance and Accounting KPI Dashboard in Power BI is, why it is important, how it works, its page-wise structure, key features, advantages, best practices, challenges, and frequently asked questions. The language remains simple, clear, and practical so you can apply it easily.
Click to Purchases Finance and Accounting KPI Dashboard in Power BI
What Is a Finance and Accounting KPI Dashboard in Power BI?
A Finance and Accounting KPI Dashboard in Power BI is a ready-to-use, interactive reporting solution designed to track key financial and accounting KPIs in one centralized place. Instead of reviewing multiple spreadsheets or static reports, users can analyze performance through dynamic charts, KPI cards, and drill-through pages.
This dashboard focuses on both MTD (Month-to-Date) and YTD (Year-to-Date) performance. As a result, finance teams can monitor short-term results while also keeping an eye on long-term financial health.
Most importantly, Power BI enables real-time interactivity. Therefore, users can slice data by month, KPI group, or KPI name and instantly see updated insights.
Why Do Finance and Accounting Teams Need a KPI Dashboard in Power BI?
Finance teams deal with high volumes of data every month. However, raw numbers alone do not support effective decisions. Teams need clarity, trends, and comparisons.
A Finance and Accounting KPI Dashboard in Power BI becomes essential because:
-
It provides a single source of truth for financial KPIs
-
It reduces manual reporting and reconciliation work
-
It improves visibility into MTD and YTD performance
-
It highlights target achievements and misses instantly
-
It supports faster and more confident decisions
As a result, organizations move from static reporting to insight-driven financial management.
How Does a Finance and Accounting KPI Dashboard in Power BI Work?
The working logic of this dashboard remains simple and structured.
First, users capture data in an Excel file. Then, Power BI connects to this Excel file as a data source. After that, Power BI models the data and displays insights through visuals, tables, and KPIs.
Because of this approach, users can update Excel data regularly while Power BI refreshes insights automatically.
Data Source Used in This Dashboard
The data source for this dashboard is an Excel file. This Excel file contains three structured worksheets.
1) Input_Actual Sheet
In this sheet, users enter:
-
KPI Name
-
Month (use the first date of the month)
-
MTD Actual value
-
YTD Actual value
This sheet captures the real performance numbers.
2) Input_Target Sheet
In this sheet, users enter:
-
KPI Name
-
Month (first date of the month)
-
MTD Target value
-
YTD Target value
This sheet defines expected or planned performance.
3) KPI Definition Sheet
This sheet stores master data for KPIs, such as:
-
KPI Number
-
KPI Group
-
KPI Name
-
Unit
-
Formula
-
Definition
-
KPI Type (LTB or UTB)
Because of this structure, KPI logic remains clear and consistent.
Click to Purchases Finance and Accounting KPI Dashboard in Power BI
Overall Structure of the Finance and Accounting KPI Dashboard in Power BI
This ready-to-use dashboard contains 3 well-designed pages in the Power BI Desktop file. Each page serves a specific analytical purpose.
Let us understand each page in detail.
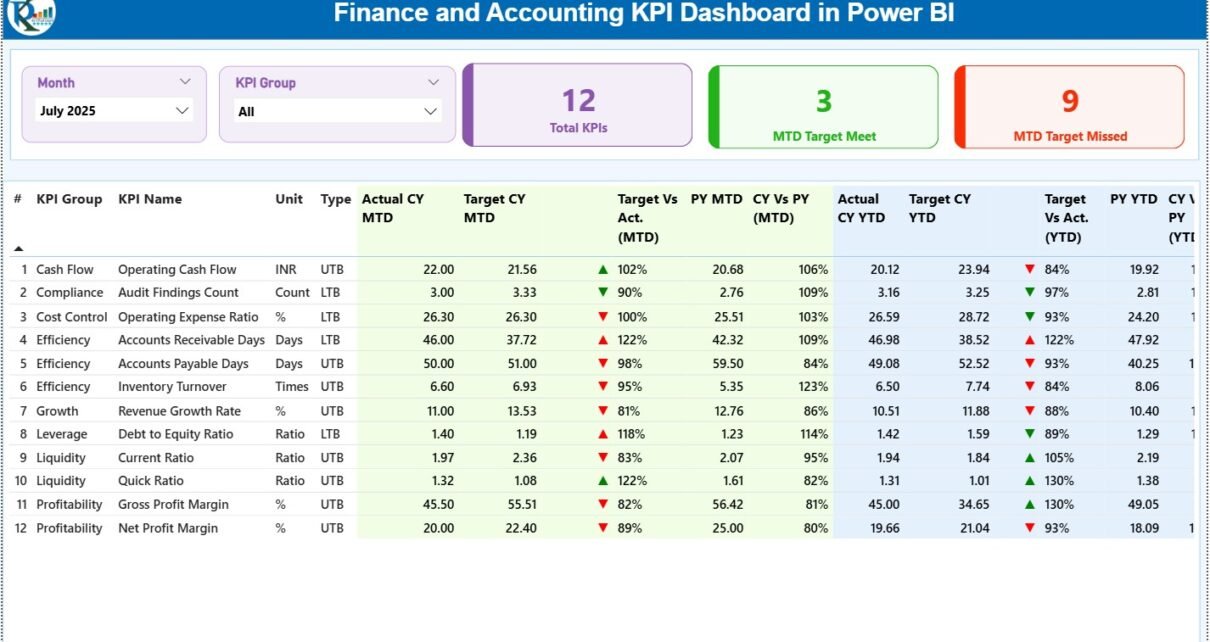
1) Summary Page – The Central Performance View
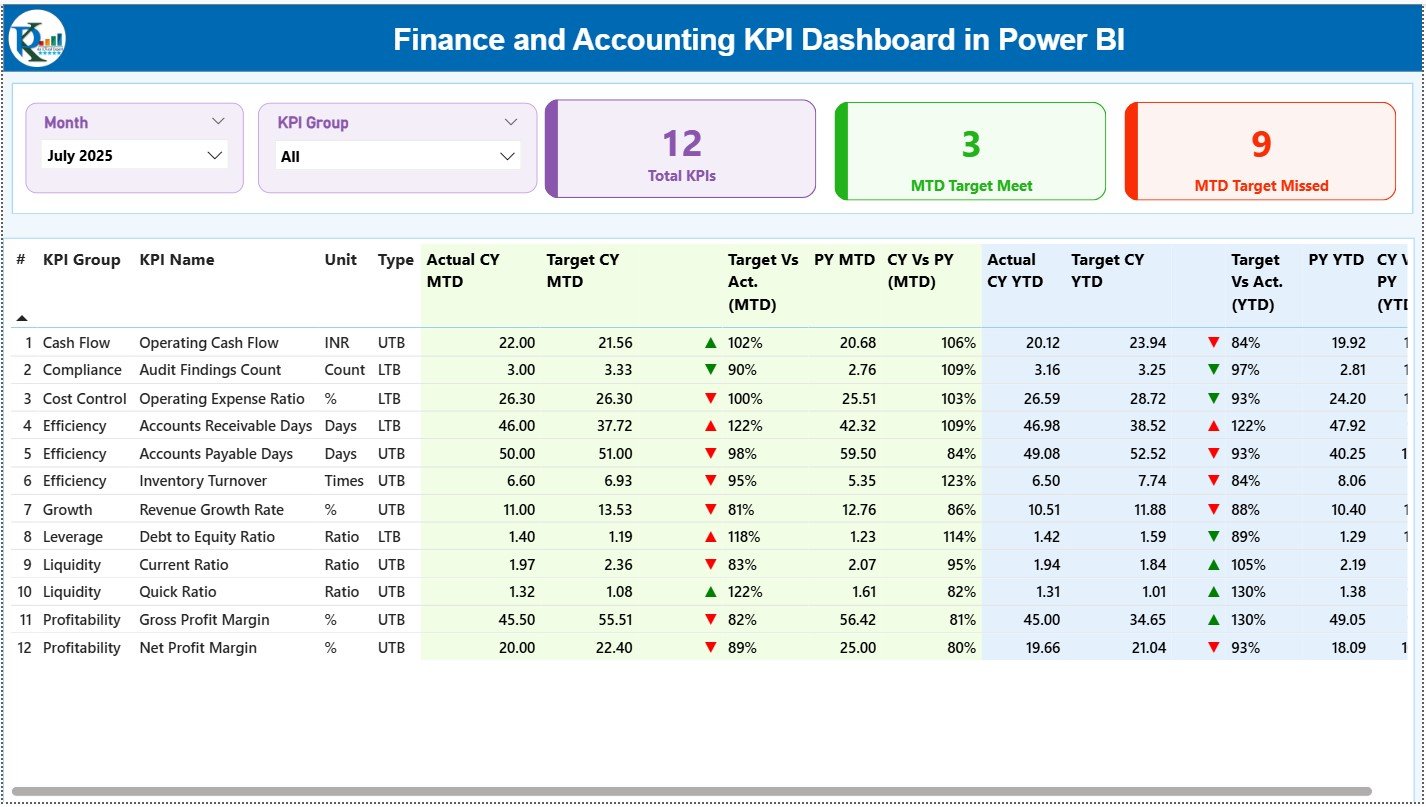
The Summary Page is the main page of the Finance and Accounting KPI Dashboard in Power BI. This page provides a consolidated view of all KPIs.
Slicers on the Summary Page
At the top of the page, you will find:
-
Month slicer
-
KPI Group slicer
These slicers allow users to filter the entire dashboard instantly.
KPI Cards for Quick Insights
The Summary Page includes three KPI cards:
-
Total KPIs Count
-
MTD Target Meet Count
-
MTD Target Missed Count
These cards provide an immediate snapshot of overall performance.
Detailed KPI Table on the Summary Page
Below the cards, the dashboard displays a detailed KPI table. This table shows comprehensive KPI-level information.
The table includes the following columns:
-
KPI Number – Sequence number of the KPI
-
KPI Group – Category or group of the KPI
-
KPI Name – Name of the KPI
-
Unit – Unit of measurement
-
Type – KPI type (LTB or UTB)
MTD Performance Metrics in the Table
For MTD analysis, the table displays:
-
Actual CY MTD – Current year actual MTD value
-
Target CY MTD – Current year target MTD value
-
MTD Icon – ▲ or ▼ icon with green or red color
-
Target vs Actual (MTD) – Percentage comparison (Actual / Target)
-
PY MTD – Previous year MTD value
-
CY vs PY (MTD) – Percentage comparison (CY MTD / PY MTD)
Because of icons and percentages, users can quickly identify KPI status.
YTD Performance Metrics in the Table
For YTD analysis, the table displays:
-
Actual CY YTD – Current year actual YTD value
-
Target CY YTD – Current year target YTD value
-
YTD Icon – ▲ or ▼ icon with green or red color
-
Target vs Actual (YTD) – Percentage comparison (Actual / Target)
-
PY YTD – Previous year YTD value
-
CY vs PY (YTD) – Percentage comparison (CY YTD / PY YTD)
As a result, users can evaluate both short-term and cumulative performance on one page.
Click to Purchases Finance and Accounting KPI Dashboard in Power BI
2) KPI Trend Page – Performance Over Time
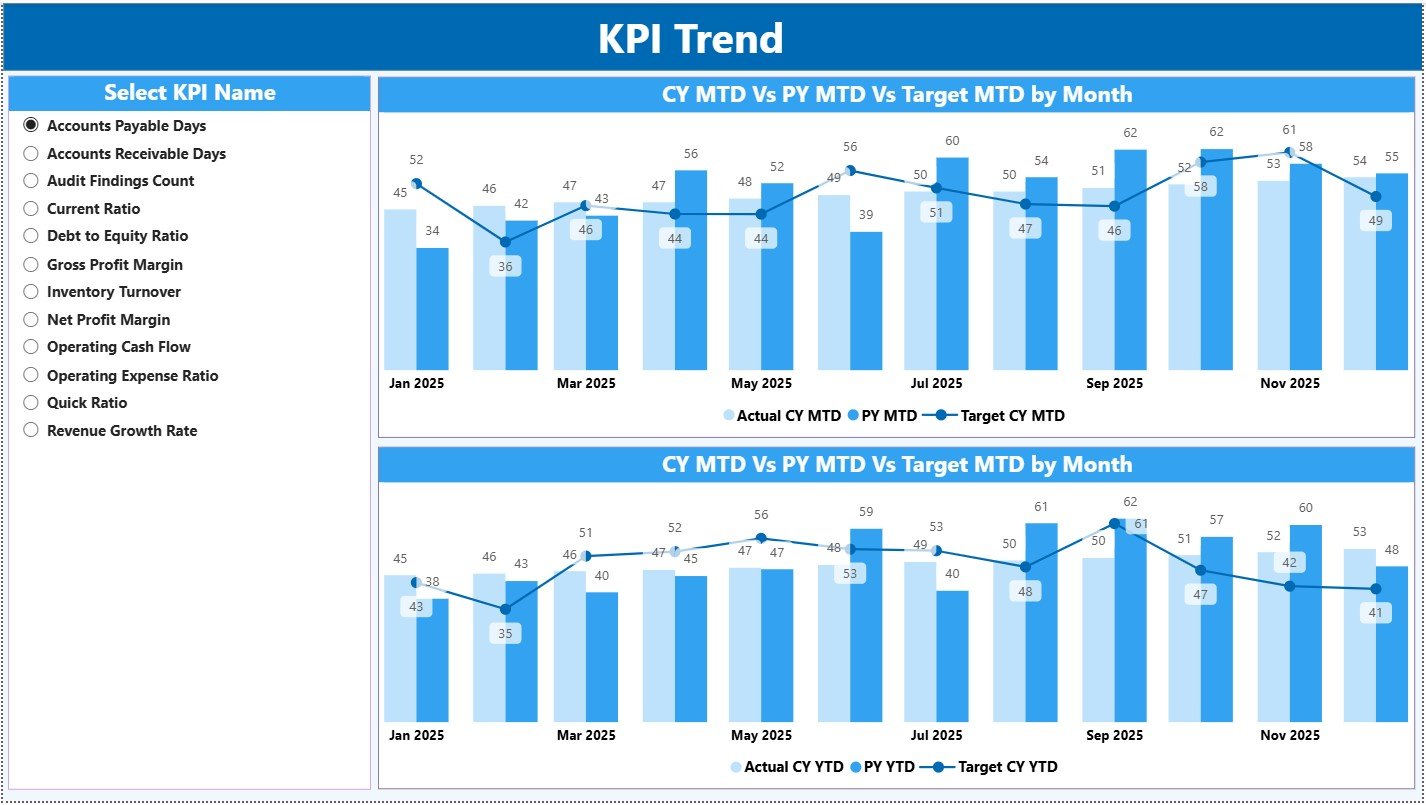
The KPI Trend Page focuses on trend analysis. Instead of viewing all KPIs together, this page allows users to analyze one KPI in depth.
KPI Selection Slicer
On the left side, a slicer allows users to select a KPI Name. Once selected, all visuals update automatically.
Combo Charts on the KPI Trend Page
This page includes two combo charts:
MTD Trend Chart
-
Current Year Actual
-
Previous Year Actual
-
Target
YTD Trend Chart
-
Current Year Actual
-
Previous Year Actual
-
Target
Because of combo charts, users can compare performance lines and target bars clearly.
Click to Purchases Finance and Accounting KPI Dashboard in Power BI
3) KPI Definition Page – KPI Transparency and Governance
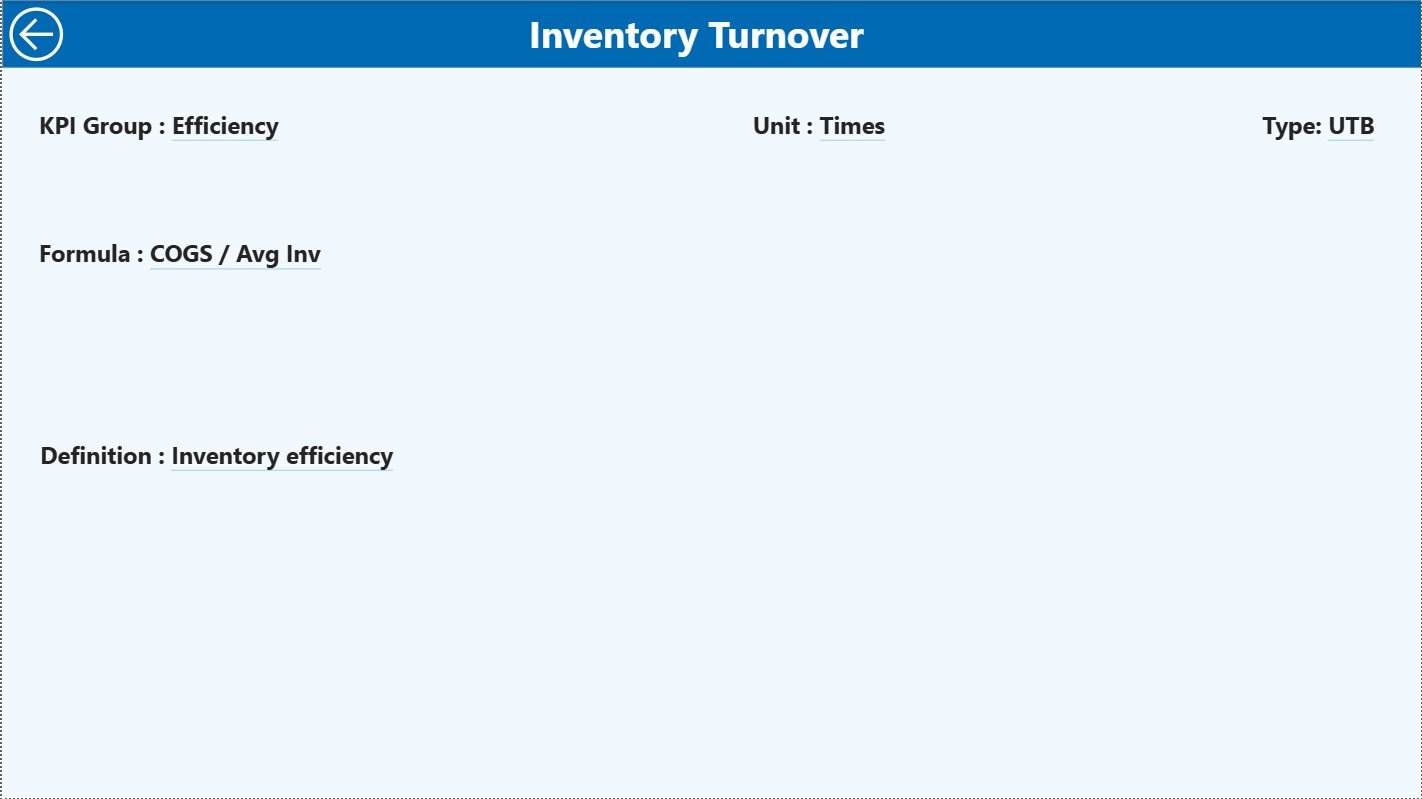
The KPI Definition Page is a drill-through page. This page remains hidden from the main navigation.
How Drill-Through Works
From the Summary Page, users can drill through to this page for a selected KPI. On this page, users can see:
-
KPI Formula
-
KPI Definition
-
KPI Group
-
Unit
-
KPI Type
To return to the main page, users simply click the Back button available at the top-left corner.
This design ensures clarity without cluttering the main dashboard.
What Types of KPIs Can Be Tracked in This Dashboard?
A Finance and Accounting KPI Dashboard in Power BI can track various financial and accounting metrics, such as:
-
Revenue Growth
-
Operating Margin
-
Net Profit Margin
-
Cost Variance
-
Expense Ratio
-
Cash Flow
-
Working Capital
-
Accounts Receivable Turnover
-
Accounts Payable Days
-
Budget Utilization
Because the data model remains flexible, organizations can customize KPIs easily.
Advantages of Finance and Accounting KPI Dashboard in Power BI
Using a Finance and Accounting KPI Dashboard in Power BI offers multiple advantages.
Key Advantages
-
✔️ Centralized financial performance tracking
-
✔️ Real-time interactive analysis
-
✔️ Clear MTD and YTD comparisons
-
✔️ Visual indicators for quick decisions
-
✔️ Easy integration with Excel data
-
✔️ Drill-through for deeper insights
-
✔️ Professional and scalable reporting
As a result, finance teams gain better control and confidence.
How Does This Dashboard Improve Financial Decision-Making?
This dashboard converts raw data into actionable insights. For example:
-
If MTD targets are missed, managers can investigate immediately
-
If YTD growth slows down, leadership can revise forecasts
-
If costs exceed targets, teams can initiate cost-control actions
Therefore, decisions become proactive and data-driven.
Click to Purchases Finance and Accounting KPI Dashboard in Power BI
Common Challenges Without a Finance KPI Dashboard
Without a structured dashboard, finance teams often face:
-
Delayed reporting cycles
-
Manual calculation errors
-
Limited visibility into trends
-
Difficulty comparing periods
-
Poor communication with leadership
A Power BI KPI dashboard solves most of these problems effectively.
Best Practices for the Finance and Accounting KPI Dashboard in Power BI
To maximize value, follow these best practices:
Best Practices
-
Define KPIs clearly in the KPI Definition sheet
-
Maintain consistent KPI units and formulas
-
Update Excel data on a fixed schedule
-
Review both MTD and YTD metrics together
-
Use trend analysis for forecasting
-
Limit KPIs to business-critical metrics
-
Validate data before refreshing the dashboard
By following these practices, organizations ensure long-term reliability.
Who Can Use a Finance and Accounting KPI Dashboard in Power BI?
This dashboard works well for:
-
Finance Managers
-
Accounting Teams
-
CFOs and Controllers
-
Business Owners
-
Financial Analysts
-
Senior Leadership
Because Power BI visuals remain intuitive, adoption becomes smooth.
Click to Purchases Finance and Accounting KPI Dashboard in Power BI
Why Choose Power BI for Finance and Accounting Dashboards?
Power BI offers:
-
Interactive slicers and visuals
-
Strong data modeling
-
Drill-through and tooltips
-
Easy Excel integration
-
Scalable reporting
Therefore, Power BI becomes an ideal platform for financial dashboards.
Conclusion
A Finance and Accounting KPI Dashboard in Power BI is more than a reporting tool. It is a complete financial performance management solution. It brings clarity, speed, and accuracy to financial analysis. Moreover, it empowers finance teams to track KPIs, compare performance, analyze trends, and support strategic decisions.
By combining Excel-based data input with Power BI’s interactive visuals, organizations can build a powerful and flexible financial reporting system. When implemented correctly, this dashboard becomes an essential asset for sustainable business growth.
Frequently Asked Questions (FAQs)
What is the main purpose of a Finance and Accounting KPI Dashboard in Power BI?
The main purpose is to track financial KPIs, compare actuals with targets and previous year values, and support data-driven decisions.
Can this dashboard work with Excel as a data source?
Yes, the dashboard uses an Excel file as its primary data source.
Does the dashboard support both MTD and YTD analysis?
Yes, it clearly displays MTD and YTD metrics along with comparisons.
Can users drill through to see KPI definitions?
Yes, the KPI Definition page allows drill-through for detailed KPI information.
Is this dashboard suitable for small and large organizations?
Yes, it works well for both small businesses and large enterprises.
How often should data be refreshed?
Ideally, data should be updated monthly after financial closing.
Does this dashboard require advanced Power BI skills?
No, basic Power BI knowledge is sufficient to use and maintain it.
Click to Purchases Finance and Accounting KPI Dashboard in Power BI
Visit our YouTube channel to learn step-by-step video tutorials