Managing financial and accounting timelines can be overwhelming without a proper system in place. That’s where the Finance and Accounting Project Timeline KPI Dashboard in Excel steps in. This powerful dashboard template simplifies project tracking by using key performance indicators (KPIs) to monitor timelines, efficiency, and progress – all in one place. Whether you’re part of a small finance team or managing large accounting projects, this dashboard can transform how you track project performance.
What is a Finance and Accounting Project Timeline KPI Dashboard?
Click to Purchases Finance and Accounting Project Timeline KPI Dashboard in Excel
A Finance and Accounting Project Timeline KPI Dashboard is a visual and interactive Excel tool designed to monitor the progress of financial projects. It tracks important KPIs like budget variance, cost performance, schedule adherence, and timeline completion. By using monthly and year-to-date (YTD) figures, it gives real-time insights to drive better decisions.
Key Features of the Dashboard
This ready-to-use Excel template includes 7 powerful worksheets, each designed to provide value and ease of use:
Home Sheet
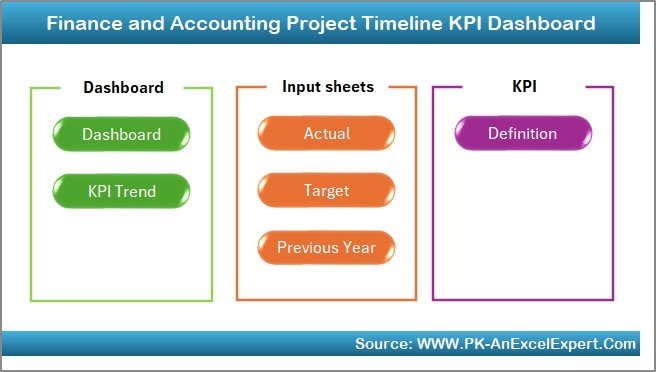
- Acts as an index with navigation buttons.
- Quick access to all dashboard components.
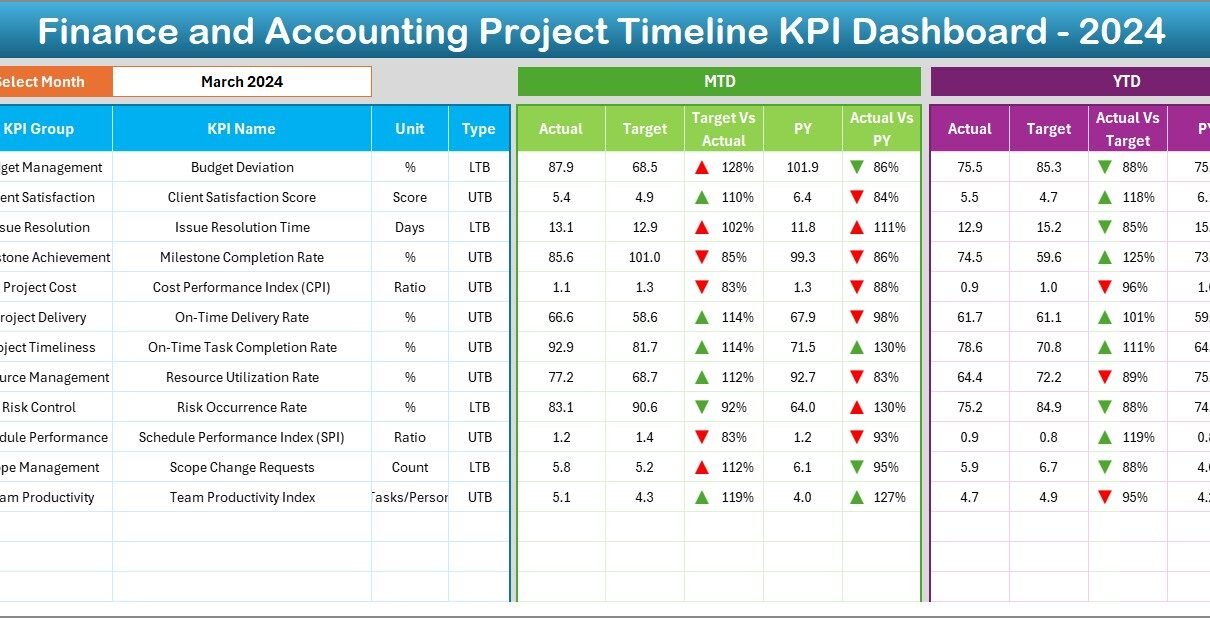
Dashboard Sheet Tab
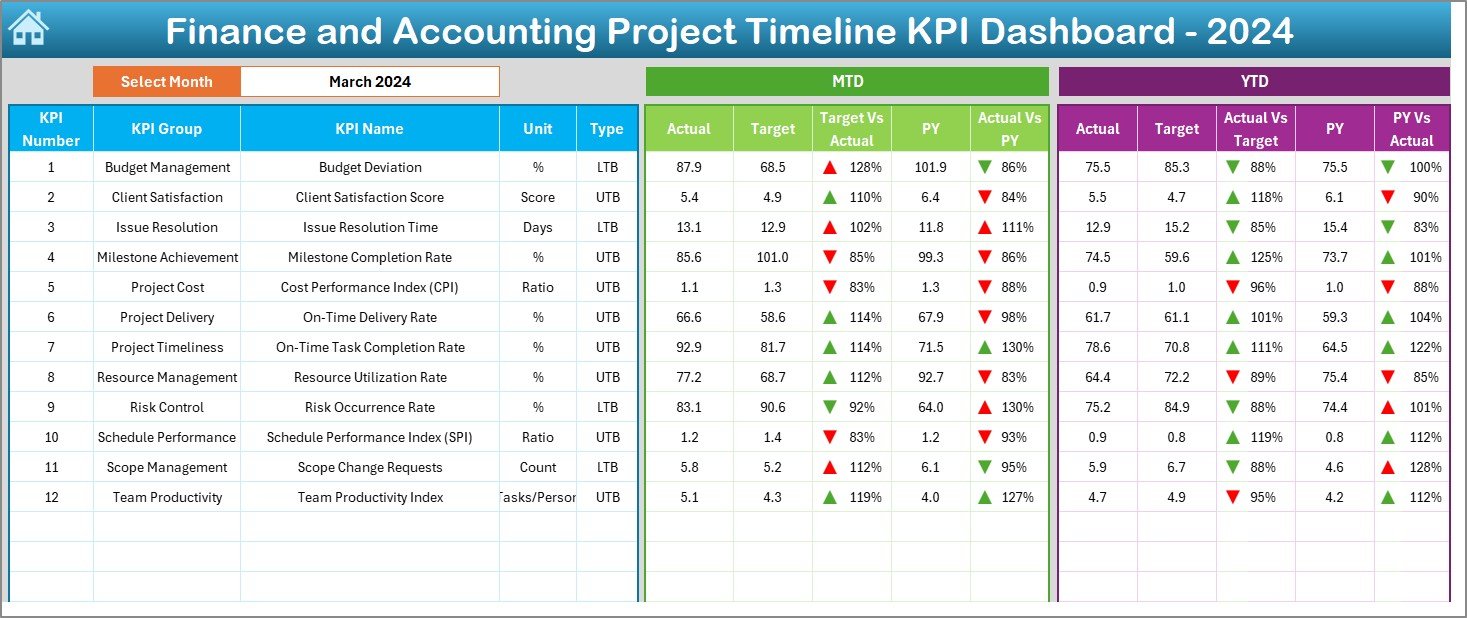
- The main visual hub.
- Select a month from cell D3 to view updated KPI data.
- View MTD (Month-To-Date) and YTD (Year-To-Date) Actual vs Target.
- Compare current performance with the Previous Year.
- Includes conditional formatting using arrows for instant visual feedback.
KPI Trend Sheet Tab
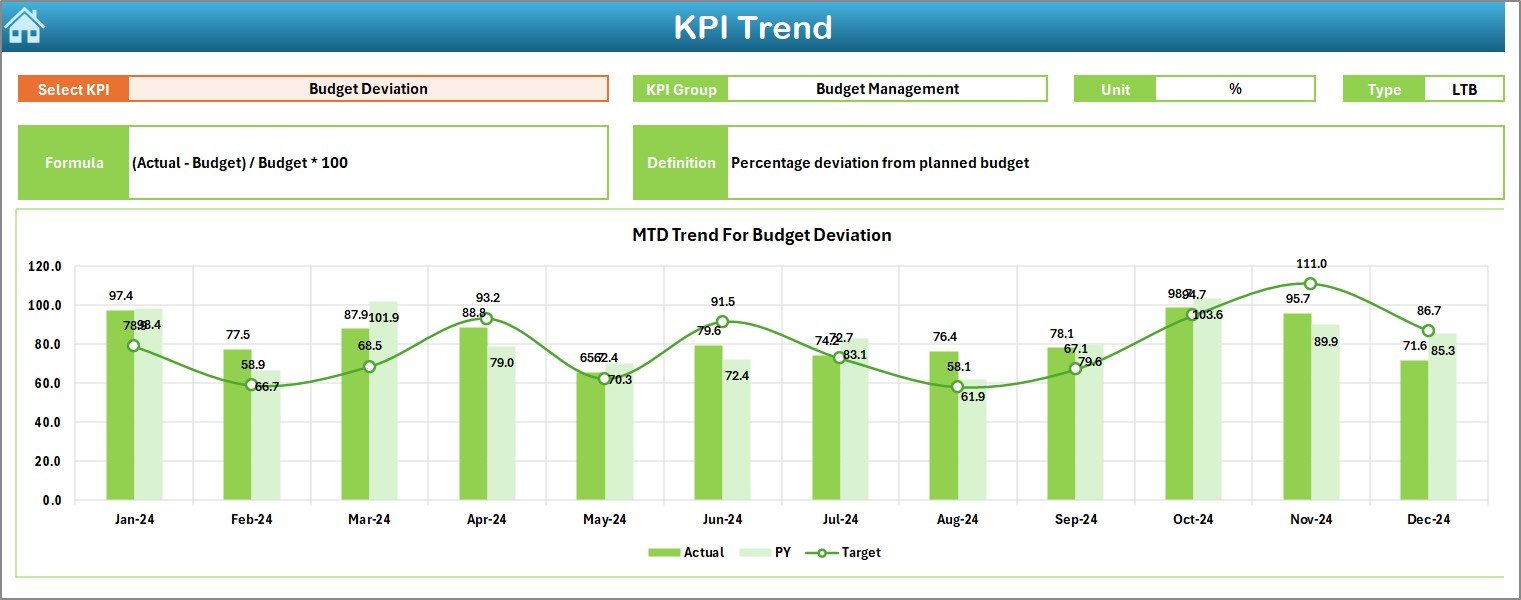
- Use cell C3 to select a specific KPI.
- See details like: KPI Group, Unit, Formula, and Type (LTB or UTB).
- Displays MTD and YTD trends through dynamic charts.
Actual Numbers Input Sheet
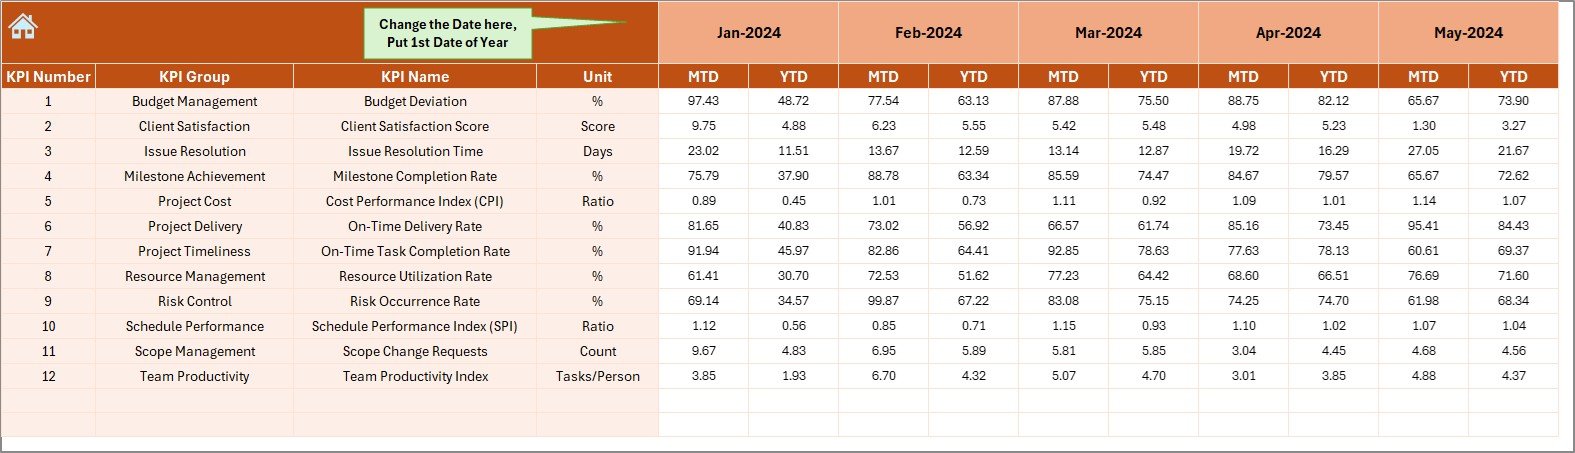
- Input your actual performance data here.
- Use cell E1 to select the first month of the fiscal year.
- Automatically updates other sheets with current inputs.
Target Sheet Tab
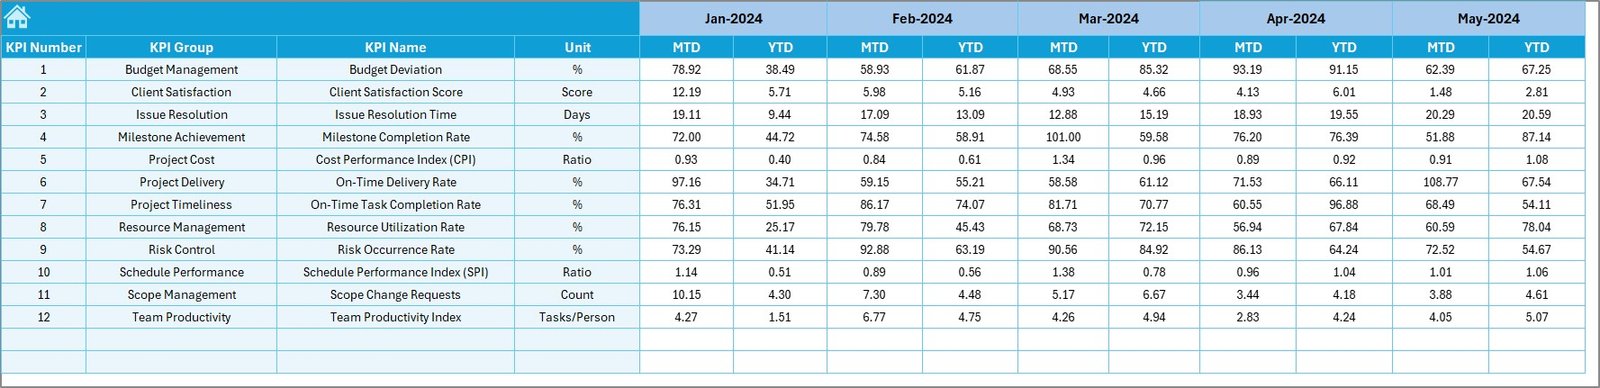
- Define monthly targets for each KPI.
- Input both MTD and YTD values for each KPI.
Click to Purchases Finance and Accounting Project Timeline KPI Dashboard in Excel
Previous Year Number Sheet Tab
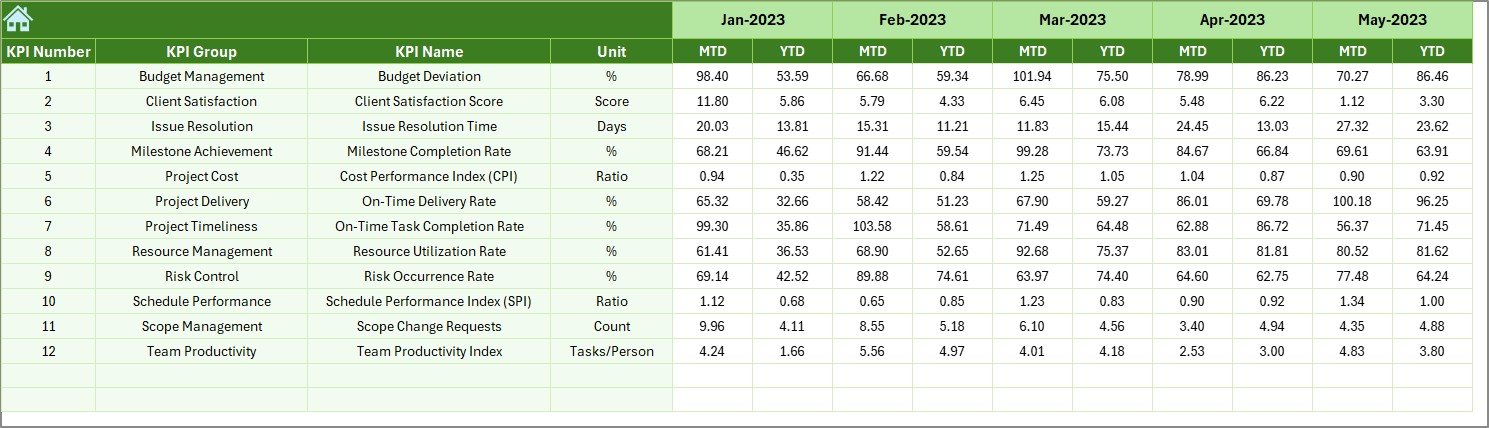
- Enter last year’s performance data for accurate comparisons.
- Helps analyze growth or setbacks effectively.
KPI Definition Sheet Tab
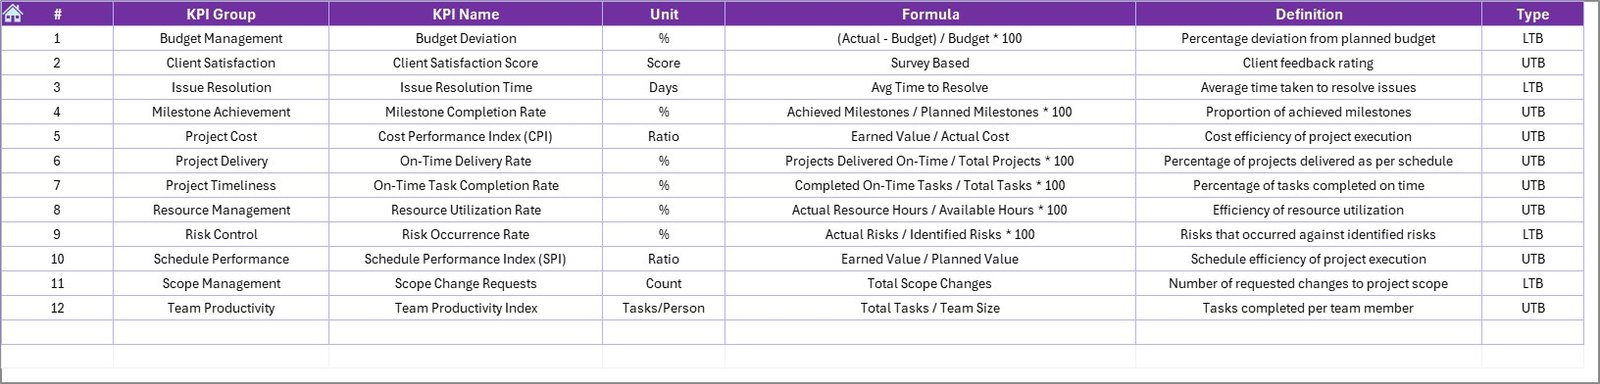
- Store information like KPI Name, Group, Unit, Formula, and concise Definitions.
- Provides transparency and clarity.
Why Should You Use This Dashboard?
If you’re constantly juggling numbers and deadlines, you know how easy it is to lose track. This dashboard helps you:
- Stay organized and focused
- Quickly identify red flags in performance
- Align team efforts with project goals
Advantages of Using the Finance and Accounting Project Timeline KPI Dashboard
📅 Real-Time Monitoring
Easily track progress as soon as numbers are updated.
🔄 Month-to-Date and Year-to-Date Analysis
Compare actuals vs targets monthly and annually.
📈 Data Visualization
Understand trends with easy-to-read charts and conditional formatting.
💡 Fully Customizable
Modify KPIs, formulas, and charts based on your team’s needs.
📊 Improve Decision Making
Make data-driven decisions faster with clear, actionable metrics.
Best Practices for Using the KPI Dashboard
To get the best results from your dashboard, follow these tried-and-tested practices:
Define KPIs Clearly
Make sure every KPI has a clear definition, unit, and type. Keep it consistent.
Set Achievable Targets
Avoid setting unrealistic goals. Use historical data to guide your benchmarks.
Regularly Update Data
Update actuals and targets every month to keep the dashboard relevant.
Use Conditional Formatting
Leverage built-in arrows to quickly spot issues or improvements.
Focus on Trends
Review the KPI trend sheet regularly to identify growth patterns or concerns.
How to Set Up the Dashboard in Excel
Setting up the dashboard is simple and doesn’t require advanced Excel skills. Here’s a step-by-step approach:
Step 1: Start with the Home Sheet
Click on the buttons to move between sheets. Familiarize yourself with the structure.
Step 2: Input Actual Data
Go to the “Actual Numbers Input” sheet and update MTD and YTD values monthly.
Step 3: Set Targets
Open the “Target Sheet Tab” and input your monthly and yearly goals.
Step 4: Add Previous Year Data
Input last year’s MTD and YTD values into the “Previous Year Number” sheet.
Step 5: Monitor the Dashboard
Go to the Dashboard tab, select the month from cell D3, and analyze your KPIs.
Examples of KPIs You Can Track
Here are some sample KPIs tailored for finance and accounting projects:
- Project Completion Rate (UTB)
- On-Time Delivery Rate (UTB)
- Budget Variance (LTB)
- Cost Performance Index (UTB)
- Resource Utilization Rate (UTB)
- Issue Resolution Time (LTB)
- Forecast Accuracy (UTB)
- Audit Readiness Score (UTB)
- Compliance Rate (UTB)
- Financial Reporting Timeliness (UTB)
What Makes This Excel Dashboard Unique?
Unlike complex tools, this dashboard focuses on simplicity and results:
- No need for external software
- Built completely in Excel
- Easy monthly updates
- Clean layout with interactive filters
Whether you manage multiple stakeholders or run solo projects, this template adapts to your workflow effortlessly.
Conclusion
Managing finance and accounting projects becomes far more effective with the right tools. The Finance and Accounting Project Timeline KPI Dashboard in Excel not only saves time but also gives you the insights you need to stay on top of performance.
Frequently Asked Questions (FAQs)
Who can use this KPI dashboard?
Anyone involved in finance, accounting, or project management can benefit—from small teams to large enterprises.
Do I need advanced Excel skills to use it?
Not at all. The dashboard is beginner-friendly with clear labels, buttons, and easy input fields.
Can I customize the KPIs?
Yes, all KPIs, formulas, and formats are fully editable.
How often should I update the data?
It’s best to update the dashboard monthly for accurate tracking and analysis.
Click to Purchases Finance and Accounting Project Timeline KPI Dashboard in Excel
Visit our YouTube channel to learn step-by-step video tutorials