In today’s fast-changing financial environment, maintaining strict regulatory compliance is not just a necessity—it is a competitive advantage. That’s exactly why a Finance and Accounting Regulatory Adherence KPI Dashboard becomes essential.
In this article, we will walk you through everything you need to know about this powerful tool. You will discover its features, advantages, best practices, and answers to common questions. Whether you are managing a small finance team or a large corporation’s accounting department, this dashboard can make your life easier and your reporting smarter!
Click to Purchases Finance and Accounting Regulatory Adherence KPI Dashboard in Excel
What is a Finance and Accounting Regulatory Adherence KPI Dashboard?
Before we dive deep, let’s first understand what this dashboard is all about.
A Finance and Accounting Regulatory Adherence KPI Dashboard is a ready-to-use Excel template that helps you monitor, track, and evaluate your finance team’s compliance with regulatory standards.
Instead of manually checking hundreds of records, you get a simple, visual, and dynamic view of all critical KPIs (Key Performance Indicators) related to regulatory adherence.
Moreover, because it is designed in Excel, you can easily customize it, update it every month, and even present it to stakeholders during reviews or audits.
Key Features of the Finance and Accounting Regulatory Adherence KPI Dashboard
This dashboard includes 7 well-structured worksheets, each serving a unique purpose. Let’s explore them one by one:
Home Sheet
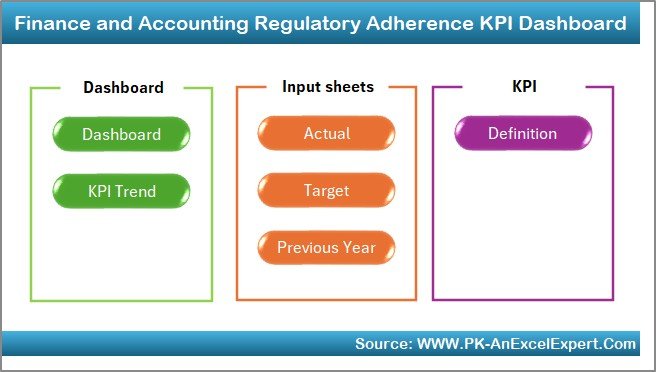
- Serves as the index page.
- Includes six navigation buttons to easily jump to any sheet.
- Makes the dashboard user-friendly and saves time.
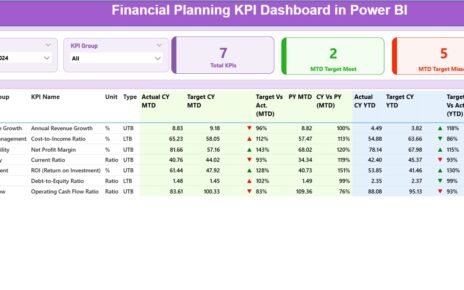
Dashboard Sheet Tab
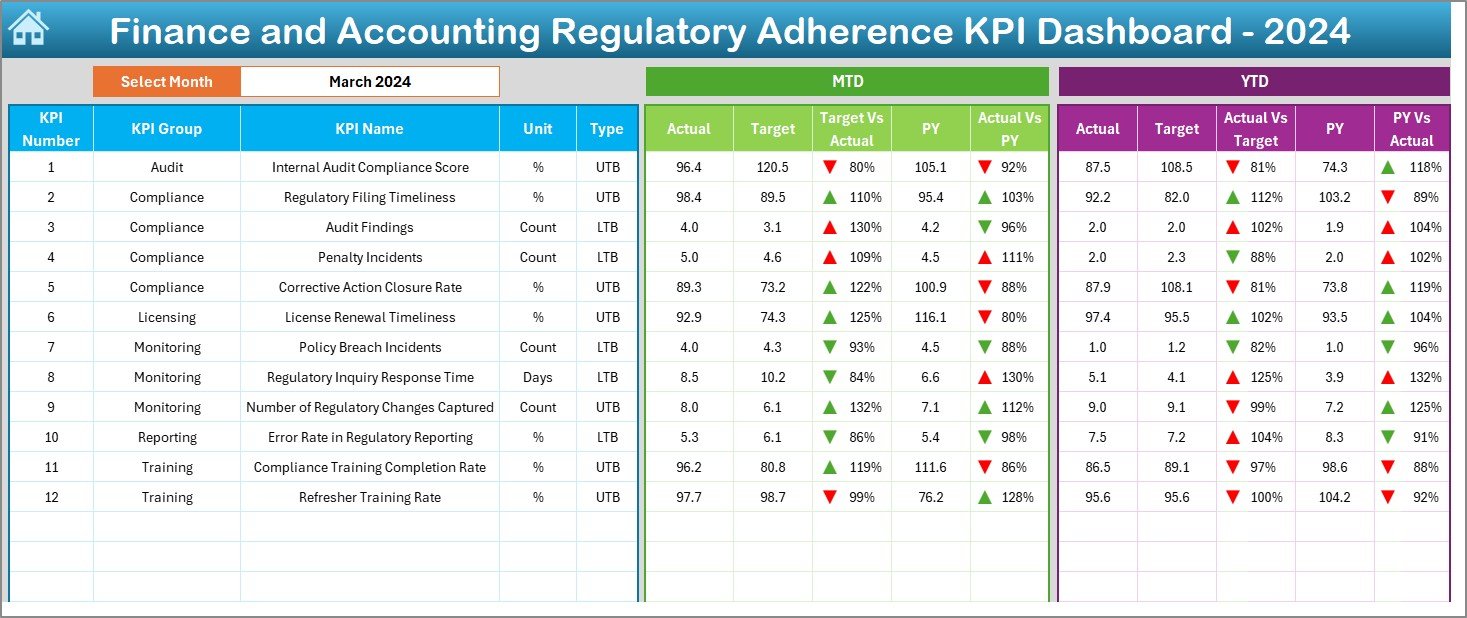
- The main display page for all KPIs.
- Select the month from a drop-down list in cell D3.
- Instantly see updated KPI numbers for the selected month.
- Shows MTD (Month-to-Date) Actual, Target, and Previous Year data.
- Displays YTD (Year-to-Date) Actual, Target, and Previous Year comparisons.
- Uses conditional formatting to show performance trends with up and down arrows.
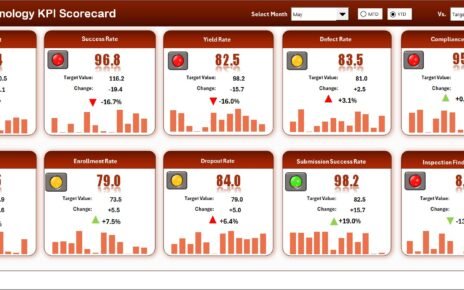
KPI Trend Sheet Tab
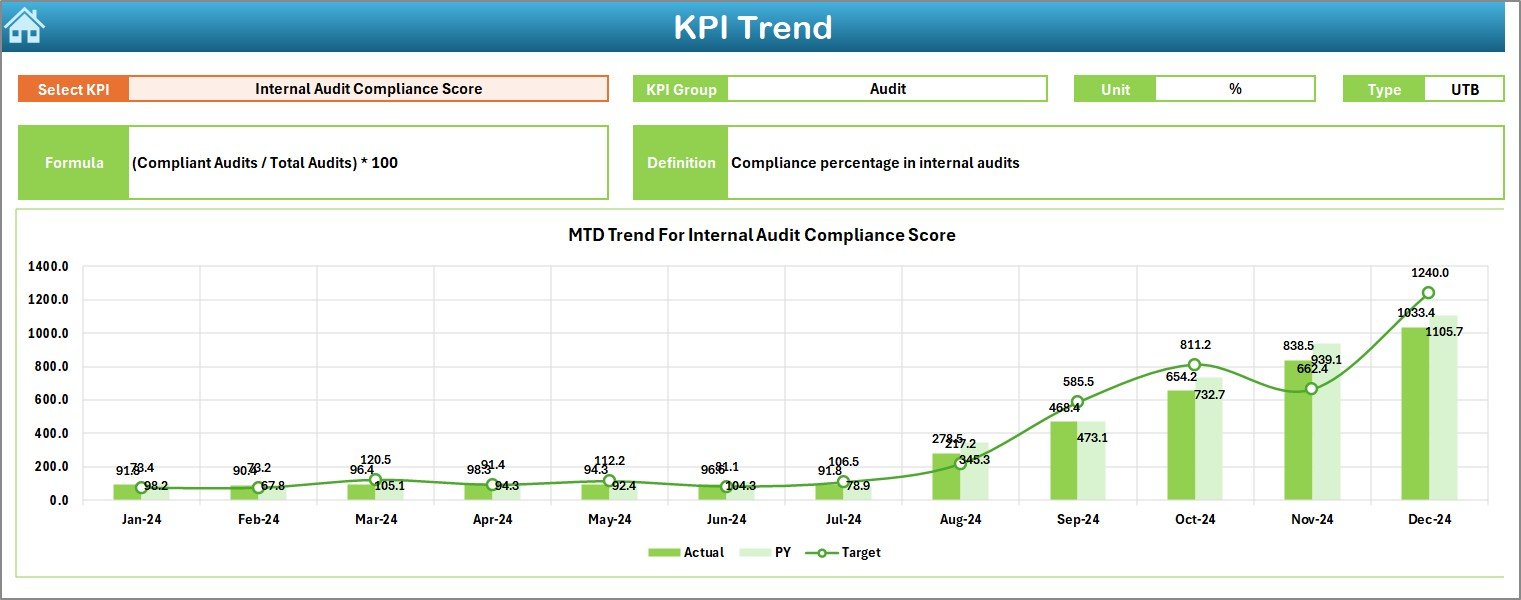
- Choose the KPI name from a drop-down in cell C3.
- Displays key KPI information like Group, Unit, Type (Lower the Better or Upper the Better), Formula, and Definition.
- Presents trend charts for MTD and YTD—helping you spot issues early.
Actual Numbers Input Sheet
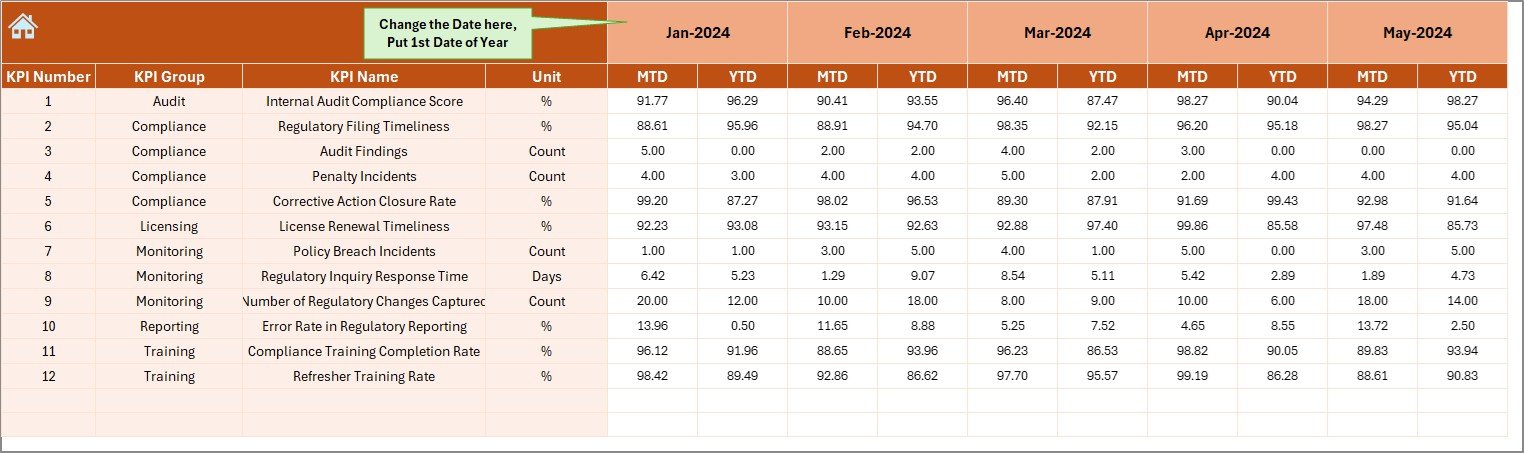
- Enter the actual performance numbers here.
- Update both MTD and YTD for each month.
- Select the starting month of the financial year easily via cell E1.
Target Sheet Tab
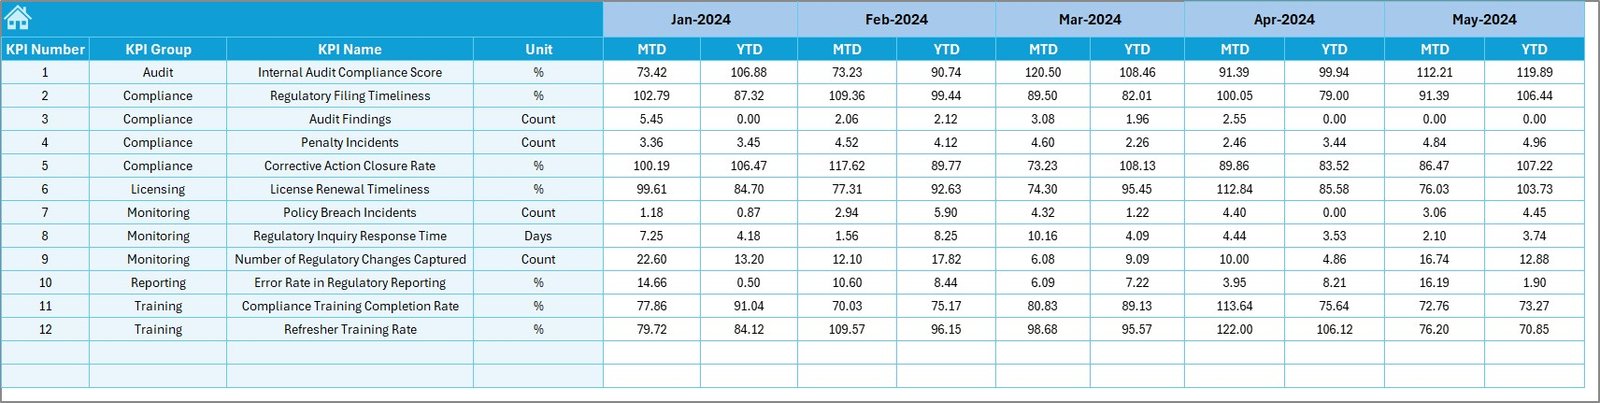
- Enter target values for every KPI, both for MTD and YTD.
- Helps you compare actual vs target and identify gaps.
Previous Year Number Sheet Tab
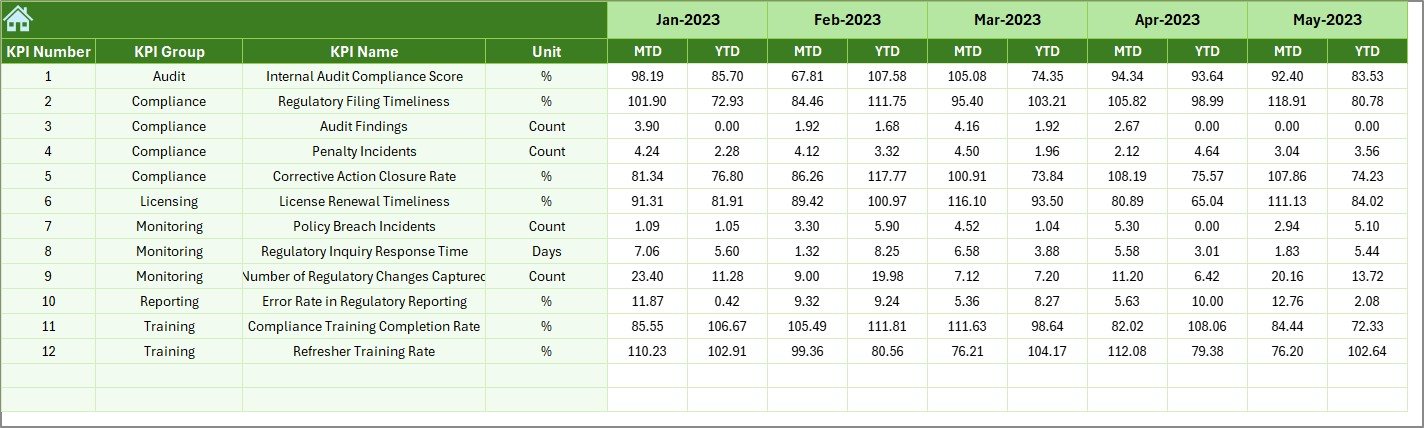
- Input the previous year’s data for a fair comparison.
- Essential for year-over-year analysis.
KPI Definition Sheet Tab
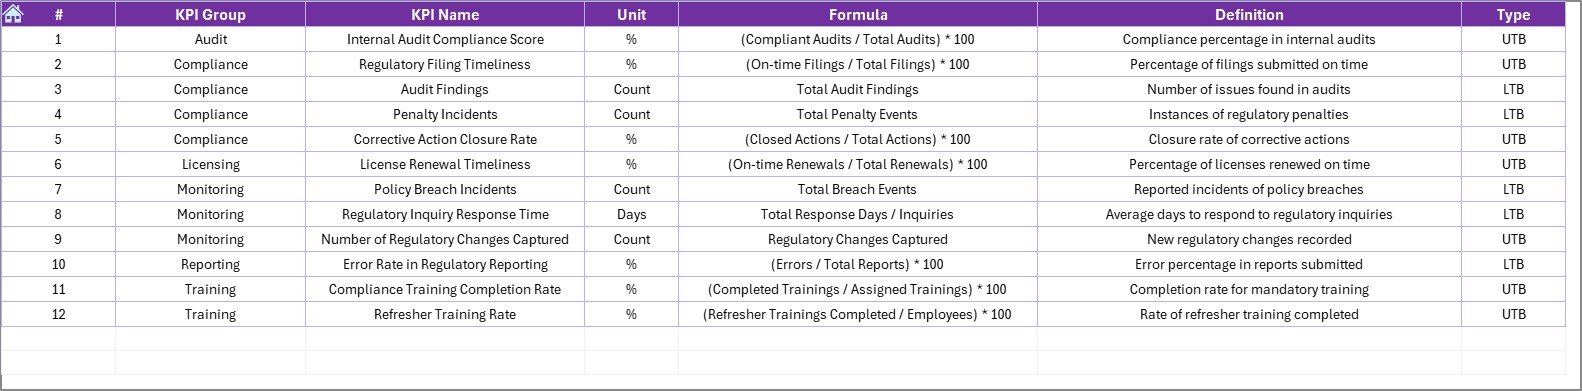
- Document all KPI details like Name, Group, Unit, Formula, and Definition.
- Keeps your dashboard clean and understandable for everyone.
Why Do You Need a Regulatory Adherence KPI Dashboard?
Now, you might wonder—why do I even need this dashboard?
Let’s find out:
- ✅ Ensures full compliance with financial regulations.
- ✅ Identifies risk areas early, before they become big issues.
- ✅ Saves time by automating monitoring and reporting.
- ✅ Improves communication with senior management.
- ✅ Boosts team accountability by tracking each KPI clearly.
Click to Purchases Finance and Accounting Regulatory Adherence KPI Dashboard in Excel
Clearly, if you want your finance department to run smoothly and stay audit-ready, this dashboard is not a luxury—it is a necessity!
Advantages of the Finance and Accounting Regulatory Adherence KPI Dashboard
There are several outstanding benefits to using this dashboard. Let’s break them down:
Real-Time Monitoring
You can view updated KPI metrics as soon as you enter the new numbers. No need to build complex pivot tables or graphs every month!
Easy to Use
The dashboard runs on simple Excel formulas and drop-downs, making it accessible even for those without an advanced Excel background.
Clear Visualization
Conditional formatting and trend charts give instant visual cues about performance improvements or declines.
Customizable
Since it is built in Excel, you can easily add new KPIs, change color themes, or customize it according to your company’s branding.
Audit Preparedness
All your KPI records are neatly maintained and readily available for any audit review, helping you pass audits without stress.
How to Set Up the Finance and Accounting Regulatory Adherence KPI Dashboard?
Setting up the dashboard is straightforward if you follow these easy steps:
Download and open the template in Microsoft Excel.
Go to the KPI Definition Sheet and fill in your company’s specific KPIs.
Enter Target Numbers in the Target Sheet tab.
Update Actual Numbers each month in the Actual Numbers Input Sheet.
Fill Previous Year Data for comparisons.
Use the Dashboard Sheet to select a month and monitor performance.
Use KPI Trend Charts for deeper analysis and decision-making.
That’s it! You are ready to track regulatory adherence like a pro!
Best Practices for Using the Regulatory Adherence KPI Dashboard
To maximize the dashboard’s effectiveness, keep these best practices in mind:
Regular Updates
Update your actual and target numbers at least once a month. Consistency ensures better reporting accuracy.
Validate Data Accuracy
Always double-check the actual figures before entering them. A small mistake can lead to misleading dashboards.
Review KPIs Annually
Each year, review and update your KPIs based on changes in regulatory standards.
Educate Your Team
Train your team members on how to use and interpret the dashboard to promote collective ownership.
Customize as Needed
If new regulations arise, don’t hesitate to add new KPIs or modify existing ones to stay compliant.
How Can the Regulatory Adherence KPI Dashboard Help During an Audit?
Auditors love organized data. When you show them your dashboard:
- They can instantly see how you have been tracking compliance.
- You can prove that your targets were realistic and achieved.
- You have full visibility into past and present performance.
- You reduce audit stress dramatically because everything is already in place!
Thus, the dashboard becomes a trusted weapon during audit times.
How Often Should You Update the Regulatory Adherence KPI Dashboard?
It is best to update the dashboard once every month right after closing the financials.
However, during busy periods like financial year-end, regulatory submissions, or internal audits, you might want to update it more frequently, such as weekly.
Timely updates ensure there are no last-minute surprises!
Conclusion
A Finance and Accounting Regulatory Adherence KPI Dashboard is no longer just a “nice-to-have”—it is critical for success.
This Excel-based dashboard gives you a simple, professional, and efficient way to track, monitor, and improve your finance department’s compliance efforts.
By following the best practices, updating the data regularly, and keeping the dashboard clean, you can easily stay ahead of regulatory risks and set a new standard of excellence for your team.
Take control of your compliance journey today with the Regulatory Adherence KPI Dashboard—it’s easier than you think!
Frequently Asked Questions (FAQs)
What is the purpose of a Finance and Accounting Regulatory Adherence KPI Dashboard?
The main purpose is to monitor how well the finance and accounting department adheres to regulatory requirements and to identify any gaps early.
How difficult is it to use this dashboard?
Not difficult at all! It runs on Excel with simple drop-downs, charts, and basic data entry.
Can I customize the dashboard for my specific company needs?
Yes, absolutely! You can add or remove KPIs, change colors, adjust formulas, and brand it as per your company’s standards.
How often should I update the data in the dashboard?
It is ideal to update it once a month. However, during audit periods or regulatory deadlines, more frequent updates might be needed.
What happens if I forget to enter previous year’s data?
Without previous year data, you lose the ability to compare year-over-year performance, making the analysis less meaningful.
Is the dashboard suitable for large organizations?
Yes! Whether you have 10 KPIs or 100 KPIs, you can scale the dashboard easily according to your organization’s size.
Click to Purchases Finance and Accounting Regulatory Adherence KPI Dashboard in Excel
Visit our YouTube channel to learn step-by-step video tutorials
Watch the step-by-step video Demo: