In today’s fast-paced business environment, tracking revenue performance efficiently is not just a nice-to-have—it’s absolutely essential. That’s where a Finance and Accounting Revenue Tracking KPI Dashboard in Excel steps in. This tool is a game-changer for finance teams, accountants, and business owners who want to stay on top of revenue targets, performance gaps, and trends, all in one place.
This comprehensive article will walk you through everything you need to know about setting up and using a Finance and Accounting Revenue Tracking KPI Dashboard in Excel. We’ll explore its structure, key features, advantages, best practices, and frequently asked questions.
Click to Purchases Finance and Accounting Revenue Tracking KPI Dashboard in Excel
What is a Finance and Accounting Revenue Tracking KPI Dashboard?
A Revenue Tracking KPI Dashboard in Excel is a dynamic and interactive reporting tool designed to monitor financial KPIs over time. It provides a snapshot of your revenue data—month-to-date (MTD), year-to-date (YTD), targets, and previous year figures—alongside visual indicators like trend charts and comparison arrows.
By using Excel’s powerful formulas, drop-downs, conditional formatting, and pivot tables, this dashboard makes it easy to visualize performance and identify areas that need attention.
Key Features of the Dashboard
The dashboard consists of 7 well-organized worksheets:
Home Sheet
- Acts as an index
- Includes six navigation buttons
- Helps users quickly jump to different parts of the dashboard
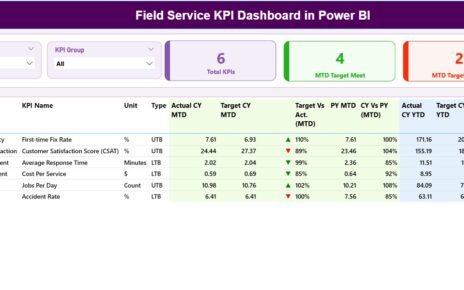
Dashboard Sheet
- Main reporting sheet
- Month selection drop-down at cell D3
- Displays:
- MTD Actual, Target, and Previous Year values
- YTD Actual, Target, and Previous Year values
- Target vs Actual and PY vs Actual differences
- Conditional formatting with up/down arrows to indicate performance trends
KPI Trend Sheet
- Dropdown in cell C3 to select a KPI
- Displays:
- KPI Group
- KPI Unit and Type (LTB or UTB)
- KPI Formula and Definition
- MTD and YTD trend charts (Actual, Target, PY)
Actual Numbers Input Sheet
- Enter monthly MTD and YTD figures
- Starting month selected in E1
Target Sheet
- Input MTD and YTD targets for each KPI
Previous Year Numbers Sheet
- Enter PY numbers similar to current year structure
KPI Definition Sheet
- Contains:
- KPI Name
- KPI Group
- Unit
- Formula
- Brief Definition
Click to Purchases Finance and Accounting Revenue Tracking KPI Dashboard in Excel
Advantages of Using a Revenue Tracking KPI Dashboard
✅ Instant Performance Insights
- One glance shows how you’re performing against your goals.
✅ Enhanced Decision Making
- Historical and comparative data supports better financial decisions.
✅ Customizable and Scalable
- Add new KPIs, formulas, and months without breaking the dashboard.
✅ No Special Software Required
- Built entirely in Excel. No external tools needed.
✅ Time-Saving
- Automated updates and formulas save manual effort and time.
Best Practices for Using the Dashboard
✔️ Keep KPI Definitions Clear
Ensure each KPI is well-defined in the “KPI Definition” sheet. It helps maintain consistency and understanding across teams.
✔️ Update Actuals and Targets Monthly
Timely updates in the “Actual Numbers” and “Target” sheets ensure accurate analysis.
✔️ Use Conditional Formatting Wisely
Arrows and color codes make performance trends more intuitive.
✔️ Backup Regularly
Create monthly backups to avoid data loss during updates or accidental changes.
✔️ Train Your Team
Make sure all users understand how to navigate and update the dashboard effectively.
Common KPIs Used in Finance and Revenue Tracking
Here are some commonly used KPIs that you can include in your dashboard:
- Revenue Growth Rate – (Current Revenue – Previous Revenue) / Previous Revenue
- Gross Profit Margin – (Gross Profit / Revenue)
- Net Profit Margin – (Net Profit / Revenue)
- Operating Expenses Ratio – (Operating Expenses / Revenue)
- Customer Acquisition Cost (CAC) – Total Cost of Acquisition / New Customers
- Customer Lifetime Value (CLTV) – Average Purchase Value × Purchase Frequency × Customer Lifespan
- Accounts Receivable Turnover – Net Credit Sales / Average Accounts Receivable
- EBITDA Margin – EBITDA / Total Revenue
- Return on Investment (ROI) – Net Profit / Investment
- Working Capital Ratio – Current Assets / Current Liabilities
- Debt-to-Equity Ratio – Total Debt / Shareholder’s Equity
How to Build the Dashboard from Scratch
Plan Your KPIs
Select the most important metrics aligned with your goals.
Set Up the Sheets
Create the 7 sheets as outlined.
Create Dropdowns
Use Excel’s Data Validation for Month and KPI selection.
Add Formulas
Calculate MTD, YTD, Targets, PY, and Variance.
Insert Charts
Use line and column charts for trends.
Add Conditional Formatting
Green arrows for improvements, red for declines.
Link Everything to the Home Page
Add buttons with hyperlinks for smooth navigation.
Real-Life Scenarios Where This Dashboard is Useful
💼 Small Business Owners
They can track monthly income and expenses effortlessly.
🏢 Finance Managers
Helps them provide timely insights during monthly or quarterly reviews.
🎓 Educational Institutions
Monitors grants, tuitions, and other revenue streams.
🏦 Nonprofits
Keeps tabs on donations, sponsorships, and budget allocations.
📆 Monthly Reporting Made Easy
Instead of juggling through raw data and multiple sheets, this dashboard provides a single view of what matters most. With just a few clicks, stakeholders can view:
- KPI performance for the current month
- Trends compared to targets and last year
- Areas that need improvement
📍 Why Excel for Revenue Dashboards?
- Universal Tool: Almost every organization uses Excel
- Cost-Effective: No need for paid BI tools
- Highly Customizable: You can tailor it exactly to your process
- Low Learning Curve: Easy for teams to adopt
🔧 Tips to Keep Your Dashboard Running Smoothly
- Use consistent formatting and cell references
- Avoid merging cells wherever possible
- Document any complex formula for easy reference
- Use Named Ranges for dropdowns and calculations
Conclusion
The Finance and Accounting Revenue Tracking KPI Dashboard in Excel isn’t just a spreadsheet—it’s a powerful financial command center. Whether you’re trying to meet your quarterly targets, understand profit margins, or plan for the next fiscal year, this dashboard makes your job a whole lot easier.
It saves time, ensures accuracy, and provides real-time visibility into financial health—all inside the familiar and flexible environment of Excel.
Frequently Asked Questions
❓ What KPIs should I include in my revenue dashboard?
Include key financial KPIs such as revenue growth, net profit margin, customer acquisition cost, and working capital ratio.
❓ Can I use this dashboard in Google Sheets?
Yes, with slight modifications. Some features like buttons may not work, but the logic and structure remain usable.
❓ How often should I update the dashboard?
Update the actuals and targets monthly. Back up your file before every update.
❓ Can non-finance users understand and use this dashboard?
Yes, the dashboard uses clear labels, simplified visuals, and dropdowns for easy use by non-finance users.
Click to Purchases Finance and Accounting Revenue Tracking KPI Dashboard in Excel
Visit our YouTube channel to learn step-by-step video tutorials