Modern businesses generate financial data every single day. Companies record revenue, expenses, budgets, and profits across multiple departments, regions, and customer groups. However, many organizations still struggle to convert this raw data into meaningful insights. As a result, decision-makers often rely on manual reports and scattered spreadsheets.
Therefore, businesses need a smarter way to monitor financial performance in real time. This is exactly where a Finance Dashboard in Power BI becomes powerful.
A Finance Dashboard in Power BI helps organizations track financial KPIs, analyze profitability, monitor budgets, and understand trends using interactive visuals. Instead of spending hours preparing reports, leaders can instantly evaluate financial health through dynamic dashboards.
In this comprehensive guide, you will learn everything about the Finance Dashboard in Power BI, including features, benefits, structure, best practices, and real-world applications.
Click to buy Finance Dashboard in Power BI
What Is a Finance Dashboard in Power BI?
A Finance Dashboard in Power BI is an interactive business intelligence solution that visualizes financial data using charts, KPIs, filters, and analytical reports.
Power BI connects multiple financial datasets and transforms them into visual insights. Consequently, finance teams can analyze performance faster and make confident decisions.
Typically, the dashboard combines:
- Revenue data
- Budget planning records
- Expense tracking
- Profit calculations
- Department performance metrics
- Regional financial results
- Monthly financial trends
Because Power BI updates visuals dynamically, users can instantly explore data using slicers and filters.
Why Do Businesses Need a Finance Dashboard?
Financial management requires accuracy, speed, and clarity. However, traditional reporting methods slow down analysis and increase errors.
A finance dashboard solves these challenges by offering:
- Real-time performance monitoring
- Automated calculations
- Visual storytelling through charts
- Centralized financial information
- Faster executive decision-making
Moreover, organizations gain better visibility into profit drivers and cost centers.
Key Features of the Finance Dashboard in Power BI
This Finance Dashboard includes five analytical pages designed for complete financial monitoring. Each page focuses on a different business perspective.
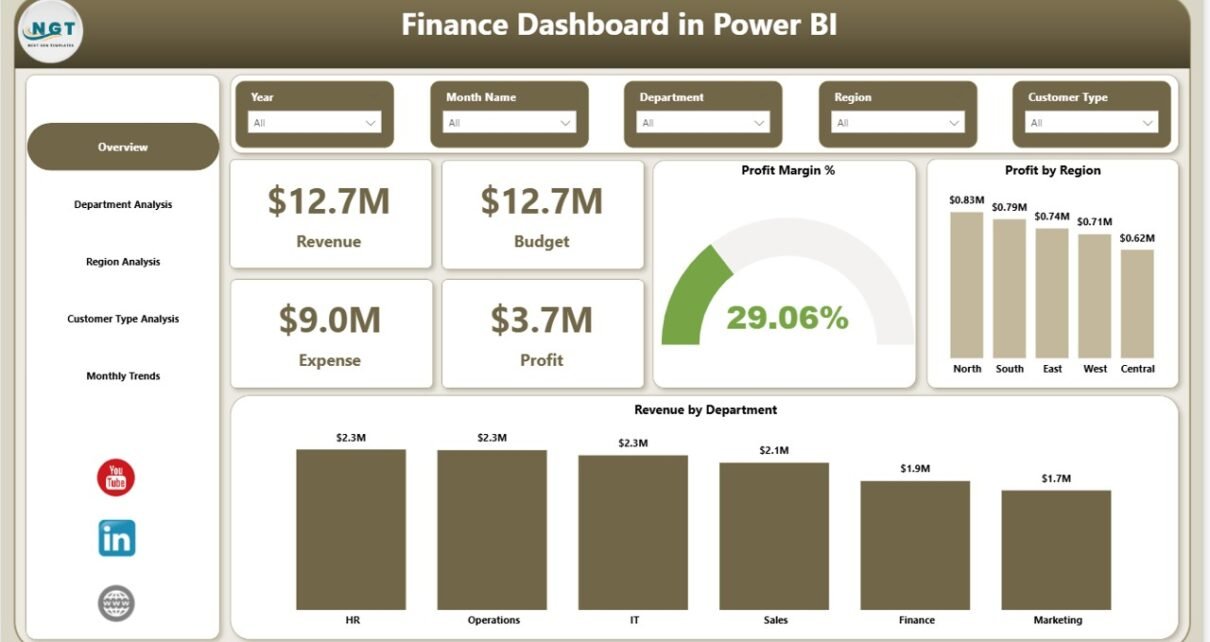
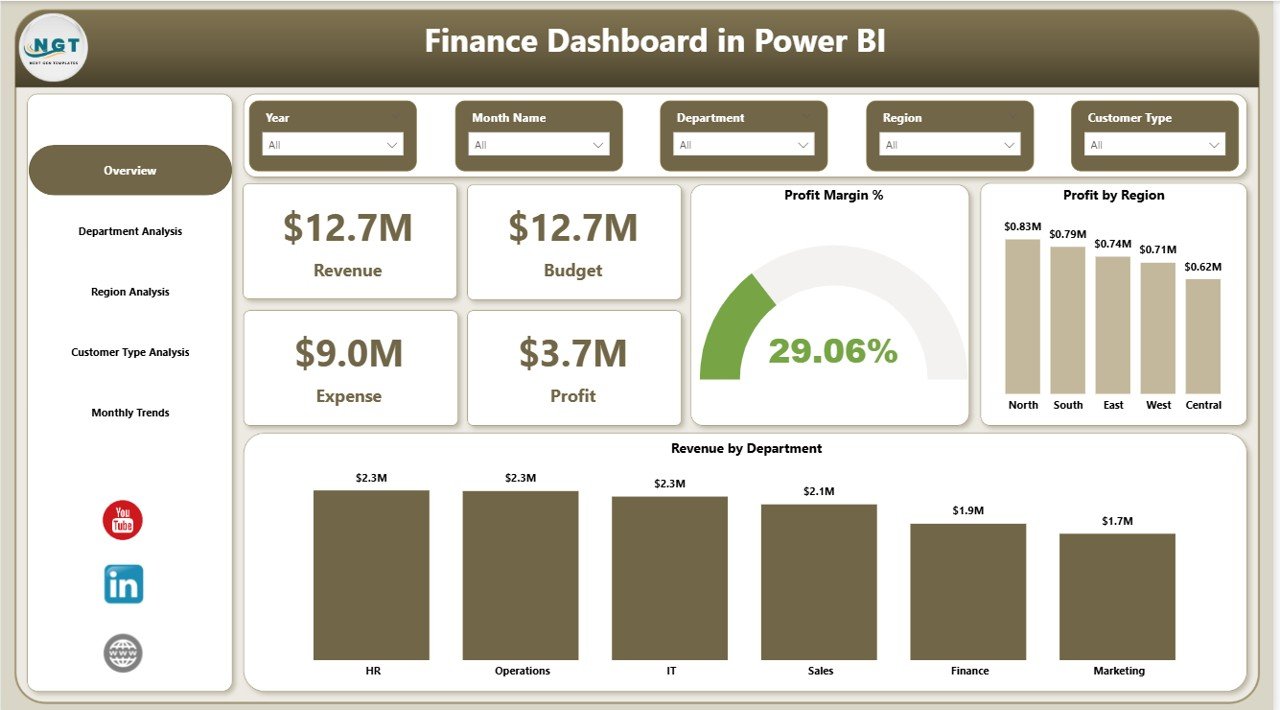
Overview Page – How Does the Business Perform Overall?
The Overview Page acts as the central control panel of the dashboard. It provides a quick summary of financial performance.
KPI Cards
The dashboard displays four main financial indicators:
- Revenue
- Budget
- Expense
- Profit
These cards immediately show whether the organization meets financial expectations.
Charts Included
- Profit Margin % – Measures profitability efficiency
- Profit by Region – Identifies high-performing markets
- Revenue by Department – Highlights departmental contribution
Because executives need quick insights, this page delivers a high-level snapshot instantly.
Click to buy Finance Dashboard in Power BI
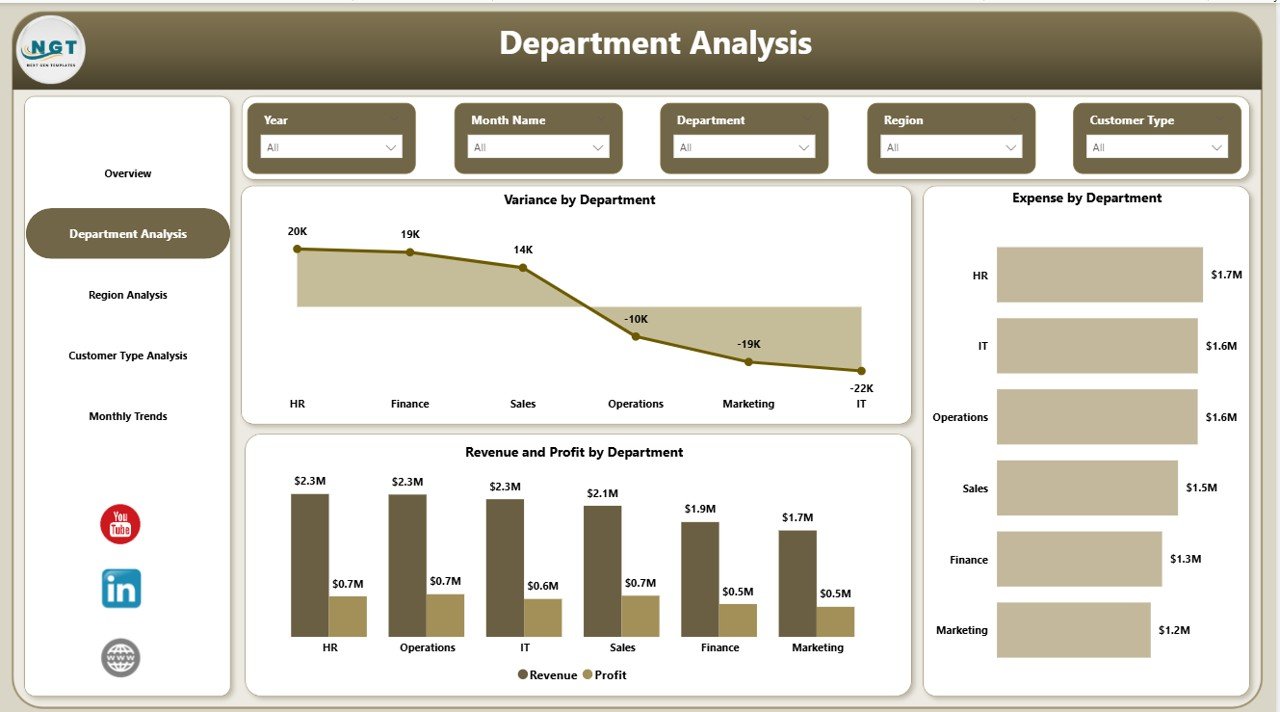
Department Analysis – Which Departments Drive Profit?
Departments influence organizational success differently. Therefore, analyzing departmental performance becomes essential.
Charts Available
- Variance by Department
- Expense by Department
- Revenue and Profit by Department
This analysis helps managers:
- Detect overspending departments
- Compare revenue contribution
- Improve operational efficiency
As a result, leadership can allocate budgets more effectively.
Click to buy Finance Dashboard in Power BI
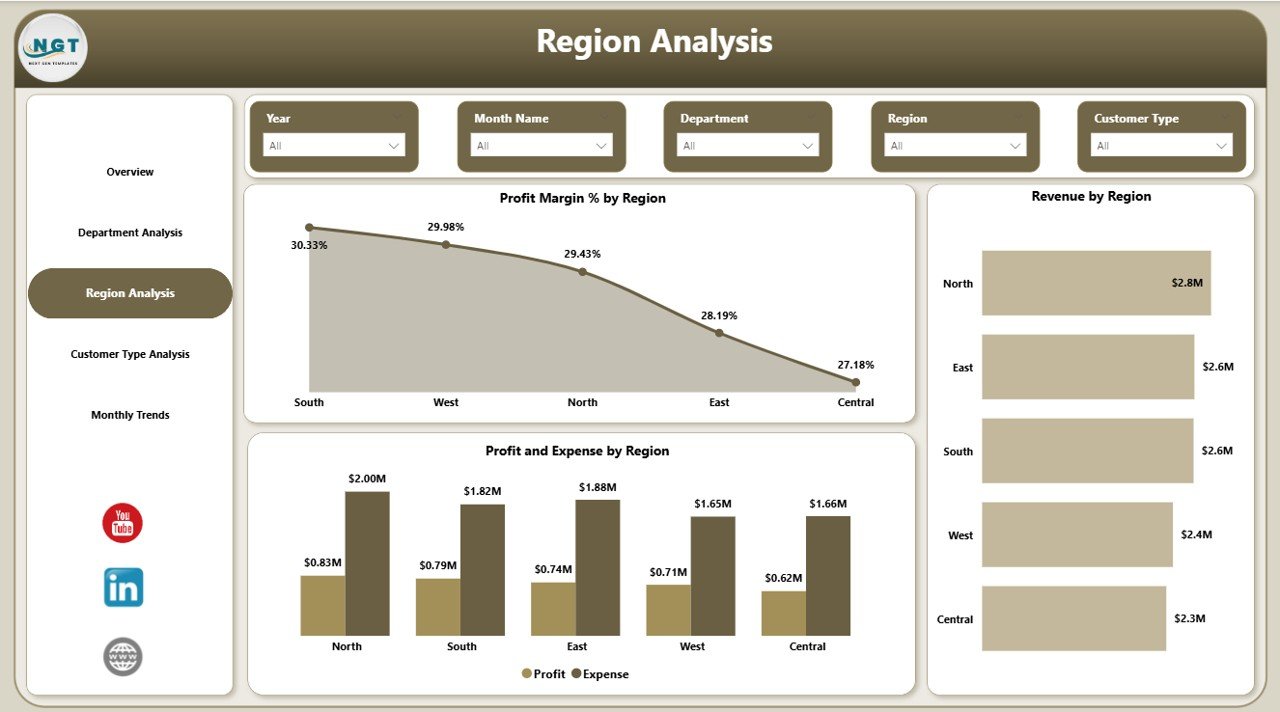
Region Analysis – Where Does Financial Growth Come From?
Regional performance plays a major role in financial planning. Some regions generate higher profits, while others require strategic improvement.
Charts Included
- Profit Margin % by Region
- Revenue by Region
- Profit and Expense by Region
Using this page, organizations can:
- Identify profitable markets
- Control regional expenses
- Optimize expansion strategies
Consequently, businesses invest resources in high-performing locations.
Click to buy Finance Dashboard in Power BI
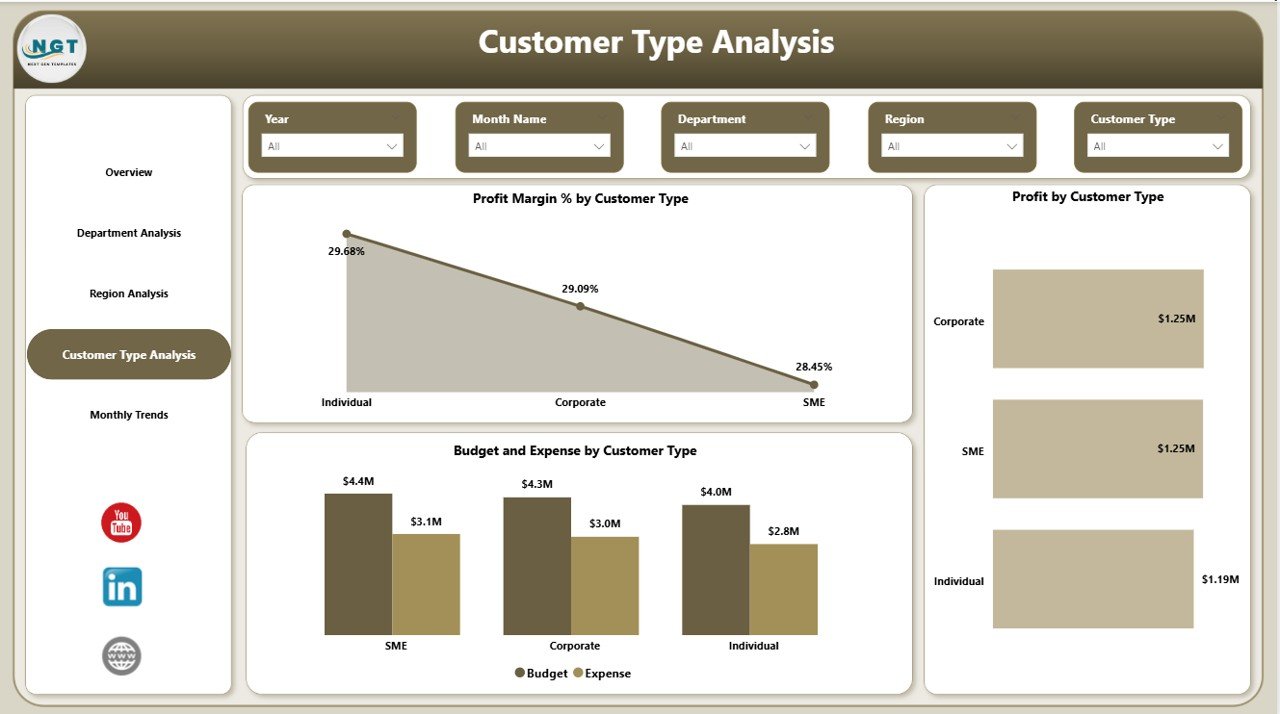
Customer Type Analysis – Which Customers Generate Value?
Not all customers contribute equally to profitability. Therefore, analyzing customer segments becomes critical.
Charts Available
- Profit Margin % by Customer Type
- Profit by Customer Type
- Budget and Expense by Customer Type
This analysis allows companies to:
- Understand customer profitability
- Adjust pricing strategies
- Improve customer targeting
Hence, organizations focus on high-value customers instead of low-margin segments.
Click to buy Finance Dashboard in Power BI
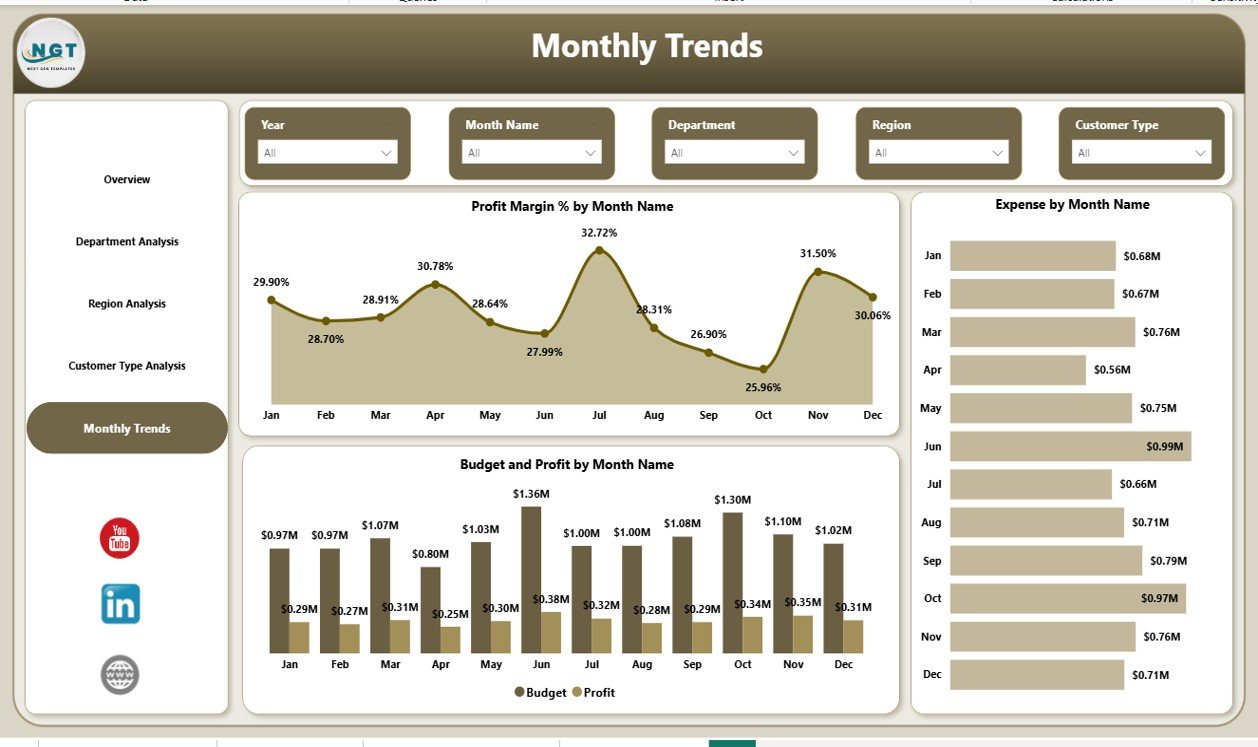
Monthly Trends – How Does Financial Performance Change Over Time?
Trend analysis helps organizations predict future performance.
Charts Included
- Profit Margin % by Month
- Expense by Month
- Budget and Profit by Month
Because financial trends reveal patterns, businesses can:
- Forecast revenue accurately
- Control seasonal expenses
- Improve financial planning
Therefore, leaders make proactive decisions instead of reactive ones.
Click to buy Finance Dashboard in Power BI
What Insights Can You Gain from a Finance Dashboard?
A well-designed dashboard delivers actionable insights quickly.
You can analyze:
- Actual vs Budget performance
- Profitability trends
- Department efficiency
- Regional growth patterns
- Customer profitability
- Expense control effectiveness
Moreover, users can drill down into details for deeper analysis.
Advantages of Finance Dashboard in Power BI
A Finance Dashboard provides multiple operational and strategic advantages.
Improved Financial Visibility
- View all financial KPIs in one place
- Reduce dependency on manual reports
- Understand performance instantly
Faster Decision-Making
- Real-time analytics improves response time
- Leaders identify problems quickly
- Data supports strategic planning
Better Budget Control
- Track spending against budgets
- Detect cost overruns early
- Improve financial discipline
Enhanced Profitability Analysis
- Identify profitable departments and regions
- Optimize pricing strategies
- Improve resource allocation
Interactive Reporting
- Use slicers and filters easily
- Explore data dynamically
- Customize analysis instantly
How Does Power BI Transform Financial Reporting?
Traditional reporting focuses on static numbers. However, Power BI converts numbers into stories.
Power BI enables:
- Automated data refresh
- Interactive visualizations
- Drill-through analysis
- Real-time dashboards
- Cross-filtering between visuals
Therefore, finance teams spend less time preparing reports and more time analyzing insights.
Who Can Benefit from a Finance Dashboard?
Many professionals use finance dashboards daily.
Finance Teams
- Monitor budgets and expenses
- Prepare management reports
- Analyze profitability
Executives & Leadership
- Review company performance
- Track financial goals
- Support strategic planning
Department Managers
- Control operational costs
- Compare department performance
- Improve efficiency
Business Analysts
- Identify trends and anomalies
- Build forecasting models
- Provide data-driven recommendations
How to Build a Finance Dashboard in Power BI?
Creating a finance dashboard requires structured planning.
Step 1: Define KPIs
Choose measurable indicators such as:
- Revenue
- Expense
- Profit Margin
- Budget Variance
Step 2: Prepare Data
Clean financial data before importing into Power BI.
Step 3: Create Data Model
Build relationships between tables like:
- Departments
- Regions
- Customers
- Dates
Step 4: Design Visualizations
Select visuals carefully:
- KPI Cards
- Bar Charts
- Trend Charts
- Comparison Charts
Step 5: Add Filters and Slicers
Enable interactive analysis.
Step 6: Publish Dashboard
Share insights through Power BI Service.
Best Practices for the Finance Dashboard in Power BI
Following best practices ensures maximum dashboard effectiveness.
Keep Layout Simple
- Avoid cluttered visuals
- Highlight key KPIs first
Use Consistent Colors
- Green for positive performance
- Red for negative variance
Focus on Business Questions
Every chart should answer a specific question.
Enable Drill-Down Analysis
Allow users to explore detailed data.
Optimize Performance
- Reduce unnecessary visuals
- Use efficient data models
Maintain Data Accuracy
Always validate financial calculations.
Common Challenges in Financial Reporting (And How Dashboards Solve Them)
Challenge 1: Manual Reporting
Teams waste hours preparing Excel reports.
Solution: Automated Power BI dashboards.
Challenge 2: Data Silos
Financial data exists in multiple systems.
Solution: Centralized data integration.
Challenge 3: Slow Decision-Making
Executives lack real-time insights.
Solution: Interactive visual analytics.
Challenge 4: Budget Overruns
Companies detect overspending too late.
Solution: Continuous monitoring dashboards.
Real-World Use Cases of Finance Dashboards
Organizations across industries rely on financial dashboards.
- Corporate finance management
- Retail performance tracking
- Manufacturing cost analysis
- Service industry profitability monitoring
- Startup financial planning
Because financial data drives every organization, dashboards remain essential tools.
How Does a Finance Dashboard Improve Strategic Planning?
Strategic planning depends on accurate financial insights.
A dashboard helps by:
- Comparing historical trends
- Identifying growth opportunities
- Measuring financial risks
- Supporting investment decisions
Therefore, companies align strategy with real financial performance.
Future of Financial Analytics with Power BI
Financial analytics continues to evolve rapidly.
Future dashboards will include:
- AI-driven insights
- Predictive analytics
- Automated anomaly detection
- Real-time forecasting
- Cloud-based collaboration
As technology advances, Power BI will become even more powerful for finance teams.
Conclusion
A Finance Dashboard in Power BI transforms financial data into actionable intelligence. Instead of reviewing static spreadsheets, organizations gain interactive insights into revenue, expenses, profit, and budget performance.
Through five analytical pages — Overview, Department Analysis, Region Analysis, Customer Type Analysis, and Monthly Trends — businesses achieve complete financial visibility.
Moreover, companies improve decision-making, strengthen budget control, and enhance profitability analysis. Therefore, implementing a finance dashboard no longer remains optional; it becomes essential for modern organizations.
When businesses combine structured data with Power BI visualization capabilities, they unlock smarter, faster, and more confident financial management.
Frequently Asked Questions (FAQs)
- What is the main purpose of a Finance Dashboard in Power BI?
A finance dashboard helps organizations monitor financial KPIs, analyze profitability, and track budgets using interactive visual analytics.
- Can small businesses use a Finance Dashboard?
Yes. Small businesses benefit greatly because dashboards simplify financial monitoring and reduce manual reporting effort.
- What KPIs should a finance dashboard include?
Common KPIs include revenue, expense, profit, profit margin, budget variance, and monthly trends.
- How often should financial dashboards update?
Ideally, dashboards should refresh daily or in real time depending on data availability.
- Is Power BI better than Excel for financial dashboards?
Power BI provides stronger visualization, automation, and scalability compared to traditional Excel reports.
- Do users need technical skills to use the dashboard?
No. Once created, users can interact with filters and visuals easily without technical expertise.
- Can Finance Dashboards support forecasting?
Yes. Power BI supports trend analysis and predictive modeling for financial forecasting.
Visit our YouTube channel to learn step-by-step video tutorials
Watch the step-by-step video tutorial:
Click to buy Finance Dashboard in Power BI