Fleet operations demand precision, cost control, and real-time visibility. However, many fleet managers still depend on scattered spreadsheets and manual reporting. As a result, they struggle to monitor fuel costs, vehicle utilization, maintenance performance, and driver efficiency effectively.
Therefore, you need a structured and dynamic performance tracking system.
The Fleet Management KPI Scorecard in Excel provides a ready-to-use solution that helps fleet managers track, analyze, and improve operational performance in one powerful workbook.
If you manage logistics fleets, transportation services, delivery vehicles, or company-owned vehicles, this scorecard will help you make smarter decisions and improve profitability.
Let us explore everything in detail.
Click to Purchases Fleet Management KPI Scorecard in Excel
What Is a Fleet Management KPI Scorecard in Excel?
A Fleet Management KPI Scorecard in Excel is a structured performance monitoring tool that tracks key fleet metrics such as:
-
Fuel efficiency
-
Vehicle utilization
-
Maintenance cost
-
Driver performance
-
Downtime
-
Operational expenses
Instead of reviewing raw data manually, you can use this scorecard to compare Actual vs Target performance and monitor trends using MTD and YTD analysis.
Because the template runs in Excel, it offers flexibility and easy customization.
Why Do Fleet Managers Need a KPI Scorecard?
Fleet management involves multiple moving parts. Vehicles operate daily. Drivers follow schedules. Fuel prices fluctuate. Maintenance costs increase.
Without KPI monitoring:
-
Fuel costs escalate.
-
Downtime increases.
-
Delivery delays occur.
-
Maintenance becomes reactive.
-
Profit margins shrink.
On the other hand, when you use a KPI scorecard:
-
You monitor performance clearly.
-
You control costs effectively.
-
You detect inefficiencies early.
-
You improve fleet productivity.
Therefore, a structured KPI scorecard becomes essential for operational success.
Click to Purchases Fleet Management KPI Scorecard in Excel
Key Features of Fleet Management KPI Scorecard in Excel
This ready-to-use template includes 4 structured worksheets, each designed to provide complete visibility.
Let us understand each sheet clearly.
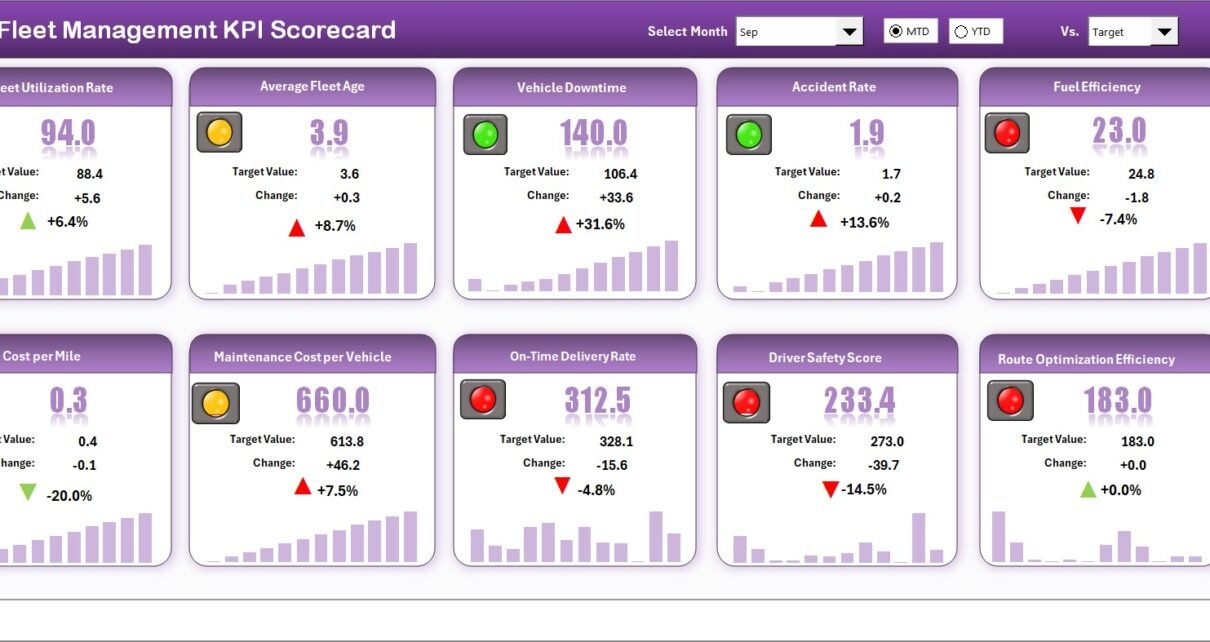
1️⃣ Scorecard Sheet – The Main Performance Dashboard
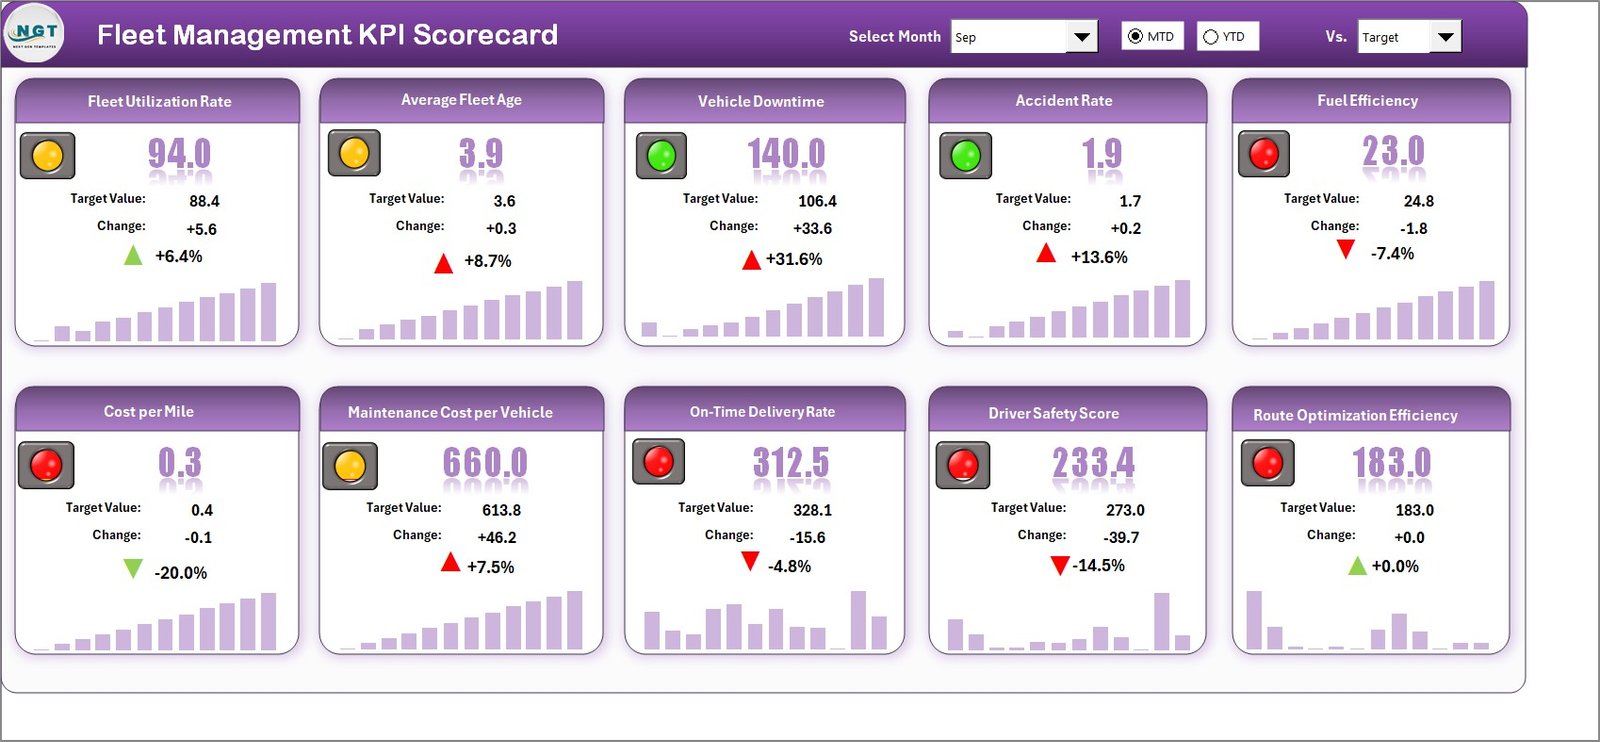
The Scorecard sheet serves as the central interface of the template.
🔹 Dropdown Menus for Flexible Analysis
You can select:
-
Month
-
MTD (Month-to-Date)
-
YTD (Year-to-Date)
As soon as you change the selection, the entire scorecard updates automatically.
Therefore, you can analyze performance for specific time periods instantly.
🔹 Actual vs Target Comparison
For each KPI, the scorecard shows:
-
Actual values
-
Target values
-
Variance or comparison percentage
This comparison helps you measure goal achievement quickly.
🔹 Visual Indicators
The scorecard uses color-coded visuals and conditional formatting to indicate performance.
-
Green indicates strong performance
-
Red indicates underperformance
Because of these visual cues, managers can detect issues at a glance.
🔹 Comprehensive KPI Overview
The Scorecard sheet displays:
-
KPI Name
-
KPI Group
-
MTD performance
-
YTD performance
-
Performance comparisons
As a result, you get complete visibility in one structured layout.
Click to Purchases Fleet Management KPI Scorecard in Excel
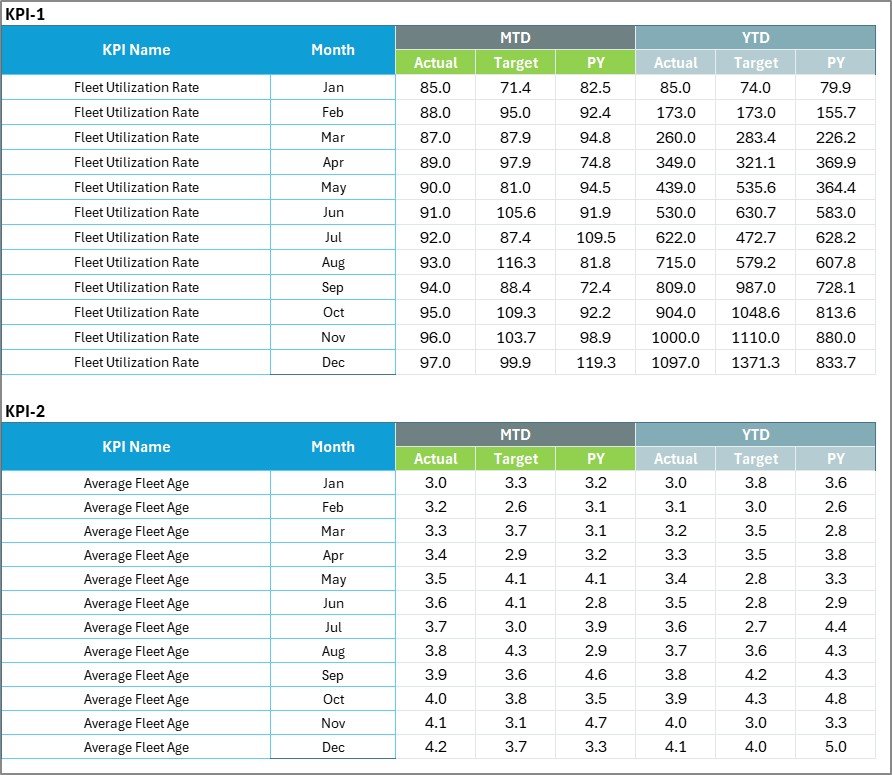
2️⃣ KPI Trend Sheet – Deep Performance Analysis
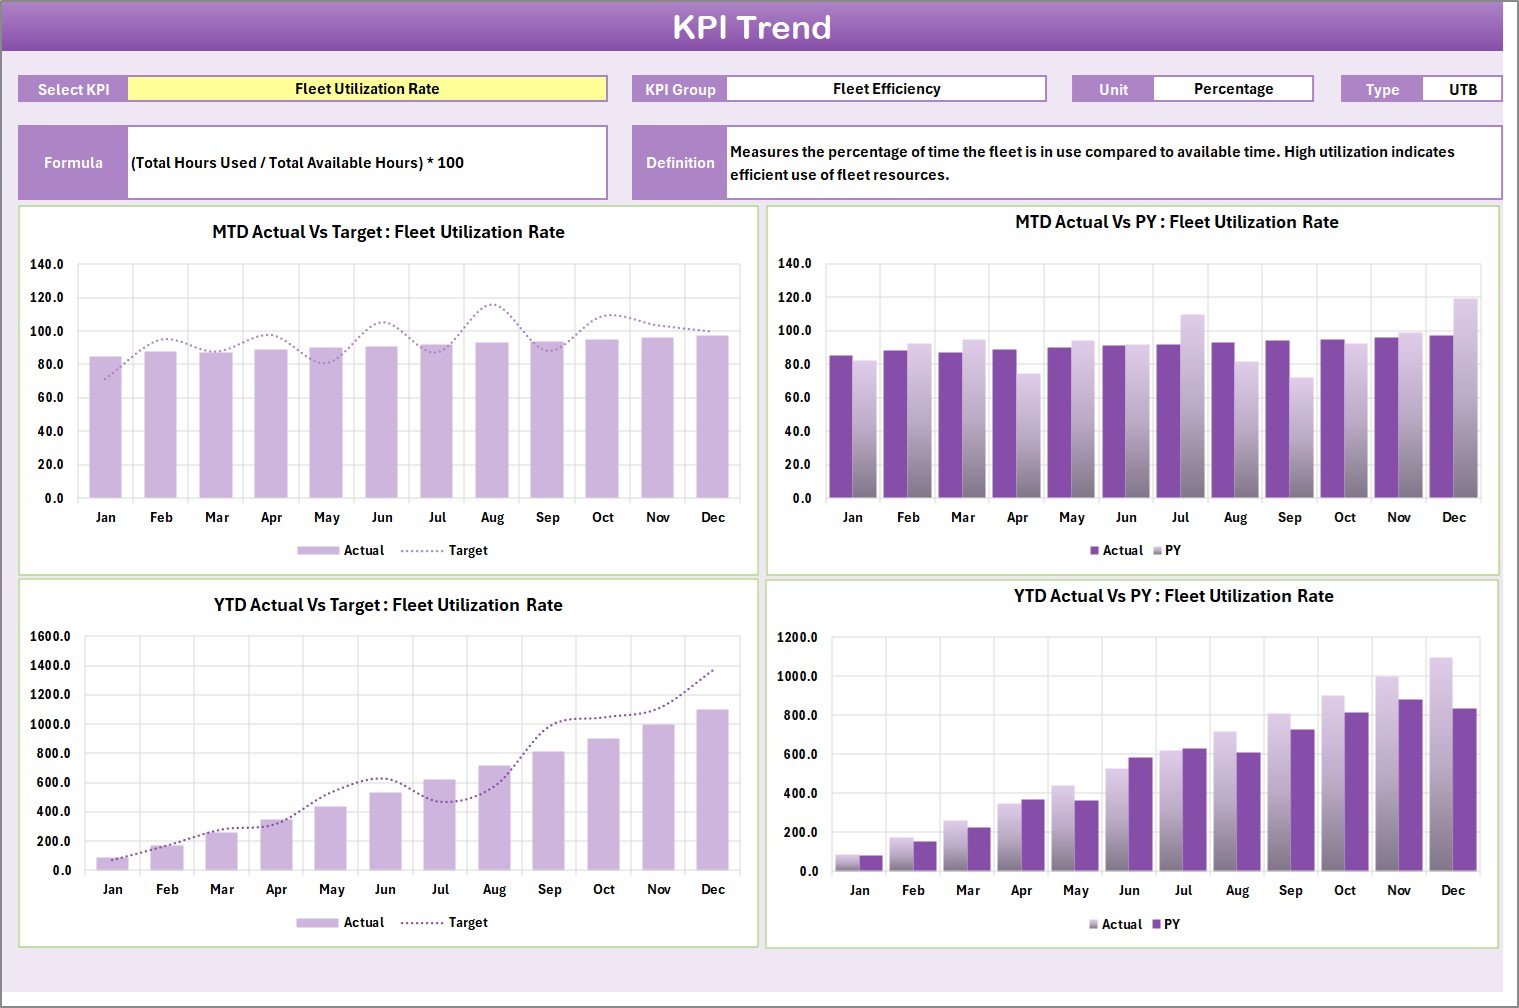
The KPI Trend sheet allows detailed analysis for individual KPIs.
How Does It Work?
You can select the KPI name from a dropdown list at cell C3.
Once selected, the sheet displays:
-
KPI Group
-
Unit of KPI
-
Type (Lower the Better or Upper the Better)
-
Formula
-
KPI Definition
Additionally, the sheet displays:
-
MTD Trend Chart (Actual, Target, PY)
-
YTD Trend Chart (Actual, Target, PY)
Because of these trend charts, you can analyze performance patterns over time.
3️⃣ Input Data Sheet – Data Entry and Updates
The Input Data sheet acts as the data foundation.
Key Functions:
-
Enter Actual KPI values
-
Enter Target values
-
Record other relevant metrics
You can update data regularly to keep the scorecard accurate.
Since the scorecard connects directly to this sheet, any update automatically reflects in the dashboard.
Click to Purchases Fleet Management KPI Scorecard in Excel
4️⃣ KPI Definition Sheet – KPI Structure and Clarity
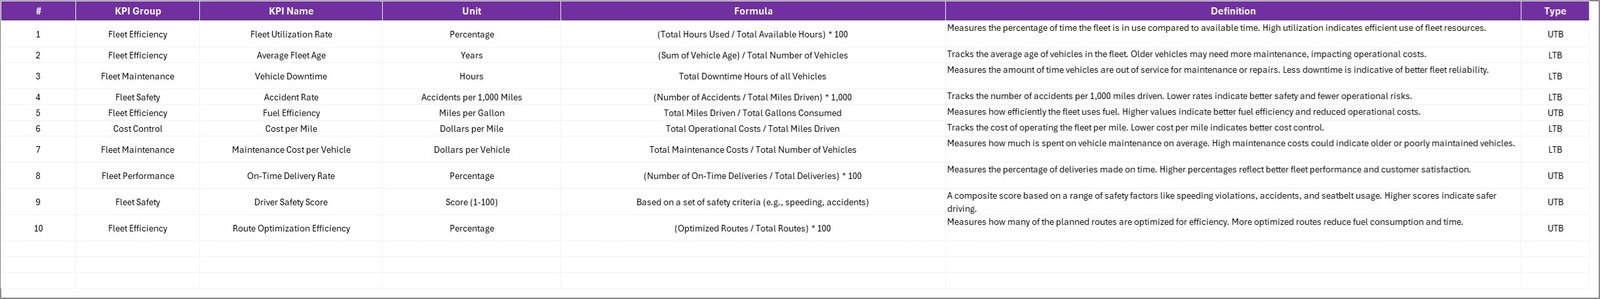
The KPI Definition sheet documents each KPI clearly.
You must enter:
-
KPI Name
-
KPI Group
-
Unit
-
Formula
-
KPI Definition
This structure ensures consistency and transparency.
Moreover, it helps teams understand how each KPI is calculated.
What KPIs Should You Track in Fleet Management?
Fleet performance depends on financial, operational, and safety metrics.
Below are common KPIs:
🚛 Operational KPIs
-
Vehicle Utilization Rate
-
On-Time Delivery Rate
-
Average Trip Duration
-
Fleet Availability
⛽ Fuel Efficiency KPIs
-
Fuel Cost per Mile
-
Average Fuel Consumption
-
Fuel Variance
🔧 Maintenance KPIs
-
Preventive Maintenance Compliance
-
Maintenance Cost per Vehicle
-
Breakdown Frequency
-
Mean Time Between Failures
👨✈ Driver Performance KPIs
-
Driver Safety Score
-
Accident Rate
-
Idle Time
-
Overtime Hours
Because you can classify KPIs as LTB or UTB, the scorecard adapts evaluation logic automatically.
Click to Purchases Fleet Management KPI Scorecard in Excel
How Does the Fleet KPI Scorecard Improve Performance?
The scorecard enhances fleet performance in several ways.
1️⃣ Real-Time Visibility
As soon as you update data, performance metrics refresh automatically.
2️⃣ Clear Target Monitoring
You can compare Actual vs Target instantly.
3️⃣ Trend Identification
Trend charts reveal performance patterns over months.
4️⃣ Cost Control
Fuel and maintenance metrics help reduce unnecessary expenses.
5️⃣ Improved Decision-Making
Visual indicators simplify complex data interpretation.
Advantages of Fleet Management KPI Scorecard in Excel
Let us explore the major benefits.
✅ Centralized Fleet Monitoring
Track all fleet KPIs in one Excel workbook.
✅ Easy Customization
Modify KPIs according to business needs.
✅ User-Friendly Interface
Dropdown menus simplify analysis.
✅ Cost-Effective Solution
You do not need expensive fleet software.
✅ Strong Performance Visualization
Conditional formatting improves clarity.
✅ Flexible Time Analysis
Switch between MTD and YTD easily.
Click to Purchases Fleet Management KPI Scorecard in Excel
Best Practices for the Fleet Management KPI Scorecard in Excel
To maximize value, follow these best practices.
⭐ Define Clear Targets
Set measurable and realistic KPI targets.
⭐ Update Data Regularly
Maintain weekly or monthly updates.
⭐ Monitor Underperforming KPIs
Focus on red indicators first.
⭐ Review Trends Monthly
Analyze patterns in the KPI Trend sheet.
⭐ Limit KPI Count
Track 10–20 high-impact KPIs instead of too many.
⭐ Align KPIs with Business Goals
Ensure KPIs support operational efficiency and cost reduction.
How Does This Scorecard Increase Fleet Profitability?
Profitability improves when:
-
Fuel efficiency increases
-
Maintenance becomes preventive
-
Vehicle downtime decreases
-
Driver performance improves
-
Delivery efficiency rises
The scorecard highlights weak areas quickly. Therefore, managers can implement corrective actions early.
Click to Purchases Fleet Management KPI Scorecard in Excel
Who Should Use the Fleet Management KPI Scorecard?
This template benefits:
-
Fleet Managers
-
Logistics Companies
-
Transportation Businesses
-
Delivery Service Providers
-
Operations Managers
-
Financial Controllers
Whether you manage small fleets or large transportation networks, this scorecard provides valuable insights.
Why Choose Excel for Fleet KPI Monitoring?
Many companies invest in complex fleet management software. However, Excel offers:
-
Flexibility
-
Easy customization
-
Low cost
-
Offline accessibility
-
Quick setup
Therefore, Excel remains a practical solution for KPI tracking.
Click to Purchases Fleet Management KPI Scorecard in Excel
Conclusion: Should You Use Fleet Management KPI Scorecard in Excel?
If you want better visibility, stronger cost control, and improved operational efficiency, then yes — you should use this scorecard.
It provides:
-
Structured KPI tracking
-
Actual vs Target comparison
-
MTD and YTD analysis
-
Trend monitoring
-
Clear visual indicators
Most importantly, it helps you manage your fleet with data-driven confidence.
Therefore, if your goal is to optimize fleet operations and increase profitability, the Fleet Management KPI Scorecard in Excel offers a simple yet powerful solution.
Click to Purchases Fleet Management KPI Scorecard in Excel
Frequently Asked Questions (FAQs)
1️⃣ What is a Fleet Management KPI Scorecard in Excel?
It is an Excel-based performance tracking tool that monitors fleet KPIs such as fuel efficiency, maintenance cost, and utilization.
2️⃣ Can I customize KPIs in this scorecard?
Yes. You can modify KPIs in the KPI Definition sheet.
3️⃣ Does the scorecard support MTD and YTD analysis?
Yes. You can analyze both Month-to-Date and Year-to-Date performance.
4️⃣ How do visual indicators work?
Conditional formatting uses color-coded visuals to indicate performance status.
5️⃣ How often should I update the scorecard?
You should update it weekly or monthly for accurate monitoring.
6️⃣ Is this template suitable for small fleets?
Yes. It works for both small and large fleet operations.
7️⃣ Can I track previous year performance?
Yes. The trend sheet allows comparison of Actual, Target, and Previous Year data.
Click to Purchases Fleet Management KPI Scorecard in Excel
Visit our YouTube channel to learn step-by-step video tutorials