The flooring and tiles industry moves fast. Customer taste changes quickly. Moreover, builders demand faster delivery. At the same time, raw material prices rise and fall. Therefore, business owners must track performance daily.
However, many flooring distributors and tile manufacturers still depend on scattered Excel sheets. As a result, they miss profit gaps. They fail to monitor sales trends. They struggle to compare actual performance with targets.
So, how can you monitor revenue, margins, inventory, dealer performance, and monthly growth in one place?
The answer is simple.
Click to Purchases Flooring and Tiles KPI Dashboard in Excel
You need a Flooring and Tiles KPI Dashboard in Excel.
In this detailed guide, you will learn:
-
What a Flooring and Tiles KPI Dashboard in Excel is
-
Why flooring businesses need it
-
Detailed explanation of all 7 worksheets
-
Important KPIs for flooring and tiles companies
-
Advantages of Flooring and Tiles KPI Dashboard in Excel
-
Best Practices for the Flooring and Tiles KPI Dashboard
-
Frequently Asked Questions with Answers
Let us explore everything step by step.
What Is a Flooring and Tiles KPI Dashboard in Excel?
A Flooring and Tiles KPI Dashboard in Excel is a ready-to-use performance tracking tool. It helps tile manufacturers, flooring retailers, distributors, and wholesalers monitor key metrics in one structured file.
Instead of checking multiple sheets, you can:
-
Track MTD (Month-to-Date) performance
-
Monitor YTD (Year-to-Date) progress
-
Compare Actual vs Target
-
Compare Actual vs Previous Year
-
Analyze trends visually through charts
Moreover, you can use simple dropdowns to switch months. As a result, the dashboard updates automatically.
Therefore, this tool saves time and improves decision-making.
Why Does the Flooring and Tiles Industry Need a KPI Dashboard?
The flooring and tiles business involves many moving parts. For example:
-
Multiple product categories (ceramic, vitrified, marble, wooden flooring)
-
Different dealer networks
-
Bulk orders from builders
-
Seasonal demand spikes
-
Credit-based sales
Because of this complexity, business owners often lose visibility.
However, when you use a KPI dashboard:
-
You gain clear financial control.
-
You track sales team performance.
-
You monitor inventory turnover.
-
You improve cash flow tracking.
-
You detect underperforming product lines early.
Therefore, a KPI dashboard helps you take action quickly instead of reacting late.
What Are the Key Features of the Flooring and Tiles KPI Dashboard in Excel?
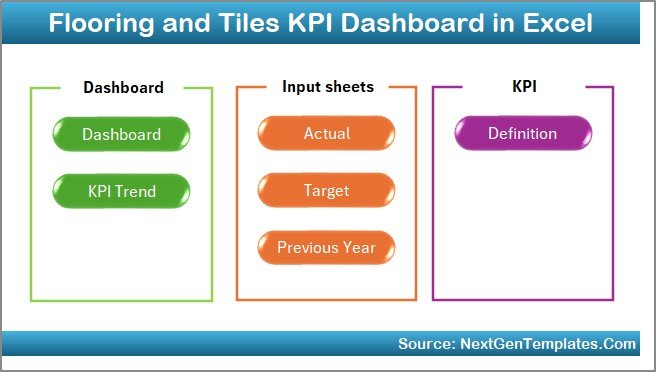
This dashboard contains 7 structured worksheets. Each sheet plays a specific role. Let us understand each one clearly.
1️⃣ Home Sheet – Easy Navigation Hub
The Home sheet works as the index page.
Here, you get 6 navigation buttons. Therefore, you can jump to any worksheet instantly.
This feature improves user experience. Moreover, it saves time. Instead of scrolling through sheets, you simply click a button.
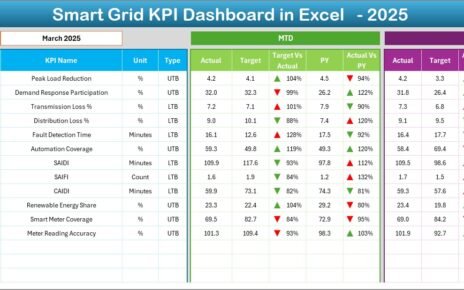
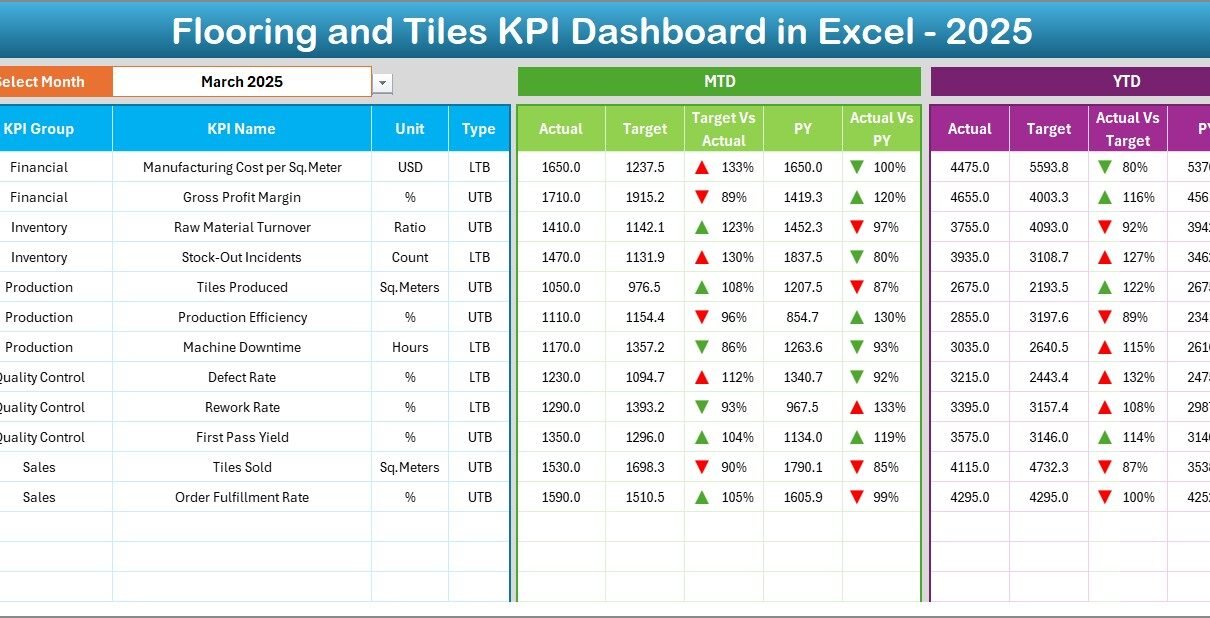
2️⃣ Dashboard Sheet – Main Performance Overview
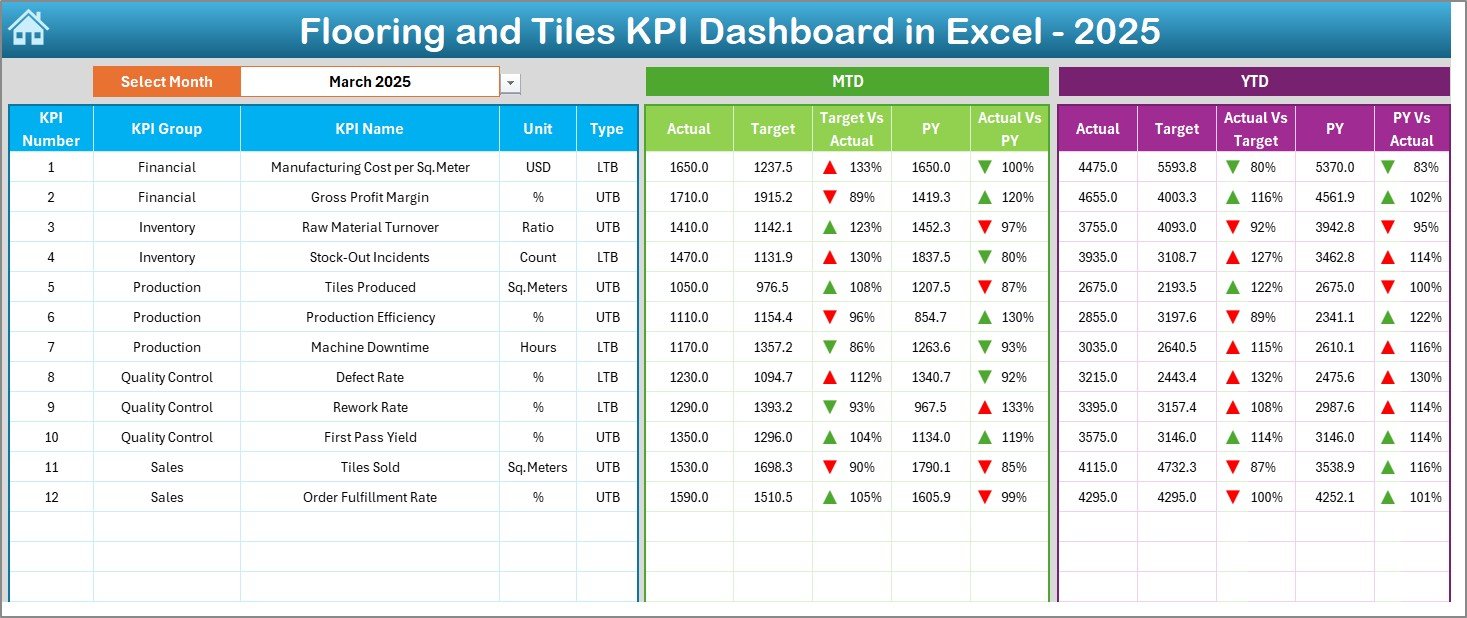
This sheet acts as the heart of the entire dashboard.
What Can You Do Here?
-
Select the month from cell D3
-
View all KPIs in one place
-
Compare performance instantly
What Does It Show?
For each KPI, you can see:
-
MTD Actual
-
MTD Target
-
MTD Previous Year
-
Target vs Actual comparison
-
Previous Year vs Actual comparison
Additionally, the dashboard displays:
-
YTD Actual
-
YTD Target
-
YTD Previous Year
-
YTD comparisons
The dashboard uses conditional formatting arrows:
-
🔼 Green arrow for good performance
-
🔽 Red arrow for poor performance
Therefore, you understand performance in seconds.
3️⃣ KPI Trend Sheet – Performance Over Time
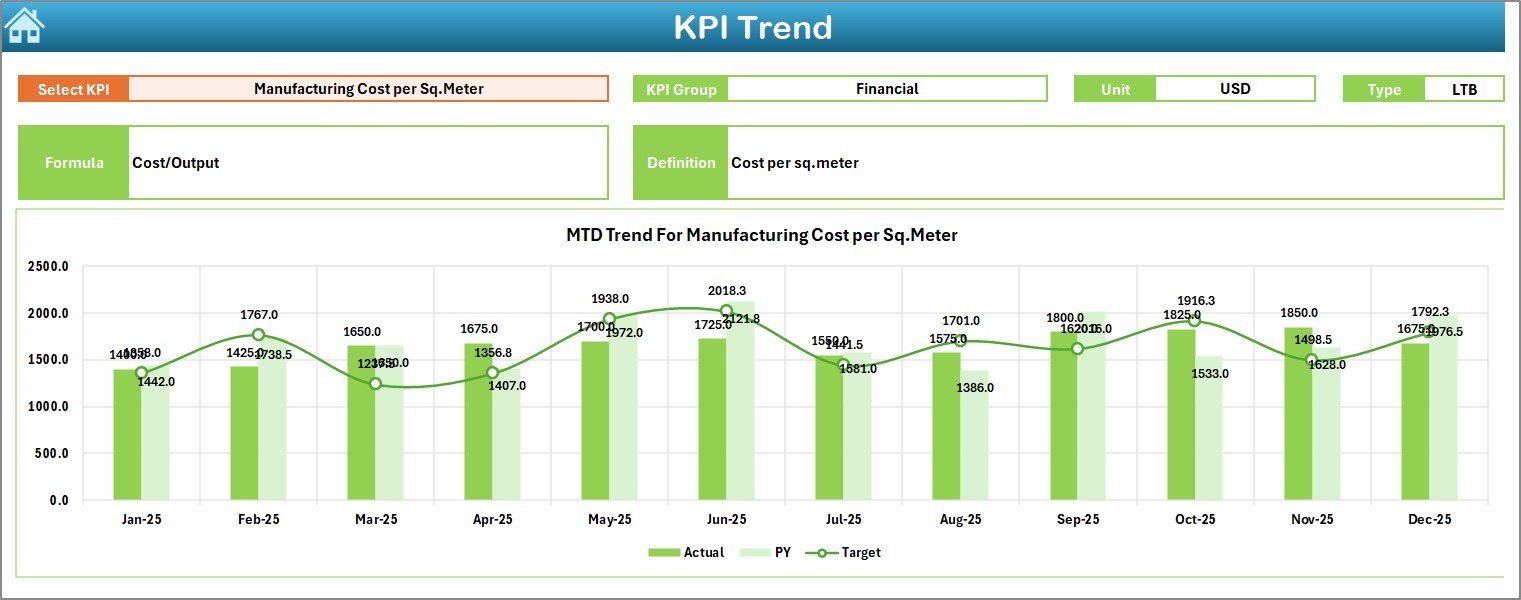
Trends matter. One month’s performance does not tell the full story.
In this sheet:
-
Select the KPI name from dropdown in C3
-
View KPI Group
-
View KPI Unit
-
View KPI Type (UTB or LTB)
-
View Formula
-
View Definition
Moreover, the sheet shows:
-
MTD Trend Chart
-
YTD Trend Chart
-
Actual vs Target vs Previous Year comparison
Therefore, you can analyze whether performance improves or declines over time.
4️⃣ Actual Numbers Input Sheet – Data Entry Section
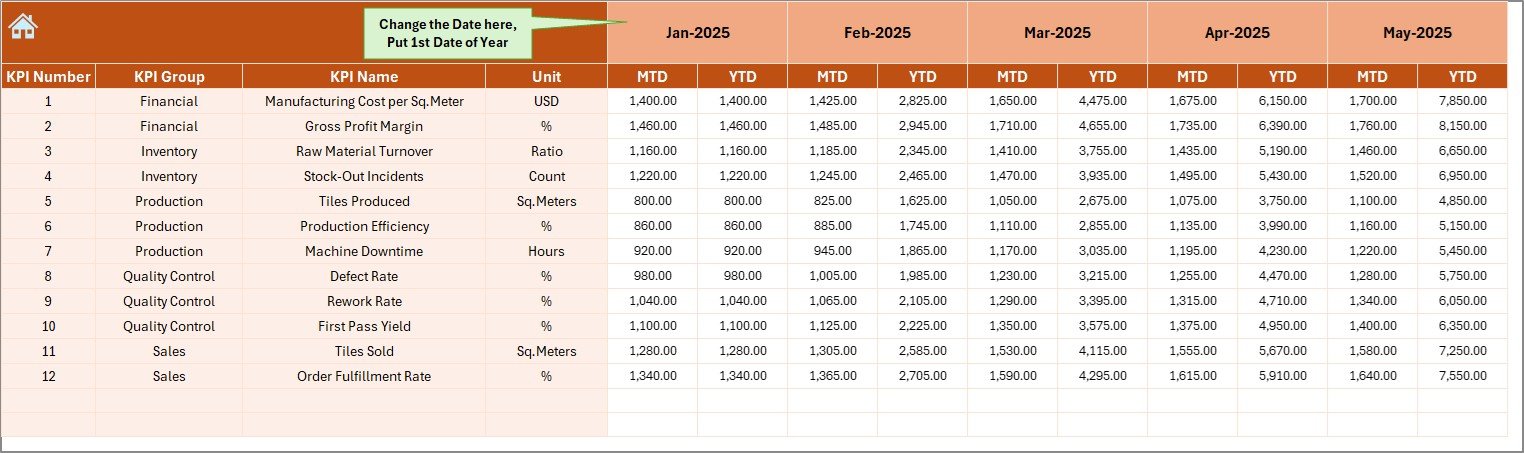
This sheet allows you to enter actual performance data.
How It Works:
-
Enter first month of the year in E1
-
Select month
-
Input MTD and YTD actual values
Because of structured design, the dashboard automatically pulls numbers from this sheet.
Therefore, you only update data once.
5️⃣ Target Sheet – Goal Setting Area
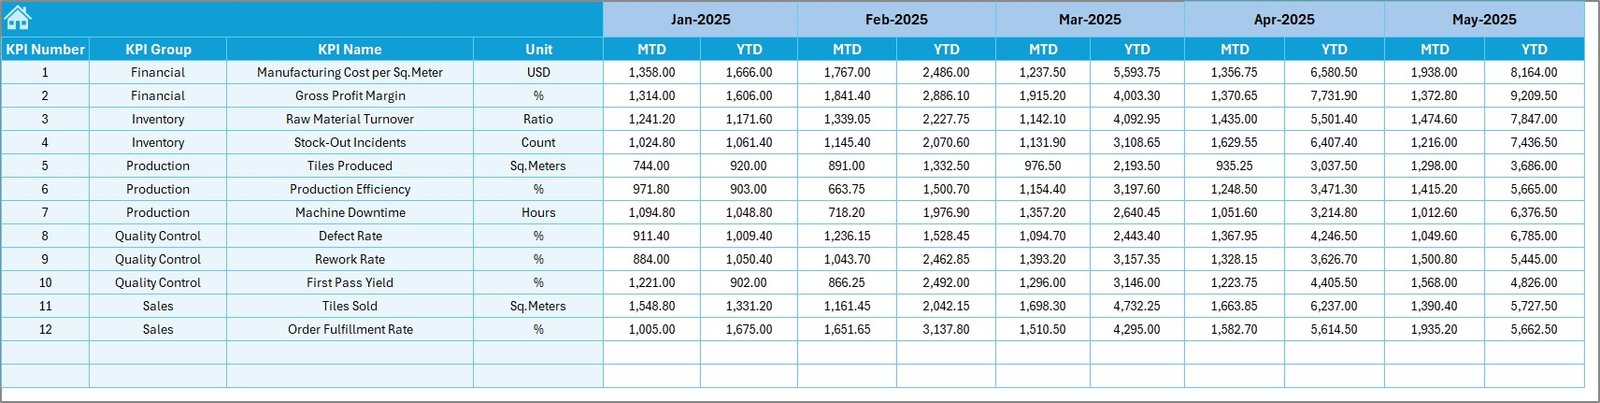
In this sheet, you enter:
-
Monthly MTD Targets
-
YTD Targets
When you set realistic targets, you guide your sales and operations team clearly.
Moreover, target tracking improves accountability.
6️⃣ Previous Year Number Sheet – Historical Comparison

Growth analysis becomes powerful when you compare with last year.
Here, you enter previous year numbers.
After that, the dashboard calculates:
-
Growth percentage
-
Performance gap
-
Improvement trend
Therefore, you understand whether your business grows or declines.
Click to Purchases Flooring and Tiles KPI Dashboard in Excel
7️⃣ KPI Definition Sheet – KPI Structure and Logic

This sheet contains:
-
KPI Name
-
KPI Group
-
Unit
-
Formula
-
Definition
Because of this structured approach, your team understands:
-
What each KPI measures
-
How it calculates
-
Why it matters
Therefore, confusion reduces and clarity improves.
Which Important KPIs Should Flooring and Tiles Businesses Track?
You should track both financial and operational KPIs.
Financial KPIs
-
Revenue Growth %
-
Gross Profit Margin %
-
Net Profit Margin %
-
Average Selling Price per Sq. Ft.
-
Cost per Unit
Sales KPIs
-
Sales Target Achievement %
-
Dealer Growth Rate
-
Order Conversion Rate
-
Sales per Sales Executive
Inventory KPIs
-
Inventory Turnover Ratio
-
Stock Aging Days
-
Dead Stock Percentage
-
Order Fulfillment Rate
Operational KPIs
-
Production Efficiency %
-
Delivery Timeliness %
-
Return Rate %
-
Breakage Percentage
By tracking these KPIs, you improve control and profitability.
How Does This Dashboard Improve Business Decisions?
When you use this dashboard:
-
You identify low-margin products quickly.
-
You compare dealer performance easily.
-
You track monthly sales growth clearly.
-
You monitor cost fluctuations regularly.
-
You adjust targets based on trends.
Therefore, decision-making becomes data-driven.
Advantages of Flooring and Tiles KPI Dashboard in Excel
Now let us discuss the main advantages.
✅ Centralized Performance Tracking
You see all KPIs in one place. Therefore, you reduce reporting confusion.
✅ Easy Month Selection
With a simple dropdown, you switch months instantly.
✅ Clear Visual Indicators
Conditional formatting arrows provide quick understanding.
✅ Trend Analysis
You track both MTD and YTD performance.
✅ Historical Comparison
Previous year comparison improves growth strategy.
✅ User-Friendly Structure
Navigation buttons make the dashboard simple.
✅ Customizable
You can modify KPIs according to business needs.
Best Practices for the Flooring and Tiles KPI Dashboard
Click to Purchases Flooring and Tiles KPI Dashboard in Excel
To get maximum value, follow these best practices:
🔹 Update Data Regularly
Enter actual numbers at the end of each month.
🔹 Set Realistic Targets
Set achievable but challenging targets.
🔹 Review KPIs Weekly
Do not wait until year-end. Review progress frequently.
🔹 Train Your Team
Ensure your team understands each KPI clearly.
🔹 Use Trend Analysis for Strategy
If a KPI declines for 3 consecutive months, take action immediately.
🔹 Avoid Data Entry Errors
Double-check numbers before finalizing reports.
How Can You Customize This Dashboard?
You can:
-
Add new KPIs
-
Modify formulas
-
Add region-wise filters
-
Include product category slicers
-
Add dealer-level tracking
Because Excel allows flexibility, you can expand the dashboard easily.
Who Can Benefit from Flooring and Tiles KPI Dashboard?
This dashboard benefits:
-
Tile manufacturers
-
Flooring wholesalers
-
Retail showroom owners
-
Building material distributors
-
Construction supply businesses
-
Regional sales managers
Therefore, anyone in the flooring supply chain can use it.
Conclusion
The flooring and tiles business requires constant monitoring. Market competition increases daily. Moreover, raw material costs fluctuate. Therefore, business owners must track performance clearly.
The Flooring and Tiles KPI Dashboard in Excel provides:
-
Structured tracking
-
Clear comparisons
-
Visual performance indicators
-
Trend analysis
-
Historical comparison
As a result, you gain control, clarity, and confidence.
If you want to improve profitability and performance, this dashboard gives you the right system.
Frequently Asked Questions with Answers
1. What is a Flooring and Tiles KPI Dashboard in Excel?
It is a ready-to-use Excel template that tracks sales, profit, inventory, and operational KPIs in one file.
2. Can I customize the KPIs?
Yes. You can add, modify, or remove KPIs based on your business model.
3. Does this dashboard support monthly comparison?
Yes. You can select any month and compare MTD and YTD data.
4. How does it compare with previous year performance?
You enter last year’s data in the Previous Year sheet. The dashboard calculates growth automatically.
5. Do I need advanced Excel skills to use it?
No. The dashboard uses simple dropdowns and structured input sheets.
6. Can small tile retailers use this dashboard?
Yes. Small, medium, and large businesses can use it.
7. How often should I update the dashboard?
You should update it monthly for accurate tracking.
Visit our YouTube channel to learn step-by-step video tutorials