The floriculture industry grows rapidly across the world. Growers produce roses, lilies, orchids, carnations, and many other flowers for retail, export, and event markets. However, many businesses still track sales and cost in scattered Excel files. As a result, owners struggle to monitor revenue trends, profit margins, regional demand, and farm performance.
So, how can you track revenue, target sales, cost, and profit across flower types, farms, regions, and months in one powerful system?
The answer is simple.
Click to Purchases Floriculture Dashboard in Excel
You need a Floriculture Dashboard in Excel.
In this detailed guide, you will learn:
-
What a Floriculture Dashboard in Excel is
-
Why flower businesses need it
-
Detailed explanation of all 5 dashboard pages
-
How the data sheet supports analysis
-
Advantages of Floriculture Dashboard in Excel
-
Best Practices for the Floriculture Dashboard
-
Frequently Asked Questions with Answers
Let’s explore everything step by step.
🌼 What Is a Floriculture Dashboard in Excel?
A Floriculture Dashboard in Excel is a ready-to-use analytical tool designed to monitor and manage flower business performance.
It collects sales, target, cost, and profit data into one structured workbook. Therefore, you can track financial and operational metrics without switching between multiple sheets.
Instead of manually calculating numbers every month, you can:
-
Monitor total revenue
-
Compare target vs actual sales
-
Analyze profit margins
-
Identify top-performing flower types
-
Evaluate farm performance
-
Track regional growth
As a result, you gain better control over your floriculture business.
🌷 Why Does a Floriculture Business Need a Dashboard?
Many flower businesses face common challenges. For example:
-
Seasonal demand changes quickly
-
Flower prices fluctuate
-
Transportation costs increase
-
Farm productivity varies
-
Managers struggle to compare regions
Therefore, business owners need real-time visibility.
A Floriculture Dashboard in Excel helps you:
-
Make faster decisions
-
Reduce unnecessary costs
-
Increase profit margins
-
Identify high-demand flowers
-
Improve sales channel performance
Moreover, Excel provides flexibility and customization. You can adjust KPIs, charts, and filters according to your business model.
📊 Structure of the Floriculture Dashboard in Excel
This dashboard includes 5 analytical pages, along with a Data Sheet and Support Sheet.
Additionally, the Page Navigator on the left side allows smooth navigation across pages. Therefore, users can switch between views easily.
Let us examine each page in detail.
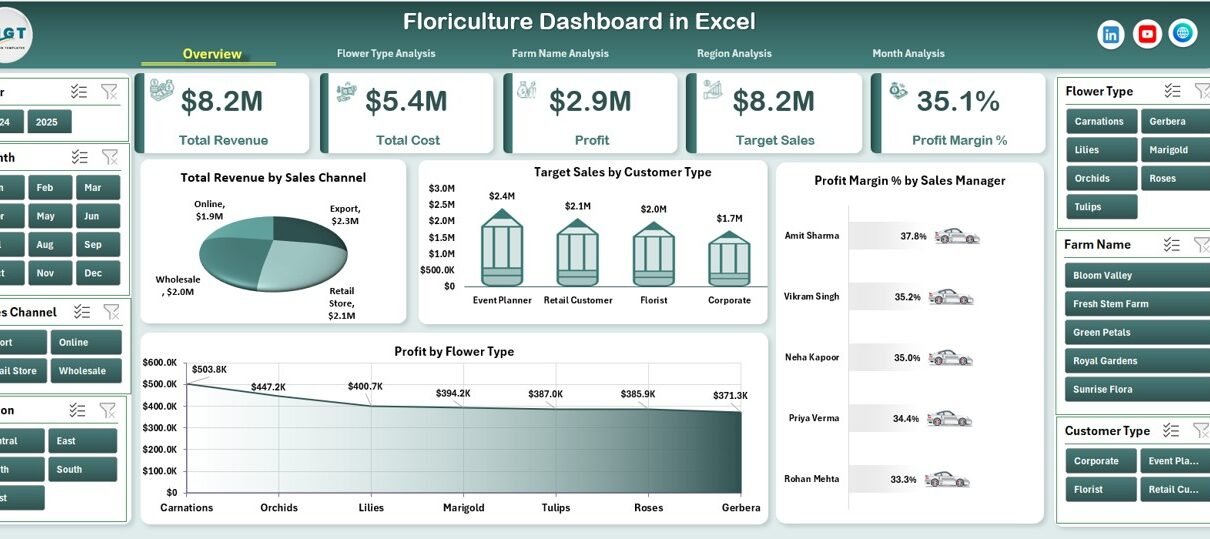
🌸 1️⃣ Overview Page – How Can You Track Overall Floriculture Performance?
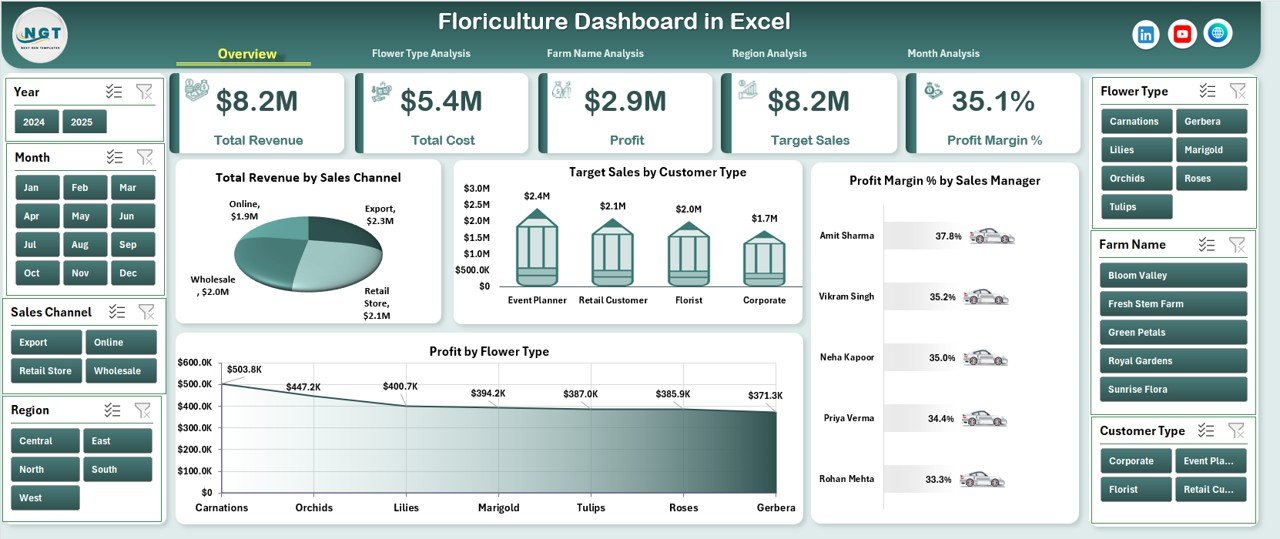
The Overview Page serves as the main dashboard. It provides a complete summary of business performance.
Key Elements:
✅ Right-Side Slicer
Click to Purchases Floriculture Dashboard in Excel
The slicer allows users to filter data by:
-
Month
-
Region
-
Flower Type
-
Sales Channel
-
Sales Manager
Therefore, you can instantly customize the dashboard view.
✅ KPI Cards
The dashboard includes 4 KPI cards such as:
-
Total Revenue
-
Total Cost
-
Total Profit
-
Profit Margin %
These cards help users understand the financial health of the business at a glance.
📈 Charts on Overview Page
The Overview page contains four major charts:
1. Total Revenue by Sales Channel
This chart helps you identify which sales channel generates the highest revenue.
For example:
-
Wholesale
-
Retail
-
Export
-
Online
Therefore, you can invest more in profitable channels.
2. Target Sales by Customer Type
This chart compares targets across:
-
Event Planners
-
Retail Shops
-
Supermarkets
-
Export Buyers
As a result, you can evaluate customer category performance.
3. Profit Margin % by Sales Manager
This chart helps management compare performance among sales managers.
If one manager shows higher margin, you can analyze their strategy and replicate it.
4. Profit by Flower Type
This chart highlights which flowers generate the highest profit.
For example:
-
Roses may generate higher revenue
-
Orchids may generate higher margin
Therefore, you can balance volume and profitability.
🌺 2️⃣ Flower Type Analysis – Which Flowers Generate the Highest Profit?
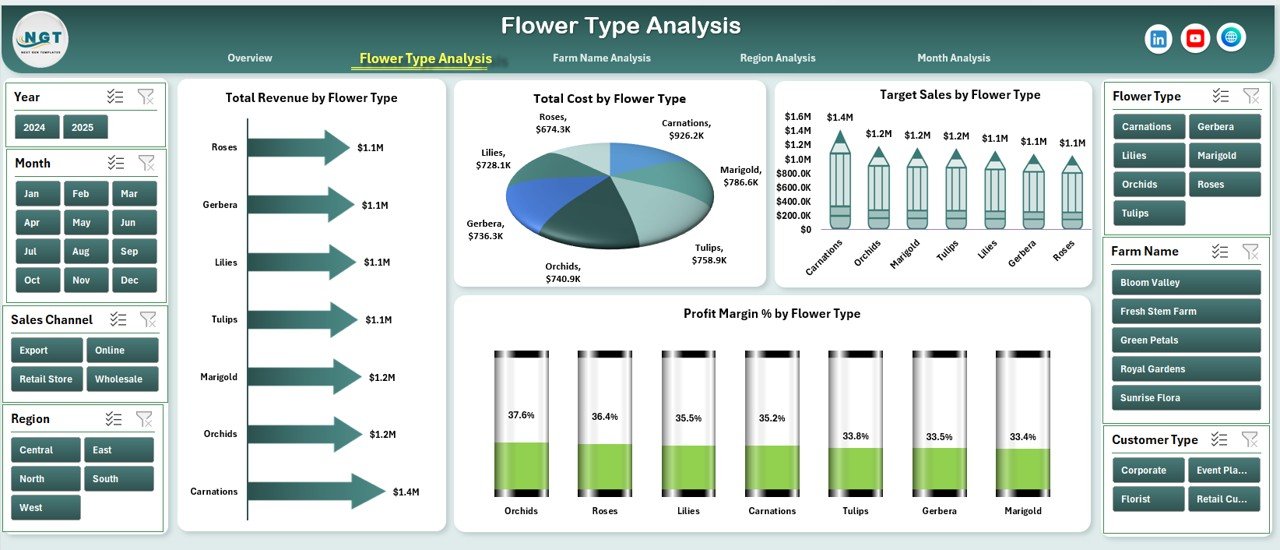
The Flower Type Analysis page focuses entirely on flower performance.
Right-Side Slicer Available
You can filter by:
-
Month
-
Region
-
Farm
-
Sales Channel
Charts on Flower Type Page
🌼 Total Revenue by Flower Type
This chart helps identify top-selling flowers.
🌼 Target Sales by Flower Type
This chart compares actual performance against target.
🌼 Profit Margin % by Flower Type
This chart highlights high-margin flowers.
🌼 Total Cost by Flower Type
This chart reveals production and operational costs.
Therefore, you can decide which flowers to promote more aggressively.
🌾 3️⃣ Farm Name Analysis – Which Farm Performs the Best?
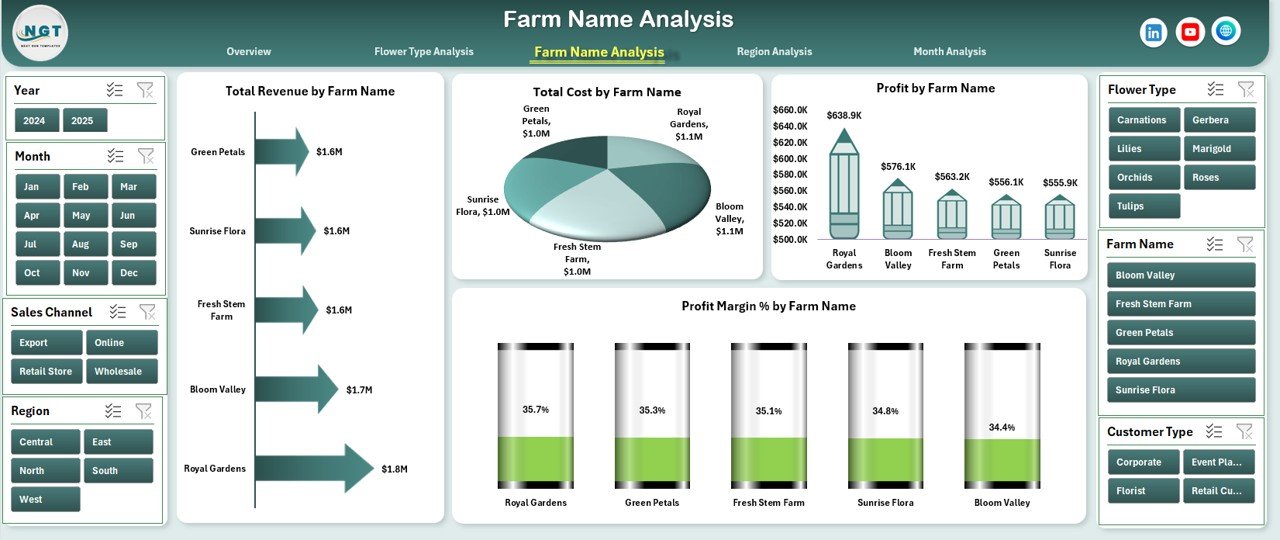
Many floriculture businesses operate multiple farms. Therefore, farm comparison becomes essential.
Available Slicer
Users can filter by:
-
Flower Type
-
Month
-
Region
Charts on Farm Analysis Page
🌱 Total Revenue by Farm Name
This chart shows revenue contribution from each farm.
🌱 Profit by Farm Name
This chart helps identify profitable farms.
🌱 Profit Margin % by Farm Name
This chart measures operational efficiency.
🌱 Total Cost by Farm Name
This chart tracks cost control performance.
As a result, management can identify underperforming farms and take corrective action.
🌍 4️⃣ Region Analysis – Which Region Drives Maximum Growth?
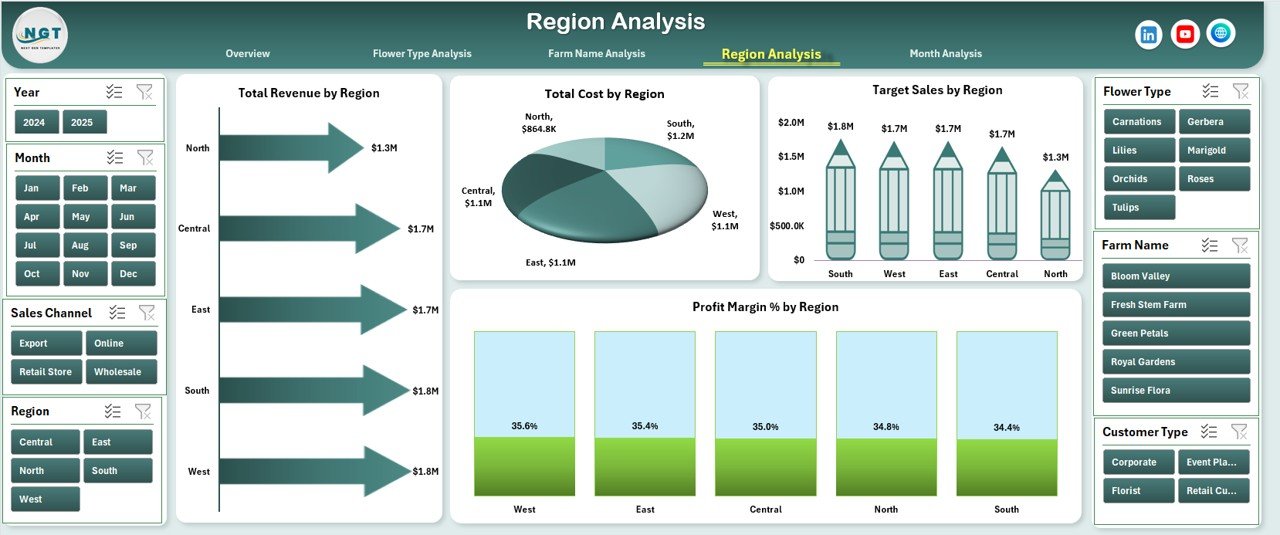
Regional demand differs significantly. Therefore, analyzing regions helps improve distribution planning.
Right-Side Slicer Available
Filters include:
-
Month
-
Flower Type
-
Farm
-
Sales Channel
Charts on Region Page
Click to Purchases Floriculture Dashboard in Excel
🌎 Total Revenue by Region
This chart shows top-performing regions.
🌎 Target Sales by Region
This chart helps compare actual vs target.
🌎 Profit Margin % by Region
This chart identifies high-margin markets.
🌎 Total Cost by Region
This chart tracks logistics and distribution cost.
Therefore, businesses can optimize supply chain strategies.
📅 5️⃣ Month Analysis – How Does Seasonality Impact Floriculture Sales?
Floriculture strongly depends on seasonality.
For example:
-
Valentine’s Day increases rose demand
-
Wedding season increases orchid sales
-
Festival season increases marigold sales
Therefore, the Month Analysis page becomes crucial.
Charts Included:
-
Total Revenue by Month
-
Profit by Month
-
Total Cost by Month
This analysis helps businesses plan production and inventory effectively.
📄 Data Sheet – What Data Does the Dashboard Use?
The Data Sheet stores structured transactional data such as:
-
Invoice Date
-
Month
-
Region
-
Farm Name
-
Flower Type
-
Sales Channel
-
Customer Type
-
Sales Manager
-
Target Sales
-
Actual Revenue
-
Total Cost
-
Profit
-
Profit Margin %
Because the dashboard uses Pivot Tables and Pivot Charts, it automatically updates when you refresh the data.
⚙ Support Sheet – How Does It Help?
The Support Sheet stores:
-
Lookup lists
-
KPI definitions
-
Target values
-
Calculation logic
-
Data validation references
Therefore, the dashboard maintains consistency and accuracy.
🌷 Advantages of Floriculture Dashboard in Excel
Using this dashboard provides multiple benefits.
✅ 1. Centralized Data Management
You can manage all performance metrics in one file.
✅ 2. Real-Time Performance Tracking
You can monitor revenue and profit instantly.
✅ 3. Improved Decision-Making
You can identify trends quickly and adjust strategies.
✅ 4. Enhanced Farm Comparison
You can evaluate farm efficiency easily.
✅ 5. Better Regional Planning
You can optimize logistics and marketing.
✅ 6. Clear Visualization
You can understand business performance without complex reports.
🌼 Best Practices for the Floriculture Dashboard
To get the best results, follow these practices:
✔ Maintain Clean Data
Always remove duplicate entries and blank rows.
✔ Update Data Regularly
Refresh the dashboard weekly or monthly.
✔ Use Structured Tables
Convert raw data into Excel Tables.
✔ Monitor High-Margin Flowers
Focus marketing efforts on profitable flowers.
✔ Compare Targets Frequently
Click to Purchases Floriculture Dashboard in Excel
Review performance against targets every month.
✔ Track Seasonal Trends
Use historical data to plan production.
🌺 How Can You Customize the Floriculture Dashboard?
You can:
-
Add new KPI cards
-
Include new slicers
-
Add export analysis
-
Include vendor cost analysis
-
Create drill-down reports
Therefore, the dashboard adapts to your business needs.
🌸 Conclusion
The Floriculture Dashboard in Excel provides a complete analytical solution for flower businesses. It tracks revenue, cost, profit, farm performance, regional growth, and monthly trends in one interactive system.
Moreover, it simplifies decision-making. Instead of analyzing multiple sheets, you can monitor everything in one place.
If you want to grow your flower business strategically, you should implement this dashboard today.
❓ Frequently Asked Questions with Answers
1. What is a Floriculture Dashboard in Excel?
It is an interactive Excel-based reporting tool that tracks sales, cost, profit, and targets in flower businesses.
2. Can I customize the dashboard?
Yes. You can modify KPIs, charts, and slicers.
3. Does this dashboard use Pivot Tables?
Yes. It uses Pivot Tables and Pivot Charts for dynamic analysis.
4. Can small floriculture farms use this dashboard?
Yes. Both small and large flower businesses can use it.
5. How often should I update the data?
You should update data weekly or monthly.
6. Can I track export sales?
Yes. You can analyze export sales by region and channel.
7. Does it require advanced Excel skills?
No. Basic Excel knowledge helps you operate it easily.
Visit our YouTube channel to learn step-by-step video tutorials