In today’s fast-moving food industry, maintaining consistent quality, productivity, and profitability requires more than just experience—it demands data-driven decision-making. Whether you manage a large-scale production plant or a small processing unit, you must know exactly how your processes perform each day. That’s where the Food Manufacturing KPI Scorecard in Excel comes in.
This ready-to-use Excel template transforms your raw performance data into meaningful insights. It helps managers, production supervisors, and quality teams track every critical KPI—ensuring the entire manufacturing process stays on target.
Click to Purchases Food Manufacturing KPI Scorecard in Excel
🧠 What Is a Food Manufacturing KPI Scorecard in Excel?
A Food Manufacturing KPI Scorecard in Excel is a structured tool that consolidates all your key performance indicators (KPIs) into one interactive dashboard. It helps you measure performance, identify trends, and spot improvement opportunities in real time—without requiring any expensive software.
The scorecard lets you:
-
Compare actual performance vs targets
-
Track MTD (Month-to-Date) and YTD (Year-to-Date) results
-
View KPI trends over time
-
Analyze department-wise and process-wise performance
-
Use visual cues (green/red icons, color codes, trend charts) to evaluate results instantly
This Excel-based tool ensures every stakeholder—from production to finance—gets a unified performance view.
Click to Purchases Food Manufacturing KPI Scorecard in Excel
⚙️ Structure of the Food Manufacturing KPI Scorecard Template
The template includes four main worksheet tabs, each designed for specific functions.
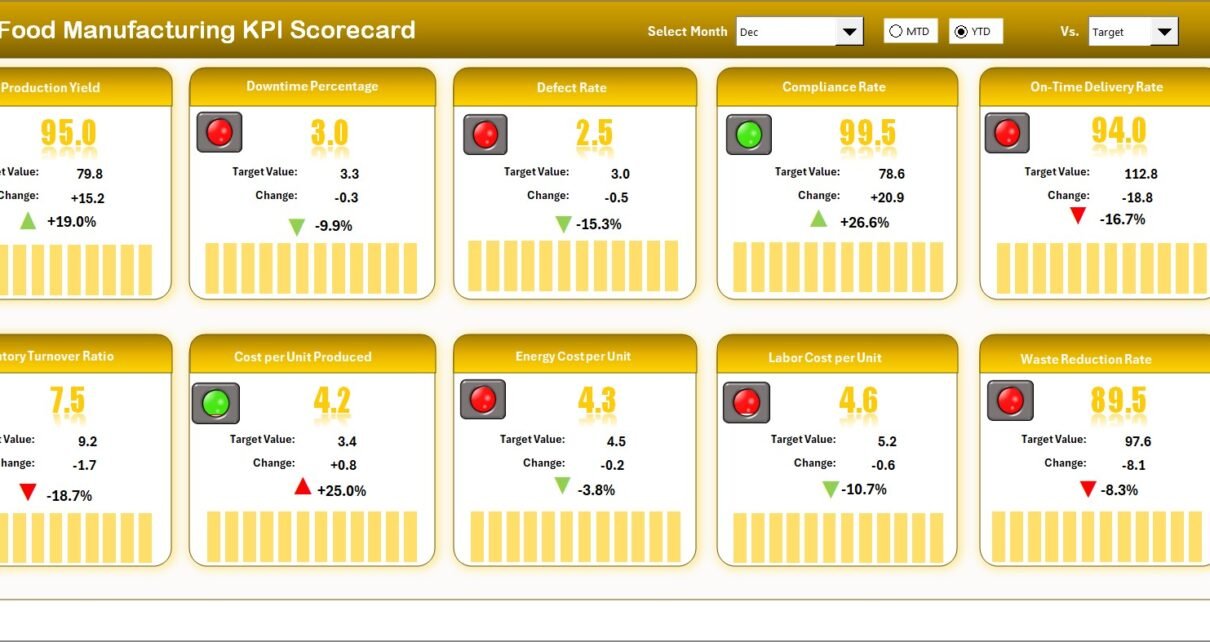
1️⃣ Scorecard Sheet – The Performance Dashboard
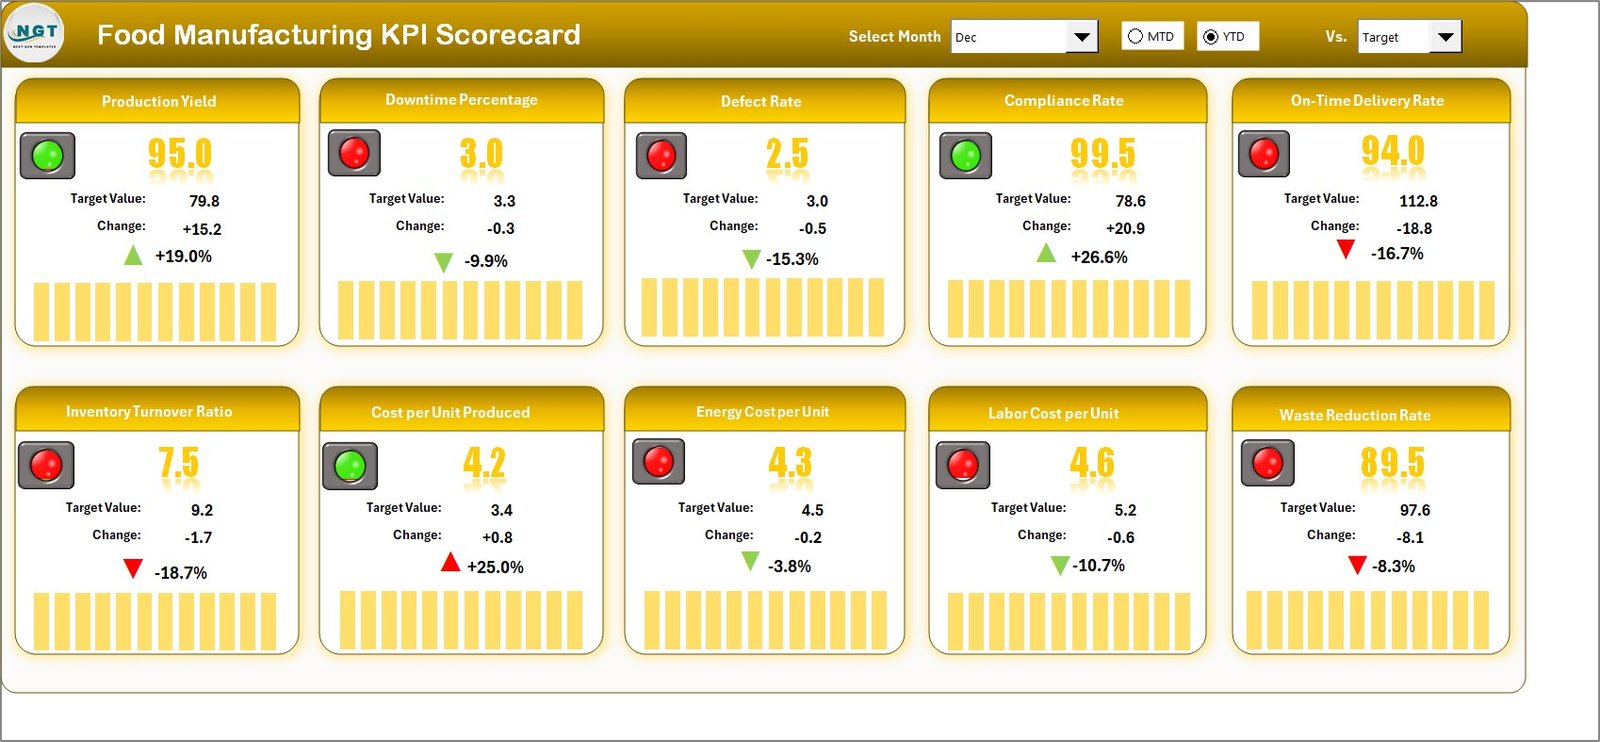
The Scorecard Sheet acts as the central hub for monitoring results. It summarizes performance and provides instant visual feedback.
Key Features:
-
🎛 Dropdown Menus: Choose month, KPI group, or reporting mode (MTD or YTD) to customize the display.
-
📊 Actual vs Target Values: View real-time comparisons to see if your team is achieving goals.
-
🎨 Visual Indicators: Identify performance levels instantly with traffic-light icons and conditional formatting.
-
🧩 Comprehensive KPI Overview: Review every important KPI, including definitions and status for quick decision-making.
This sheet helps managers identify where performance lags and prioritize corrective actions.
2️⃣ KPI Trend Sheet – Visualize Performance Over Time
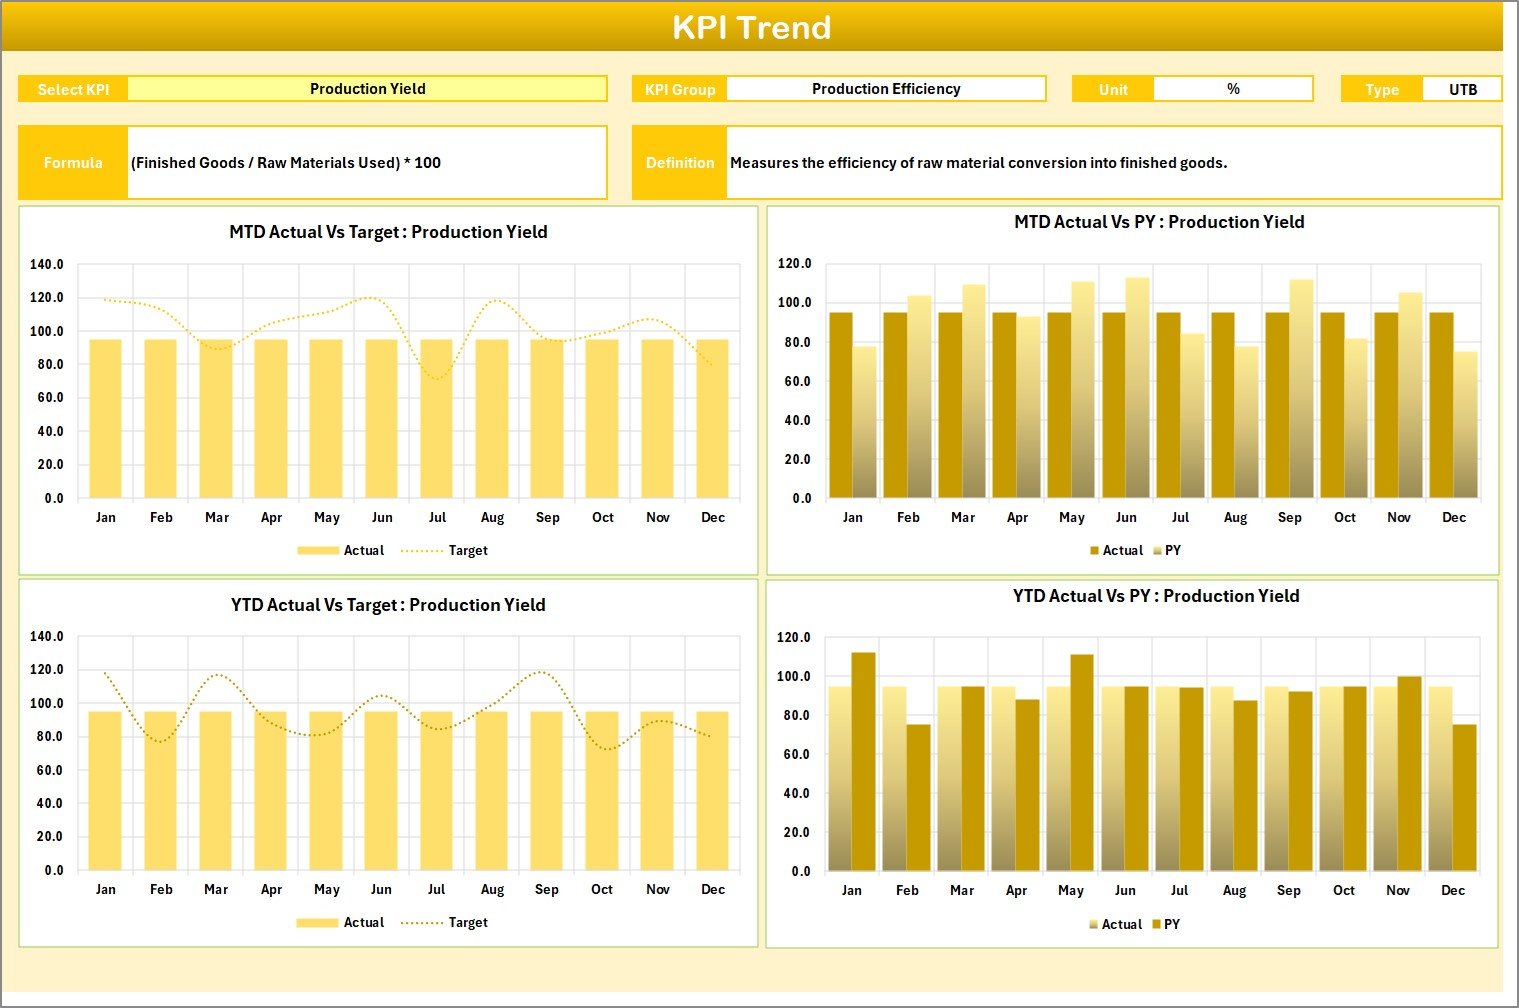
Trends tell the real story. The KPI Trend Sheet allows you to study KPI progress using dynamic visuals.
Highlights:
-
📍 Select any KPI name from a drop-down list (cell C3)
-
📘 Displays KPI group, unit, formula, and type (UTB or LTB)
-
📈 MTD and YTD charts show actual, target, and previous-year values
-
🔁 Helps identify continuous improvement areas or recurring issues
For instance, if the Production Yield (%) trend dips consistently, it signals inefficiency that needs prompt action.
Click to Purchases Food Manufacturing KPI Scorecard in Excel
3️⃣ Input Data Sheet – Centralized Data Entry
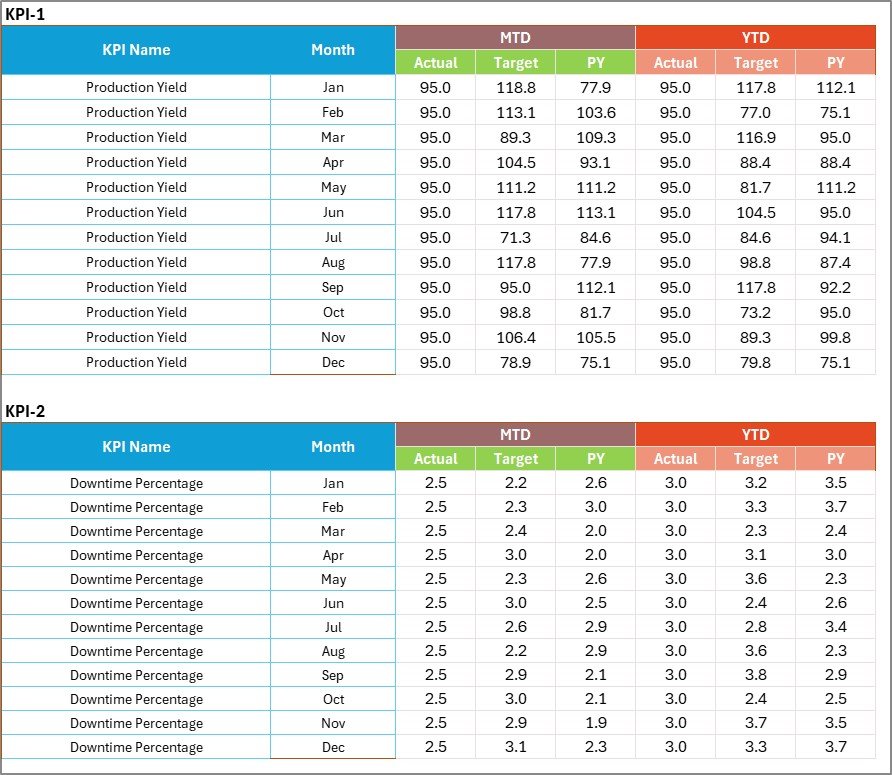
The Input Data Sheet is where you record all your raw numbers.
Functions:
-
✍️ Enter actual performance, targets, and PY (previous year) values
-
🔄 Update data easily each month for automated dashboard refresh
-
⚡ Supports quick copy-paste or data imports from ERP systems
This flexible structure ensures data accuracy and real-time updates without manual recalculations.
4️⃣ KPI Definition Sheet – Clarity Behind Every Metric
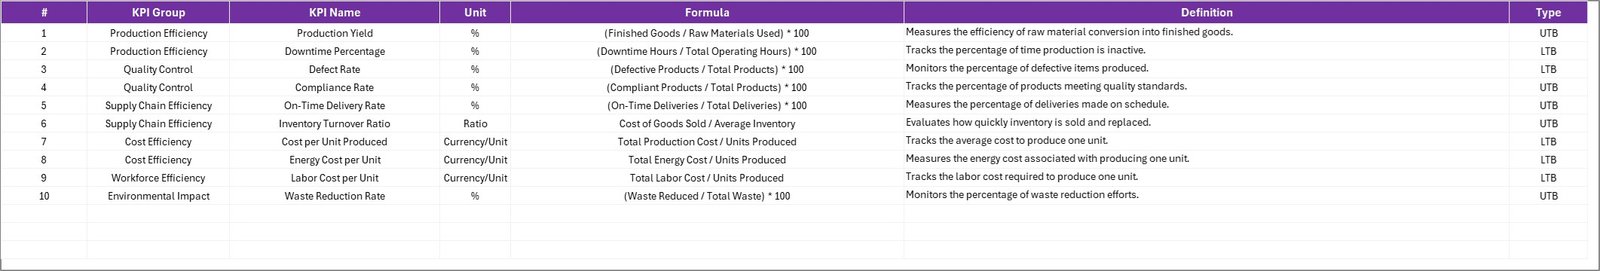
A well-defined KPI ensures consistent understanding across teams. The KPI Definition Sheet documents every performance metric in detail.
Fields include:
-
KPI Name
-
KPI Group (Production, Quality, Cost, Safety, etc.)
-
Unit of Measurement
-
Formula
-
Definition
-
Type (UTB or LTB)
This sheet keeps your performance framework standardized and transparent.
📈 Why Food Manufacturers Need KPI Scorecards
Food manufacturing involves numerous interconnected processes—from procurement and production to packaging and dispatch. Managing all of these without a structured scorecard can cause:
-
Unclear accountability
-
Missed improvement opportunities
-
Inefficient resource allocation
-
Poor quality or compliance issues
By adopting an Excel-based KPI scorecard, you bring all key data into one centralized system that drives accountability and continuous improvement.
Click to Purchases Food Manufacturing KPI Scorecard in Excel
🧩 Key Performance Indicators (KPIs) for Food Manufacturing
Here are common KPI categories included in the Food Manufacturing KPI Scorecard:
1. Production Efficiency
-
Output per Shift
-
Overall Equipment Effectiveness (OEE %)
-
Production Yield %
-
Downtime (Hours)
2. Quality and Safety
-
Defect Rate %
-
Product Recall Count
-
On-Time Quality Inspection %
-
Safety Incidents or Near Misses
3. Cost and Waste Management
-
Cost per Unit (USD)
-
Material Waste %
-
Energy Consumption per Unit
-
Rework Cost %
4. Supply Chain and Delivery
-
On-Time Delivery %
-
Order Fulfillment Time
-
Inventory Turnover Ratio
-
Supplier Defect Rate %
5. Employee and Training
-
Training Hours per Employee
-
Employee Absenteeism %
-
Labor Productivity Index
Each KPI includes a formula, unit, and definition, ensuring consistency in measurement and reporting.
Click to Purchases Food Manufacturing KPI Scorecard in Excel
🌟 Advantages of Food Manufacturing KPI Scorecard in Excel
Using this Excel-based scorecard brings numerous benefits to your manufacturing operation:
1️⃣ Centralized Performance Tracking
Track every KPI—production, cost, quality, and safety—in a single file, ensuring total visibility across departments.
2️⃣ Simplified Analysis
The automated charts and conditional formatting reduce manual analysis time. You can focus on decision-making rather than calculations.
3️⃣ Real-Time Insights
With MTD and YTD comparisons, identify performance gaps instantly and take corrective actions without delay.
4️⃣ Improved Communication
When every department uses the same KPIs and definitions, coordination becomes easier and more efficient.
5️⃣ Data-Driven Decision-Making
Visual trends and color-coded indicators help management make factual, informed decisions backed by data.
6️⃣ Cost-Effective Solution
Unlike expensive BI tools, this Excel scorecard requires no software installation, training, or IT dependency.
7️⃣ Continuous Improvement
Regular tracking motivates teams to maintain standards, boost productivity, and reduce waste.
📊 Example Use Cases for the KPI Scorecard
The Food Manufacturing KPI Scorecard in Excel can serve multiple purposes:
-
Daily Production Review: Monitor daily yields and defects.
-
Monthly Performance Reporting: Present MTD and YTD summaries to management.
-
Quality Audits: Showcase quality performance trends and corrective actions.
-
Employee Evaluations: Use productivity metrics for performance assessments.
-
Supplier Evaluation: Track supplier reliability and defect rates.
🧭 How to Use the Food Manufacturing KPI Scorecard in Excel
Follow these simple steps to get started:
-
Open the Template – Download and open the Excel file.
-
Go to the KPI Definition Sheet – Review and customize KPI names, groups, and formulas.
-
Enter Data in the Input Sheet – Input monthly actual and target values.
-
Switch to the Scorecard Sheet – Choose your desired month or KPI group from the drop-down.
-
View Charts in the KPI Trend Sheet – Analyze MTD and YTD trends automatically generated from your data.
You can also add extra KPIs, departments, or months as your business expands.
Click to Purchases Food Manufacturing KPI Scorecard in Excel
💡 Best Practices for the Food Manufacturing KPI Scorecard
To maximize the effectiveness of your KPI Scorecard, follow these best practices:
✅ 1. Define SMART KPIs
Ensure every KPI is Specific, Measurable, Achievable, Relevant, and Time-bound. Avoid vague or overlapping metrics.
✅ 2. Keep Data Updated
Update the Input Data Sheet regularly. Outdated data leads to inaccurate analysis and wrong conclusions.
✅ 3. Maintain Consistent Formats
Use standardized units, naming conventions, and date formats to prevent confusion.
✅ 4. Review KPI Relevance Quarterly
As your processes evolve, review which KPIs remain meaningful and which need modification.
✅ 5. Use Conditional Formatting Wisely
Color coding helps visualization but should not clutter your dashboard—use green for achieved, red for missed, yellow for borderline.
✅ 6. Encourage Team Collaboration
Share insights with every department so that improvements become collective and continuous.
✅ 7. Back Up Your Data
Keep regular backups to ensure historical performance records remain safe and retrievable.
🔍 Tips for Customizing the KPI Scorecard
-
Add slicers or filters for region, plant, or product type.
-
Include a separate chart for Energy Efficiency or Water Usage if sustainability is a key focus.
-
Insert comments or notes beside underperforming KPIs to document corrective actions.
-
Link multiple factory files into a consolidated master dashboard for company-wide performance tracking.
📉 Common Challenges and How to Overcome Them
Even though Excel is flexible, some challenges can arise:
Challenge 1: Data Entry Errors
Solution: Use data validation lists and formulas to minimize manual mistakes.
Challenge 2: Too Many KPIs
Solution: Focus on 10-15 high-impact KPIs that reflect true business goals.
Challenge 3: Difficulty in Interpretation
Solution: Add a “KPI Type” and “Definition” section for clarity so all stakeholders interpret the results consistently.
Click to Purchases Food Manufacturing KPI Scorecard in Excel
💼 Who Can Use the Food Manufacturing KPI Scorecard?
This Excel tool is ideal for:
-
Production Managers tracking efficiency and downtime
-
Quality Controllers analyzing defect and recall rates
-
Finance Teams monitoring cost per unit
-
Supply Chain Managers evaluating supplier performance
-
Plant Heads reviewing monthly productivity summaries
Whether you’re managing a dairy, bakery, beverage, or frozen food factory, this template adapts perfectly to your operations.
🏁 Conclusion
The Food Manufacturing KPI Scorecard in Excel helps organizations transform their performance monitoring process from manual chaos into structured intelligence. It provides real-time insights, promotes accountability, and empowers managers to make informed decisions quickly.
By implementing this Excel-based KPI framework, your team can ensure consistent product quality, improved efficiency, and long-term profitability—all without needing any complex tools or coding skills.
❓ Frequently Asked Questions (FAQs)
1. What is the purpose of a Food Manufacturing KPI Scorecard?
It measures performance across production, quality, and cost areas. It helps managers identify strengths, weaknesses, and improvement opportunities.
2. Can I customize the KPIs in this Excel template?
Yes. You can easily modify, add, or delete KPIs based on your factory’s operational focus.
3. Does the scorecard support automatic charts?
Absolutely. Once you enter data in the input sheet, all charts and visual indicators update automatically.
4. How often should I update the scorecard?
Update it monthly or weekly—depending on how frequently you track KPIs like yield, downtime, or defect rate.
5. Is this suitable for small-scale manufacturers?
Yes. The Excel template is designed to work for both small producers and large-scale food manufacturing units.
6. What software do I need to use it?
You only need Microsoft Excel (desktop version). No Power BI, VBA, or external software required.
7. Can I track both MTD and YTD results?
Yes. The scorecard includes options to view Month-to-Date and Year-to-Date comparisons for all KPIs.
Click to Purchases Food Manufacturing KPI Scorecard in Excel
Visit our YouTube channel to learn step-by-step video tutorials