Managing a food truck business involves tracking sales across multiple trucks, locations, menu items, and time periods. Our Food Truck Dashboard in Excel simplifies this by bringing all your critical metrics into one interactive, pivot-driven workbook. Whether you run a single truck or a fleet, this dashboard gives you the insights to optimize operations, boost profitability, and delight customers.
This Excel dashboard uses pivot tables, pivot charts, and slicers to create a fully dynamic reporting experience. Simply update your data in the Data sheet, click Refresh All, and every chart and KPI card updates instantly. No VBA or macros required.
👉 Download the Food Truck Dashboard in Excel Now
Dashboard Pages Overview
1. Overview Page
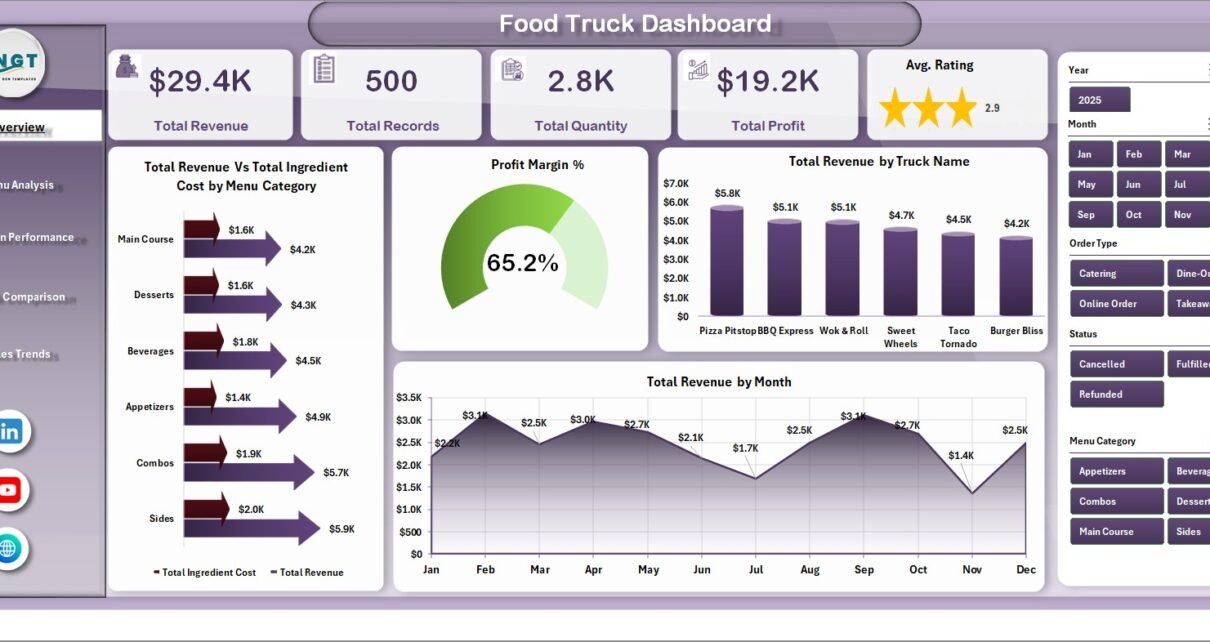
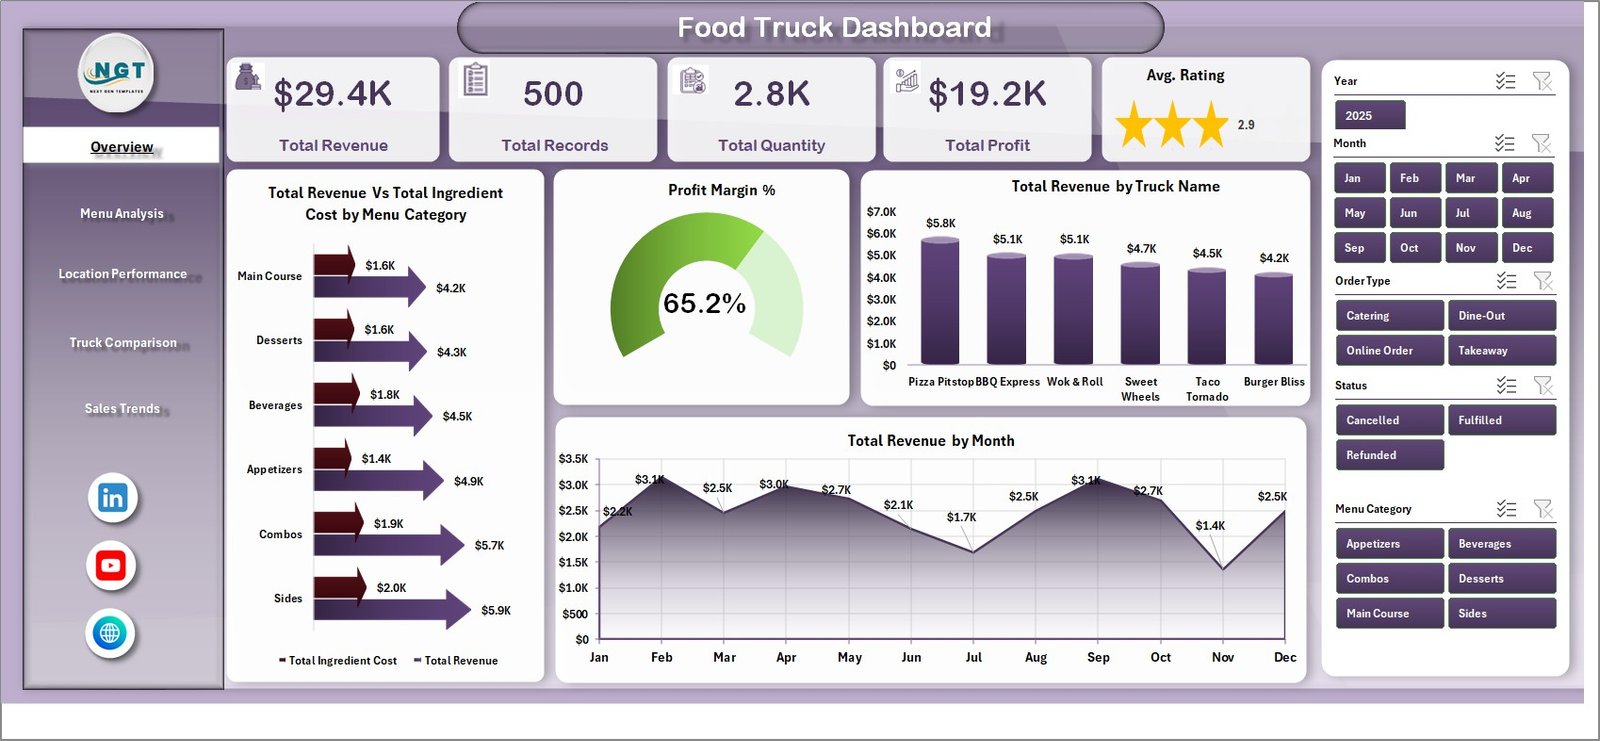
The Overview page gives you a high-level snapshot of your entire food truck operation. At the top, KPI cards display the most important numbers:
- Total Revenue – Overall income generated across all trucks and locations combined.
- Total Records – Total number of sales transactions recorded in your dataset.
- Total Quantity – Sum of all items sold across your entire fleet.
- Total Profit – Net profit after deducting ingredient costs from revenue.
- Avg. Rating – Average customer satisfaction score across all orders.
Below the KPI cards, you’ll find four powerful charts:
👉 Download the Food Truck Dashboard in Excel Now
- Total Revenue Vs Total Ingredient Cost by Menu Category – This chart compares earnings against ingredient spend for each menu category, making it easy to spot which categories are most and least profitable at a glance.
- Profit Margin % – A visual representation of margin percentages that helps you quickly identify which segments deliver the best returns relative to your food costs.
- Total Revenue by Truck Name – Breaks down revenue by individual truck so you can see which vehicles are your top earners and which may need menu or operational adjustments.
- Total Revenue by Month – Shows monthly revenue trends to help you identify seasonal patterns, peak months, and slower periods for better business planning.
The page includes multiple slicers that let you filter the entire dashboard by truck name, location, menu category, and other dimensions for instant drill-down analysis.
2. Menu Analysis
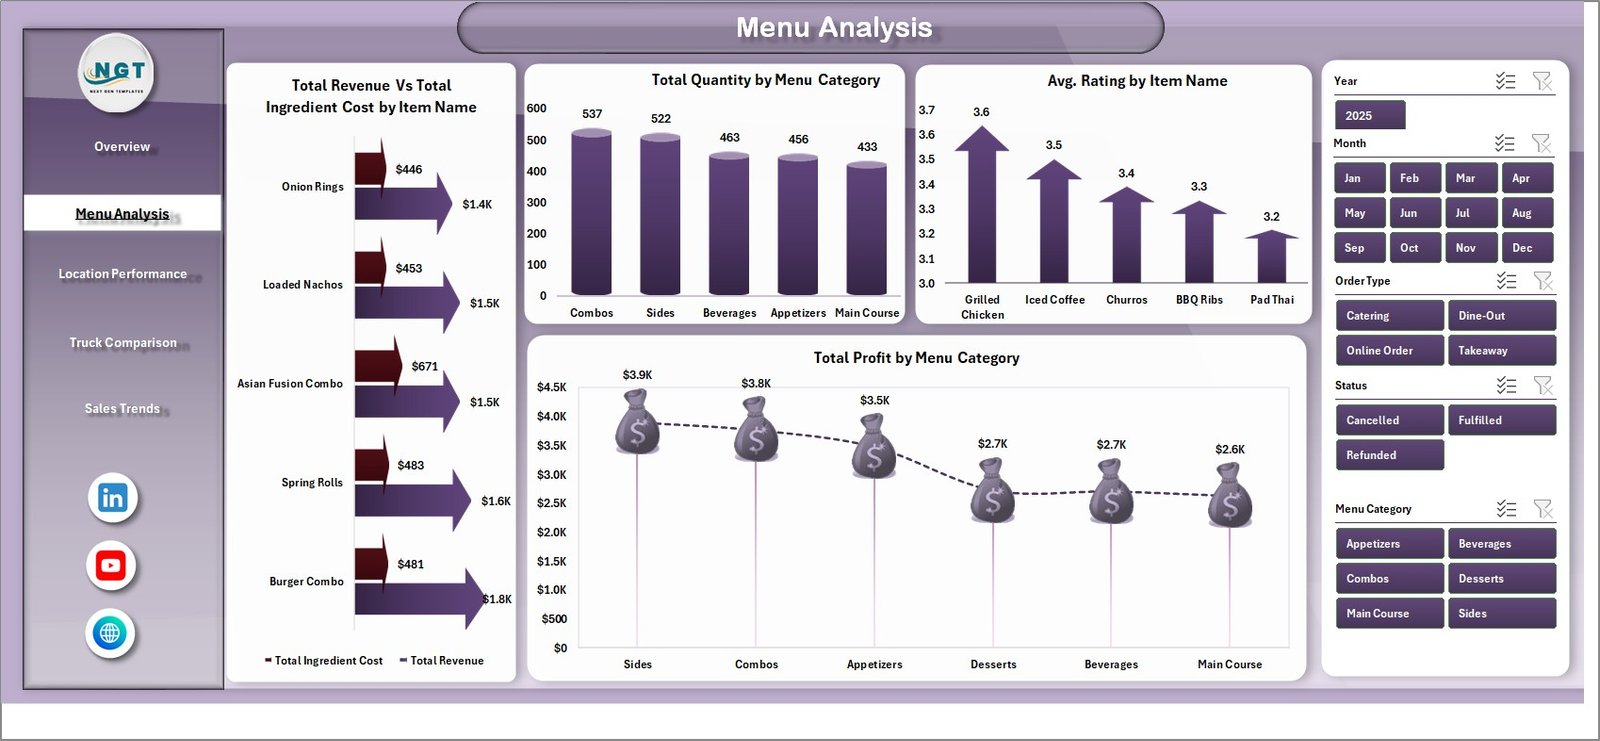
The Menu Analysis page dives deep into the performance of your menu items and categories with four dedicated charts:
- Total Revenue Vs Total Ingredient Cost by Item Name – Evaluates each individual menu item by comparing its revenue against ingredient costs, helping you identify your most and least cost-efficient items.
- Total Quantity by Menu Category – Shows which menu categories drive the highest sales volume across all your trucks.
- Avg. Rating by Item Name – Highlights your customers’ favorite menu items and reveals underperformers that may need recipe improvements or removal from the menu.
- Total Profit by Menu Category – Focuses on which categories contribute the most to your bottom line, helping you optimize your menu mix for maximum profitability.
3. Location Performance
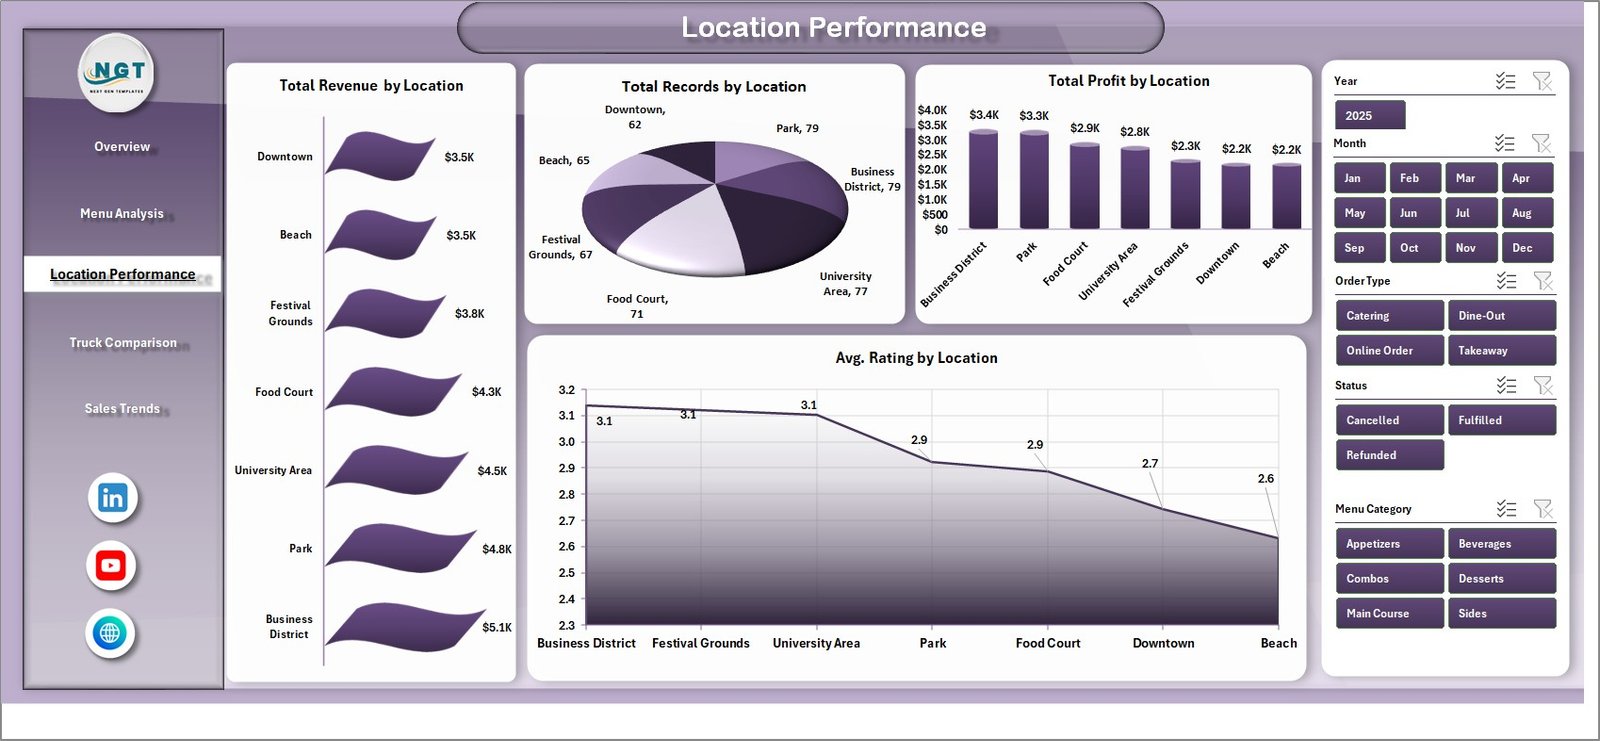
The Location Performance page helps you understand how each operating location contributes to your business:
- Total Revenue by Location – Compares total earnings across all your operating locations to identify your highest-revenue spots.
- Total Records by Location – Shows transaction volume per location, giving you a sense of foot traffic and customer engagement at each spot.
- Total Profit by Location – Reveals which locations are the most profitable after accounting for ingredient and operational costs.
- Avg. Rating by Location – Monitors customer satisfaction scores at each location so you can maintain quality standards across your route.
4. Truck Comparison
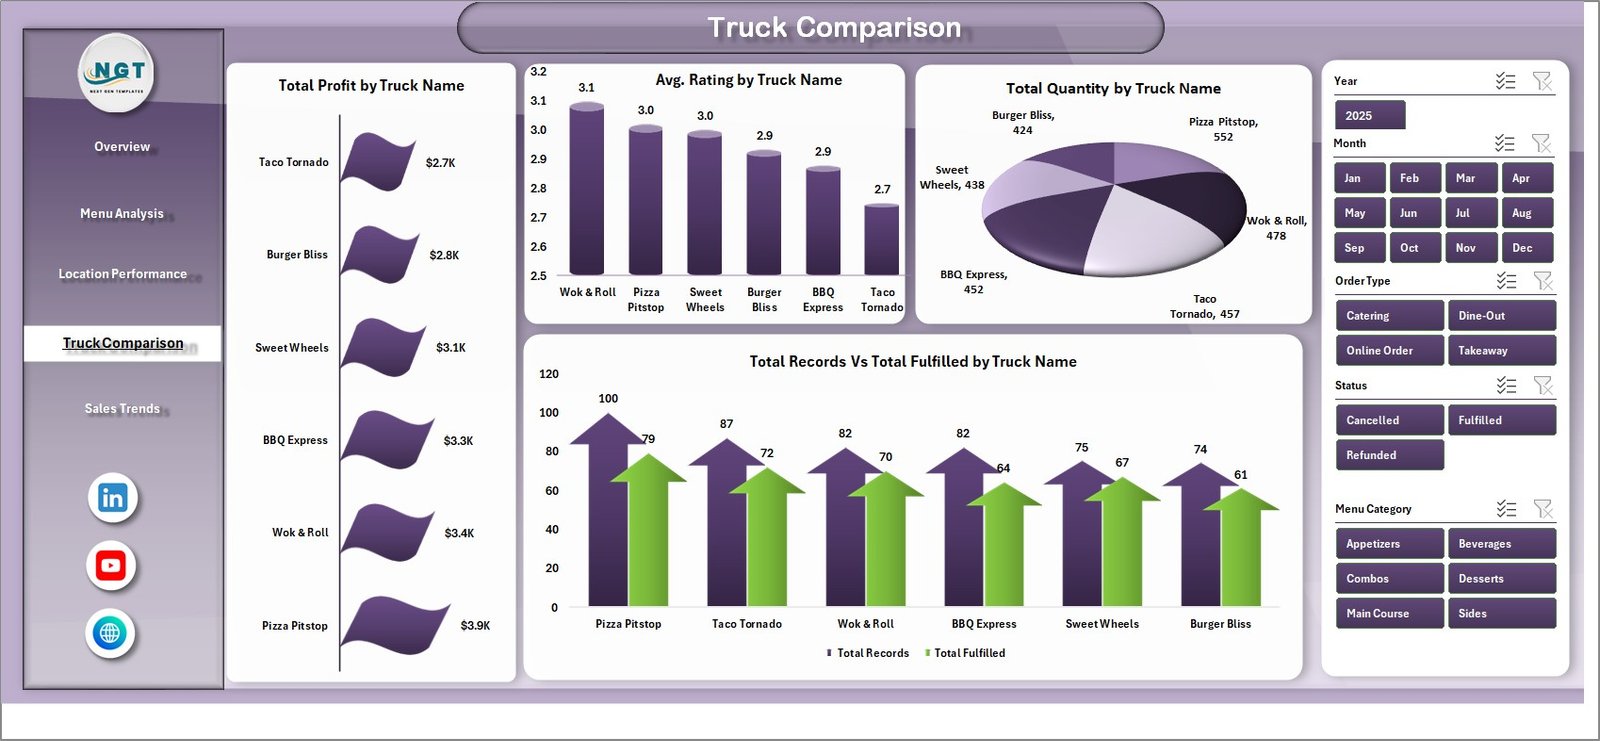
The Truck Comparison page lets you compare your fleet’s performance side by side:
- Total Profit by Truck Name – Ranks your trucks by profitability so you can see which vehicles deliver the best financial results.
- Avg. Rating by Truck Name – Compares customer satisfaction scores across trucks to identify any service quality differences between vehicles.
- Total Quantity by Truck Name – Tracks sales volume per truck to help you optimize staffing, scheduling, and inventory allocation.
- Total Records Vs Total Fulfilled by Truck Name – Monitors order fulfillment rates per truck to spot operational bottlenecks or waste issues.
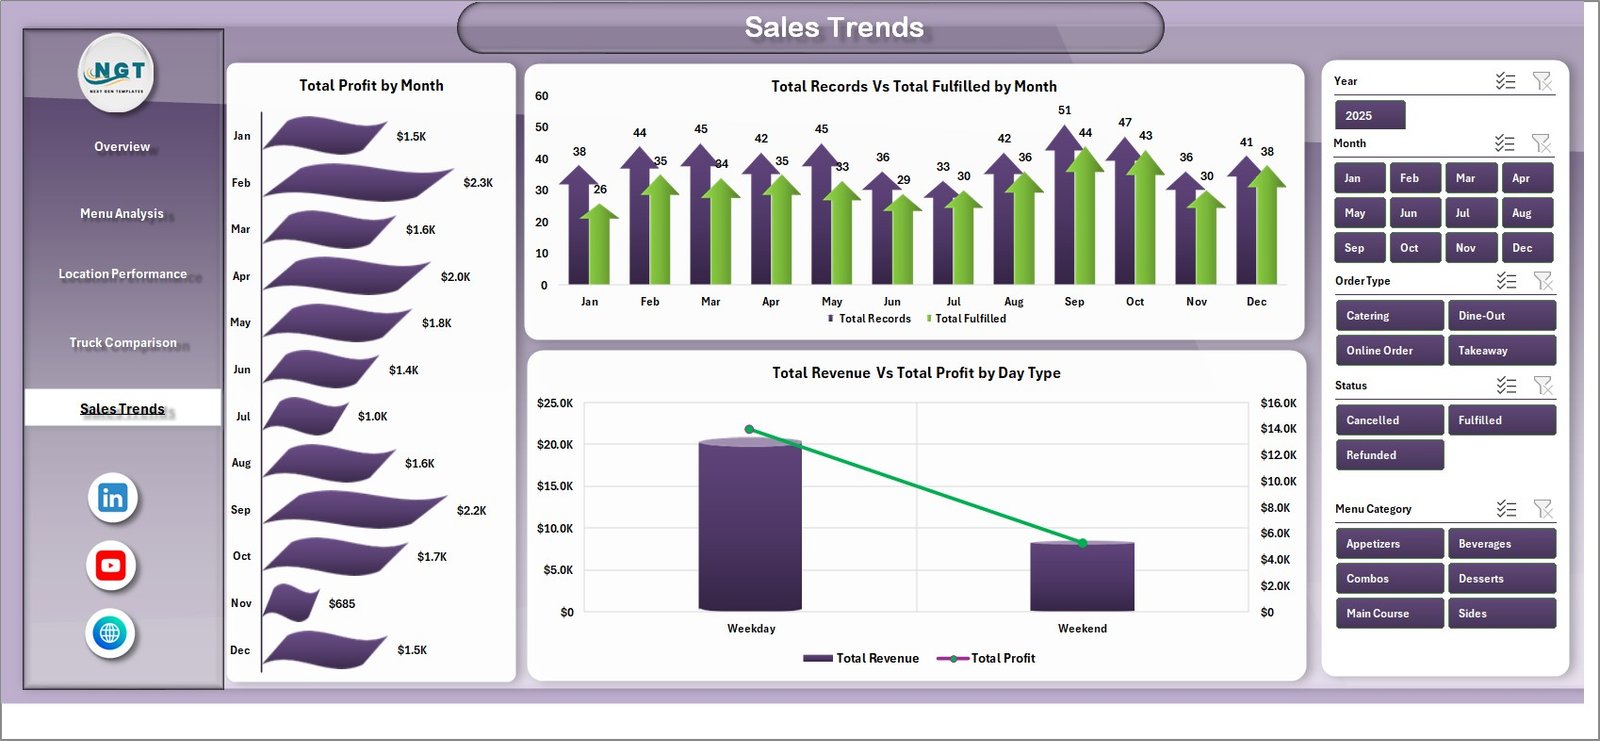
5. Sales Trends
The Sales Trends page helps you spot patterns and plan ahead with time-based analysis:
- Total Profit by Month – Tracks monthly profit trends so you can plan staffing, inventory purchases, and seasonal menu changes proactively.
- Total Records Vs Total Fulfilled by Month – Compares orders received versus orders fulfilled over time to identify fulfillment gaps and improve operational efficiency.
- Total Revenue Vs Total Profit by Day Type – Analyzes weekday versus weekend performance so you can optimize your schedule and maximize earnings on your most profitable days.
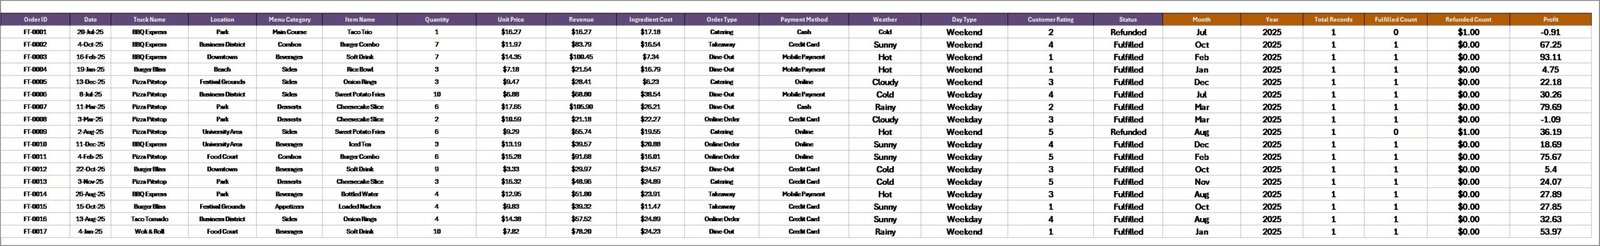
6. Data Sheet
The Data sheet is where all your raw transaction data lives. Add your food truck sales records here in the same column format — including truck name, location, menu item, category, quantity, revenue, ingredient cost, rating, and other fields. Keeping the column structure intact ensures seamless dashboard updates when you refresh.
👉 Download the Food Truck Dashboard in Excel Now
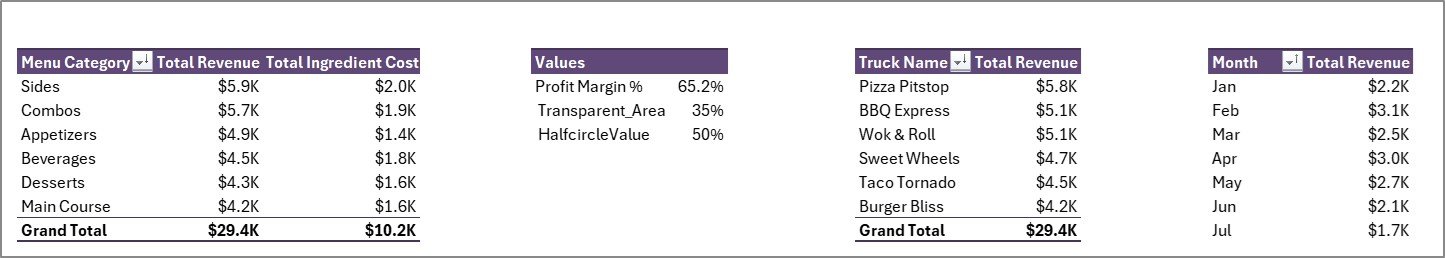
7. Support Sheet
The Support sheet contains multiple pivot tables that power every chart and KPI card in the dashboard. After updating your data in the Data sheet, go to the Data tab in the Excel ribbon and click Refresh All — all pivot tables and charts will update automatically. You can keep this sheet hidden during normal use.
Key Features
- 7 professionally designed sheet tabs covering every aspect of food truck operations
- Dynamic pivot tables and pivot charts that update with a single click
- Interactive slicers for instant filtering by truck, location, category, and more
- KPI cards displaying Total Revenue, Total Records, Total Quantity, Total Profit, and Avg. Rating
- No VBA or macros — built entirely with Excel formulas, pivots, and charts
- Compatible with Excel 2016 and later versions
Who Is This Dashboard For?
- Food truck owners and operators tracking daily sales and profitability
- Mobile food business managers overseeing multiple trucks and locations
- Street food entrepreneurs looking for data-driven menu and pricing decisions
- Food truck fleet managers comparing vehicle and crew performance
- Restaurant owners exploring or expanding into mobile food operations
How to Use This Dashboard
- Download the Excel file and open it in Microsoft Excel 2016 or later.
- Go to the Data Sheet tab and replace the sample data with your own food truck transaction records.
- Navigate to the Data tab in the Excel ribbon and click Refresh All.
- All pivot tables, charts, and KPI cards across all dashboard tabs will update automatically.
- Use the slicers on the Overview page to filter and explore your data interactively.
👉 Download the Food Truck Dashboard in Excel Now
Visit NextGenTemplates.com for more professional Excel, Google Sheets, Power BI, and HTML dashboard templates.