Food Truck Dashboard in Power BI is a professionally designed analytics template that gives food truck owners, fleet managers, and mobile food entrepreneurs complete visibility into their business performance. Whether you operate a single truck or manage a fleet across multiple locations, this Power BI dashboard brings all your critical metrics — sales, profit margins, menu performance, location analysis, and seasonal trends — into one interactive reporting tool.
This dashboard uses Power BI visuals, slicers, and dynamic charts to deliver real-time insights from your food truck data. Simply connect your data source, click Refresh, and every chart and KPI card updates automatically. No DAX writing or advanced Power BI skills are required.
👉 Click here to Purchase Food Truck Dashboard in Power BI
Key Features of Food Truck Dashboard in Power BI
- 5 Interactive Dashboard Pages — Overview, Menu Analysis, Location Performance, Truck Comparison, and Sales Trends provide a comprehensive view of every aspect of your food truck operations.
- 5 KPI Cards — Total Orders, Total Profit, Total Revenue, Total Ingredient Cost, and Total Quantity are displayed prominently on the Overview page for at-a-glance monitoring.
- Dynamic Slicers — Filter the entire dashboard by truck name, location, menu category, and time period for instant drill-down analysis.
- Interactive Power BI Charts — Every page features visuals that let you compare revenue, profit, ratings, and fulfillment across trucks, locations, menu items, and time periods.
- No Coding Required — Open the .pbix file in Power BI Desktop, connect your data, refresh, and start analyzing immediately.
- Cross-Platform Available — Also offered as an Excel Dashboard for spreadsheet-based analytics.
Dashboard Pages Explanation
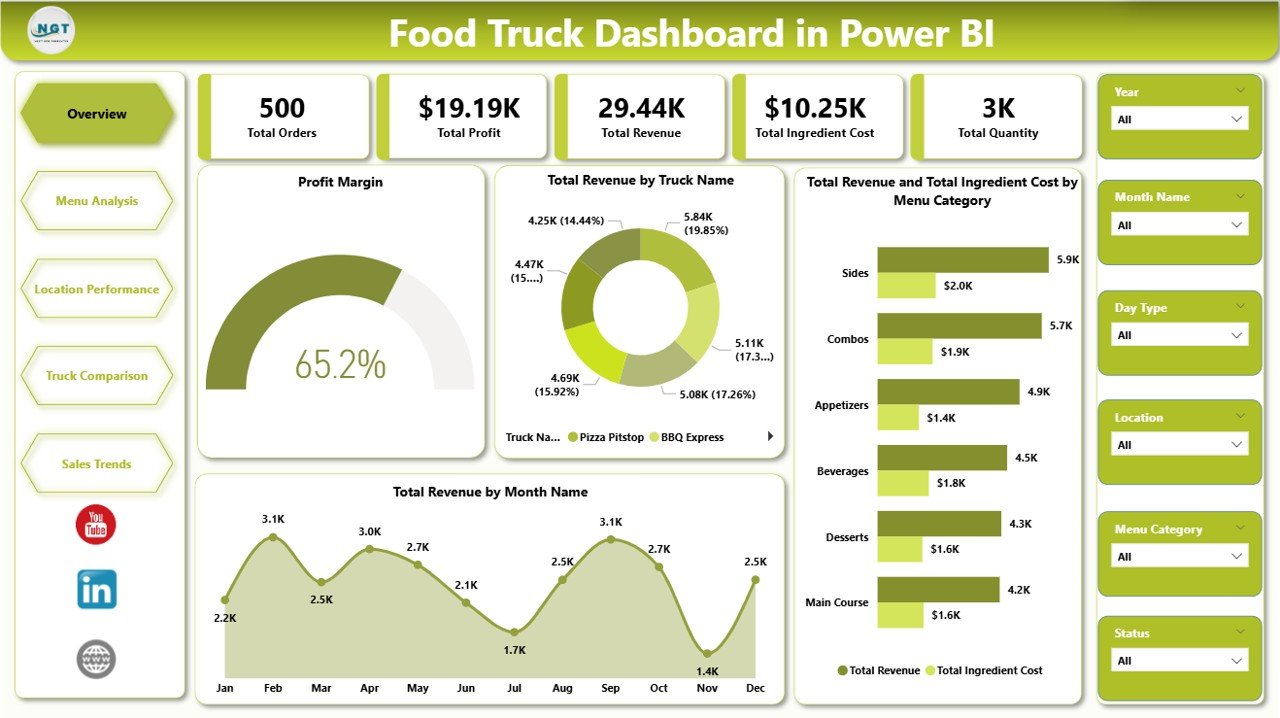
1. Overview Page
The Overview page provides a high-level snapshot of your entire food truck operation. At the top, 5 KPI cards display the most important numbers:
- Total Orders — The total number of customer orders recorded across all trucks and locations.
- Total Profit — Net profit calculated after deducting ingredient costs from total revenue.
- Total Revenue — Overall income generated across your entire food truck fleet.
- Total Ingredient Cost — The cumulative cost of ingredients used across all menu items and trucks.
- Total Quantity — Sum of all items sold across all trucks and locations combined.
Below the KPI cards, you’ll find interactive charts that provide deeper insights:
- Profit Margin — Visualizes the overall profit margin percentage, helping you quickly assess how much of your revenue converts to profit after ingredient costs.
- Total Revenue by Truck Name — Breaks down revenue by individual truck so you can see which vehicles are your top earners and which may need menu or operational adjustments.
- Total Revenue and Total Ingredient Cost by Menu Category — Compares earnings against ingredient spend for each menu category, making it easy to spot the most and least cost-efficient categories.
- Total Revenue by Month Name — Shows monthly revenue trends to help you identify seasonal patterns, peak months, and slower periods for better business planning.
The page includes multiple slicers that let you filter the entire dashboard by truck name, location, menu category, and other dimensions for instant drill-down analysis.
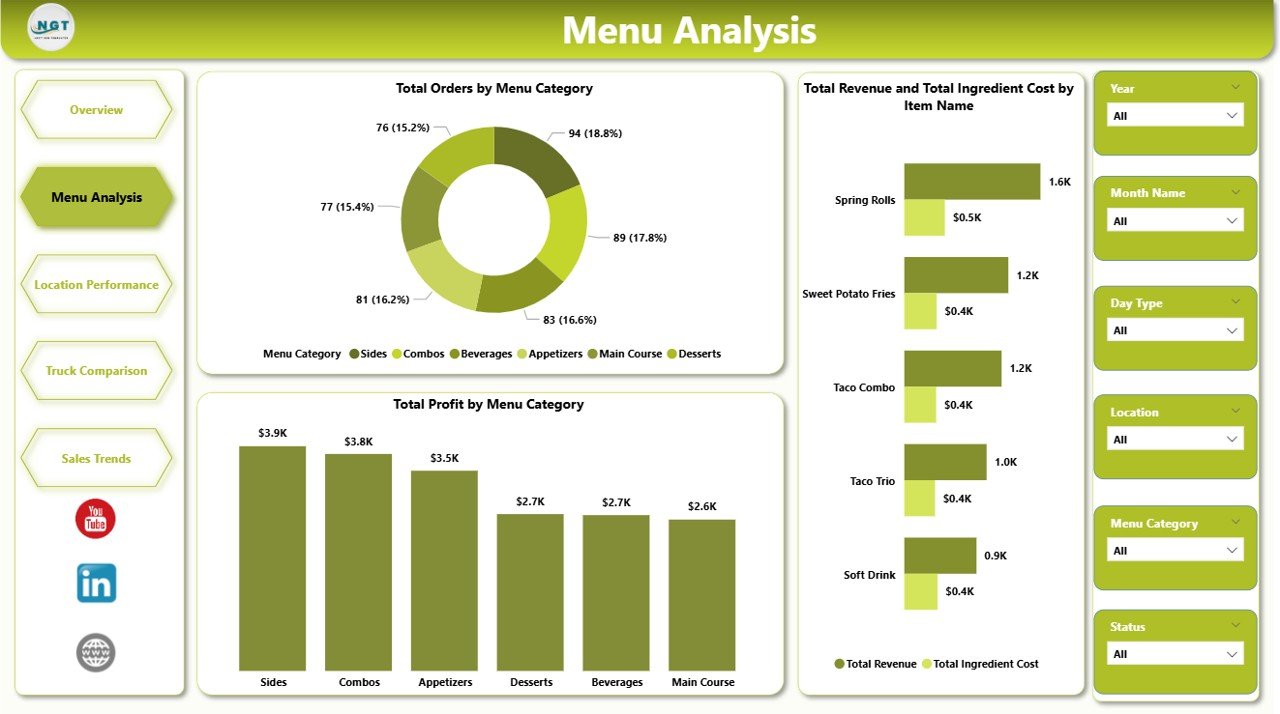
2. Menu Analysis
The Menu Analysis page dives deep into the performance of your menu items and categories with dedicated charts:
- Total Orders by Menu Category — Shows which menu categories drive the highest order volumes across all your trucks, helping you understand customer preferences.
- Total Revenue and Total Ingredient Cost by Item Name — Evaluates each individual menu item by comparing its revenue against ingredient costs, revealing your most and least cost-efficient items.
- Total Profit by Menu Category — Focuses on which categories contribute the most to your bottom line, helping you optimize your menu mix for maximum profitability.
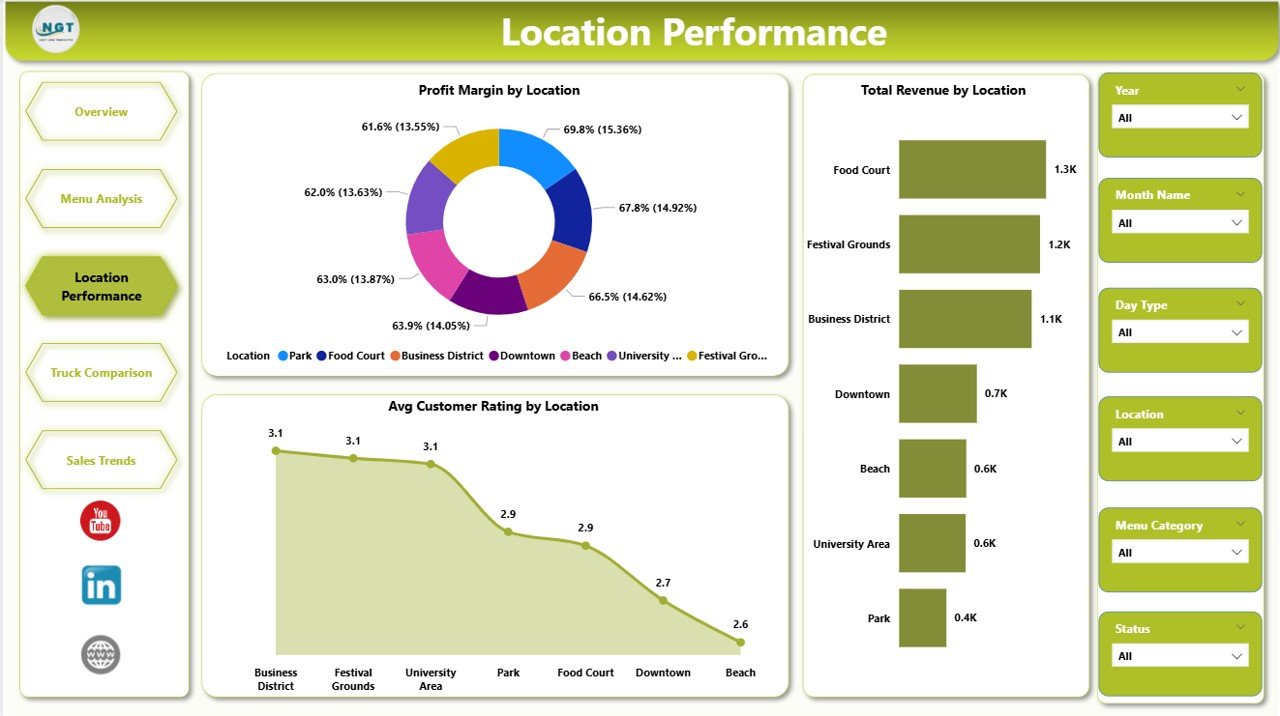
3. Location Performance
The Location Performance page helps you understand how each operating location contributes to your business:
- Profit Margin by Location — Compares profit margin percentages across locations so you can identify your most cost-efficient operating spots and reduce time spent at underperforming ones.
- Total Revenue by Location — Ranks all your operating locations by total earnings to quickly identify your highest-revenue spots.
- Avg Customer Rating by Location — Monitors customer satisfaction scores at each location so you can maintain quality standards across your entire route.
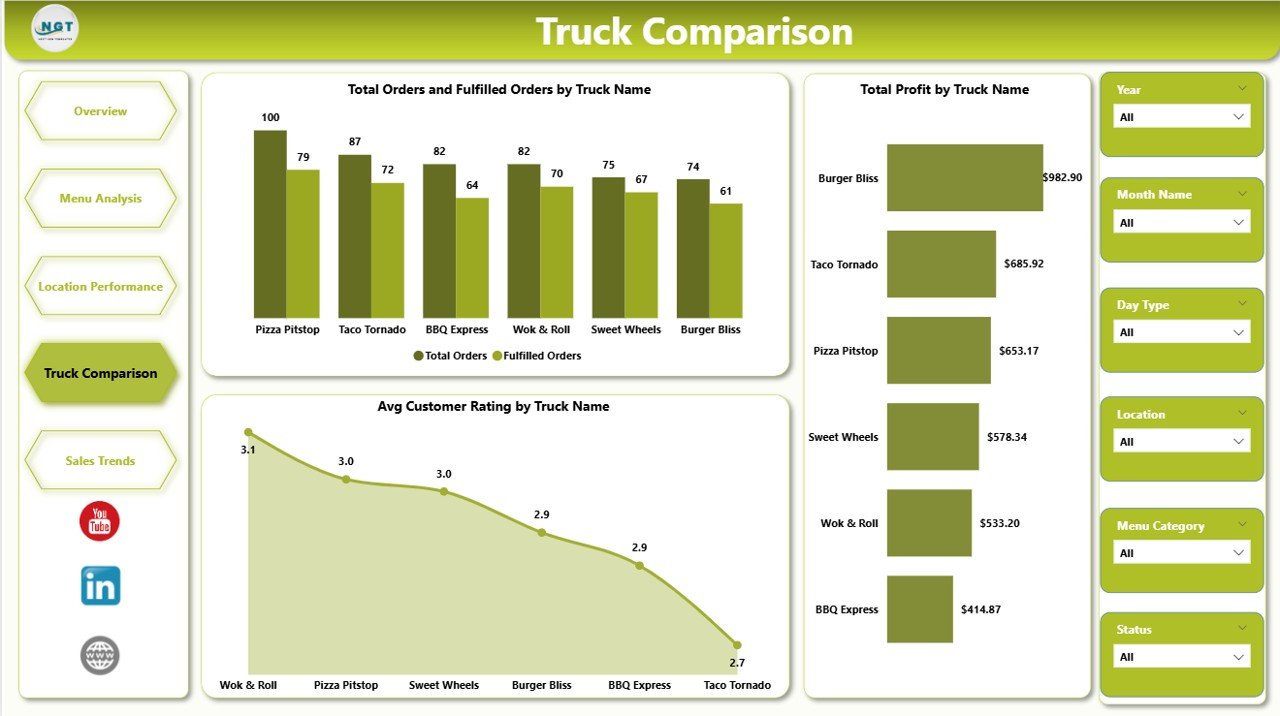
4. Truck Comparison
The Truck Comparison page lets you compare your fleet’s performance side by side:
- Total Orders and Fulfilled Orders by Truck Name — Monitors order volumes and fulfillment rates per truck to spot operational bottlenecks or waste issues across your fleet.
- Total Profit by Truck Name — Ranks your trucks by profitability so you can see which vehicles deliver the best financial results.
- Avg Customer Rating by Truck Name — Compares customer satisfaction scores across trucks to identify service quality differences between vehicles and crews.
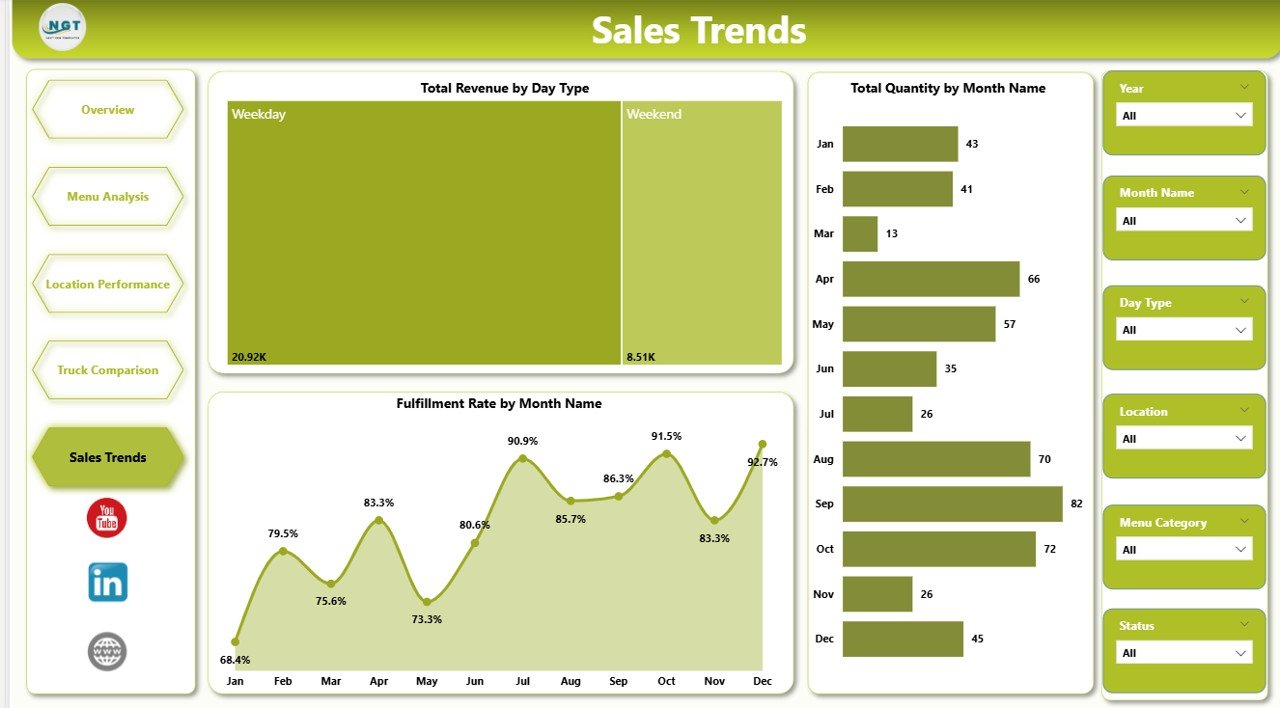
5. Sales Trends
The Sales Trends page helps you spot patterns and plan ahead with time-based analysis:
- Total Revenue by Day Type — Analyzes weekday versus weekend performance so you can optimize your schedule and maximize earnings on your most profitable days.
- Total Quantity by Month Name — Tracks monthly sales volume trends to help you plan inventory purchases, seasonal menu changes, and staffing levels proactively.
- Fulfillment Rate by Month Name — Compares orders received versus orders fulfilled over time to identify fulfillment gaps and improve operational efficiency.
Advantages of Food Truck Dashboard in Power BI
- Centralized Reporting — All your food truck data consolidated into one interactive dashboard eliminates the need for multiple spreadsheets and manual calculations.
- Real-Time Insights — Connect to live data sources and refresh to see up-to-the-minute performance metrics for faster decision-making.
- Fleet-Level Visibility — The Truck Comparison page gives fleet operators a single view of all trucks’ performance, profitability, and customer satisfaction.
- Menu Optimization — Menu Analysis charts reveal which items and categories are most profitable, enabling data-driven menu engineering decisions.
- Location Intelligence — Revenue and profit margin analysis by location helps you choose the best spots and retire underperforming ones.
Opportunities for Improvement
- Weather Data Integration — Adding weather data could reveal correlations between weather conditions and sales performance at different locations.
- Inventory Forecasting — Connecting ingredient purchase data would enable predictive inventory management based on historical sales patterns.
- Customer Segmentation — Adding customer demographic data could unlock targeted marketing insights for different locations and time periods.
- Real-Time POS Integration — Connecting directly to point-of-sale systems would automate data updates and eliminate manual data entry entirely.
Best Practices
- Update Data Weekly — Refresh your food truck data at least weekly to keep dashboard insights current and actionable.
- Review Location Performance Monthly — Use the Location Performance page to evaluate and adjust your operating routes quarterly.
- Monitor Fulfillment Rates — Track the Fulfillment Rate chart monthly to identify and address order completion gaps early.
- Compare Trucks Regularly — Use the Truck Comparison page to identify training needs, equipment issues, or operational inefficiencies across your fleet.
- Share with Your Team — Publish the dashboard to Power BI Service so crew managers and partners can access insights remotely.
Explore Relevant Templates
- Food Truck Dashboard in Excel — Pivot-driven Excel version with 7 sheet tabs, slicers, and KPI cards for food truck owners who prefer spreadsheet analytics.
- Food Service KPI Dashboard in Power BI — A KPI scorecard template for restaurants and food service businesses tracking MTD/YTD performance against targets.
- Restaurants & Food Services KPI Dashboard in Excel — Comprehensive KPI tracking for restaurant operations including financial, customer, and employee metrics.
- Trucking and Logistics Dashboard in Power BI — Fleet management and logistics analytics for businesses managing truck operations and delivery performance.
Frequently Asked Questions
What is the best Power BI dashboard for food truck businesses?
The Food Truck Dashboard in Power BI from NextGenTemplates is one of the best options available. It includes 5 interactive pages tracking Total Orders, Total Profit, Total Revenue, Total Ingredient Cost, and Total Quantity with dedicated analysis for menu performance, location profitability, truck comparison, and sales trends.
How do I use a food truck dashboard in Power BI?
Download the .pbix file and open it in Power BI Desktop (free from Microsoft). Replace the sample data with your own food truck transaction records, click Refresh, and all 5 dashboard pages update automatically. Use slicers to filter by truck, location, menu category, and time period.
Can I track multiple food trucks in one Power BI dashboard?
Yes. The Food Truck Dashboard in Power BI includes a dedicated Truck Comparison page that lets you compare Total Orders, Total Profit, Fulfilled Orders, and Customer Ratings across all your trucks side by side.
What KPIs should food truck owners track?
Food truck owners should track Total Orders, Total Revenue, Total Profit, Ingredient Cost, Profit Margin, Customer Ratings, and Fulfillment Rate. This dashboard tracks all of these metrics across 5 interactive pages.
Is Power BI Desktop free to download?
Yes. Power BI Desktop is free to download from Microsoft’s official website. You can open and use the .pbix file with full functionality at no cost. Publishing to Power BI Service for online sharing may require a Pro license.
How does this dashboard compare to the Excel version?
The Power BI version offers more advanced interactive visuals, natural language queries, and easier data source connectivity. The Excel version uses pivot tables and slicers and is ideal for users who prefer working in spreadsheets without installing additional software.
Conclusion
The Food Truck Dashboard in Power BI is a powerful, easy-to-use analytics tool that helps food truck owners, fleet managers, and mobile food entrepreneurs track sales, monitor profitability, optimize menus, evaluate locations, and compare truck performance — all from one interactive dashboard. With 5 dedicated analysis pages, 5 KPI cards, dynamic slicers, and professional Power BI visuals, this template transforms raw food truck data into actionable business insights.
👉 Click here to Purchase Food Truck Dashboard in Power BI
Visit NextGenTemplates.com for more professional Excel, Google Sheets, Power BI, and HTML dashboard templates.
Visit our YouTube channel to learn step-by-step video tutorials: