Forestry operations require strong planning, clear visibility, and continuous monitoring. However, many forestry businesses still depend on scattered spreadsheets. As a result, managers struggle to track harvesting performance, revenue, cost, and profitability in one place. Therefore, they miss key trends. They also lose control over regional performance and plantation efficiency.
That is exactly why a Forestry Dashboard in Excel becomes a powerful solution.
This ready-to-use Forestry Dashboard in Excel helps forestry managers monitor harvested forest percentage, revenue, cost, profit margin, and performance by forest type, plantation type, tree species, and month. Moreover, it presents all information in one structured system.
In this detailed guide, you will learn:
Click to Purchases Forestry Dashboard in Excel
-
What a Forestry Dashboard in Excel is
-
Why forestry companies need it
-
Complete explanation of all 5 dashboard pages
-
Key metrics included
-
Advantages of Forestry Dashboard in Excel
-
Best practices for implementation
-
Frequently Asked Questions with answers
Let us explore everything step by step.
What Is a Forestry Dashboard in Excel?
A Forestry Dashboard in Excel is a ready-to-use Excel-based performance monitoring template designed specifically for forestry operations.
It collects raw forestry data and transforms it into clear visual reports. Instead of checking multiple sheets, you can monitor performance on one structured dashboard.
This dashboard helps you:
-
Track harvested forest percentage
-
Monitor revenue and cost
-
Analyze profit margin by region
-
Compare forest types and plantation types
-
Evaluate tree species profitability
-
Review monthly trends
Because it works in Excel, you do not need advanced software. You only need structured data and pivot charts.
Why Do Forestry Businesses Need a Forestry Dashboard in Excel?
Forestry operations involve many moving parts. You manage regions, forest types, plantation types, managers, and tree species. Therefore, manual tracking often creates confusion.
Without a dashboard:
-
You cannot easily measure profit margin.
-
You miss underperforming forest types.
-
You fail to identify costly regions.
-
You struggle to track harvesting efficiency.
However, when you use a Forestry Dashboard in Excel:
-
You get real-time performance visibility.
-
You compare revenue and cost instantly.
-
You detect profit issues early.
-
You improve operational decisions.
As a result, you increase profitability and efficiency.
Structure of Forestry Dashboard in Excel
This dashboard includes 5 analytical pages along with Data and Support sheets. Moreover, it includes a Page Navigator on the left side for smooth movement between pages.
Let us understand each page in detail.
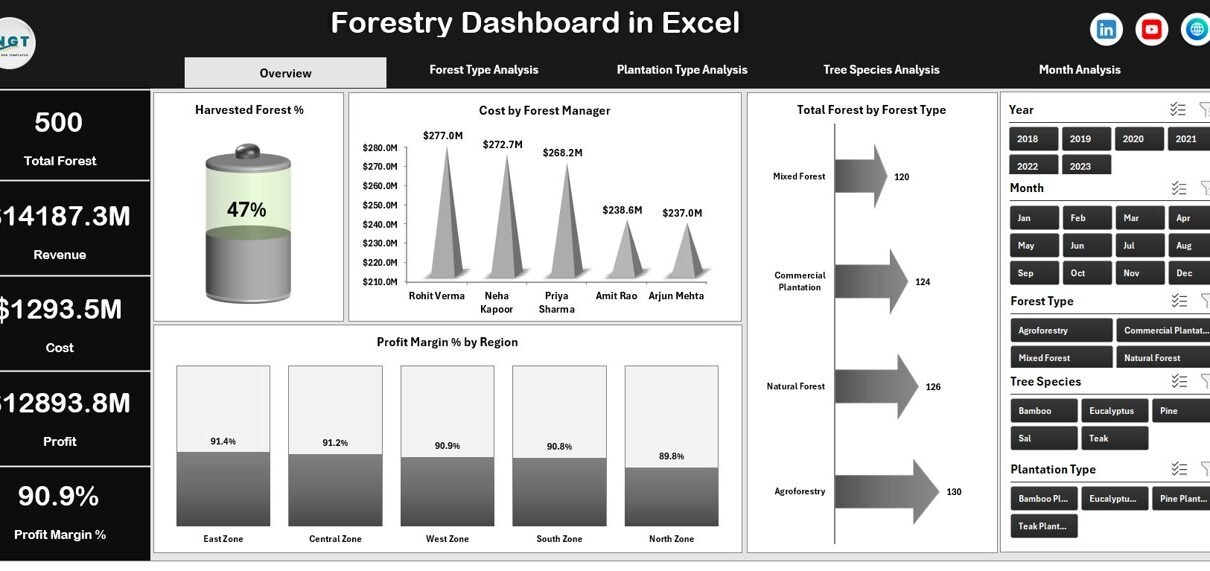
1️⃣ Overview Page – What Can You See at a Glance?
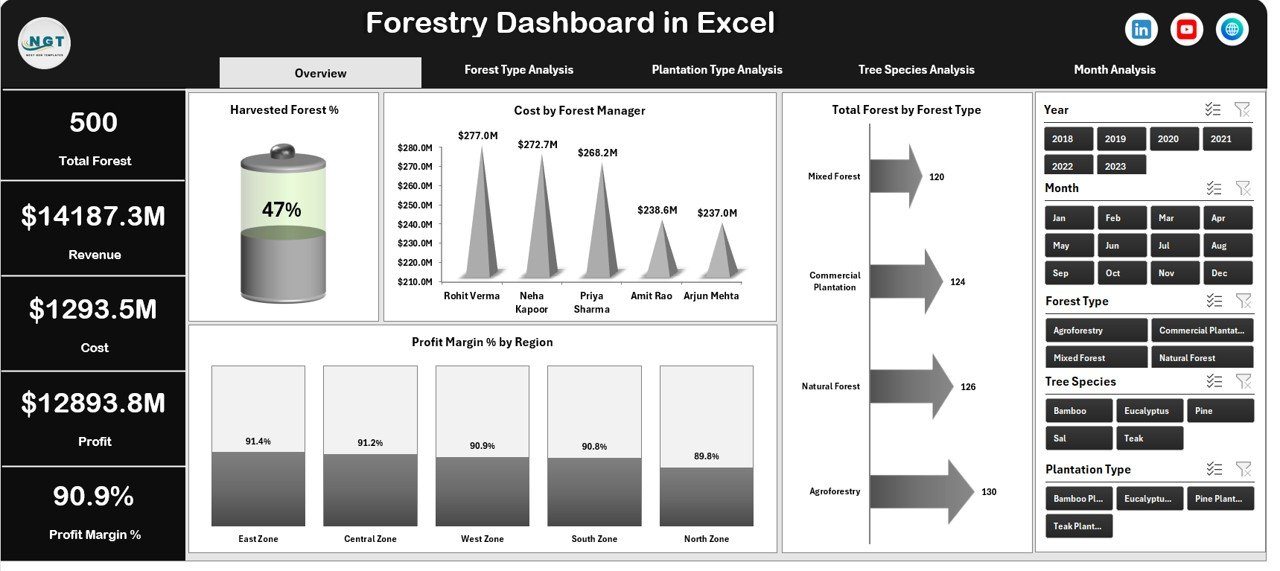
The Overview Page acts as the central control panel.
On this page, you will find:
-
Right-side slicers (filters)
-
4 KPI Cards
-
4 Pivot Charts
🔹 KPI Cards
The dashboard displays four important cards such as:
-
Total Revenue
-
Total Cost
-
Total Profit
-
Harvested Forest %
These cards help managers quickly understand overall performance.
🔹 Charts on Overview Page
-
Harvested Forest %
-
Shows the percentage of harvested forest area
-
Helps track operational efficiency
-
-
Cost by Forest Manager
-
Displays cost distribution across managers
-
Helps identify high-cost management areas
-
-
Total Forest by Forest Type
-
Shows forest distribution by type
-
Supports planning decisions
-
-
Profit Margin % by Region
-
Compares regional profitability
-
Helps management focus on low-margin regions
-
Because this page shows high-level metrics, it supports quick executive decisions.
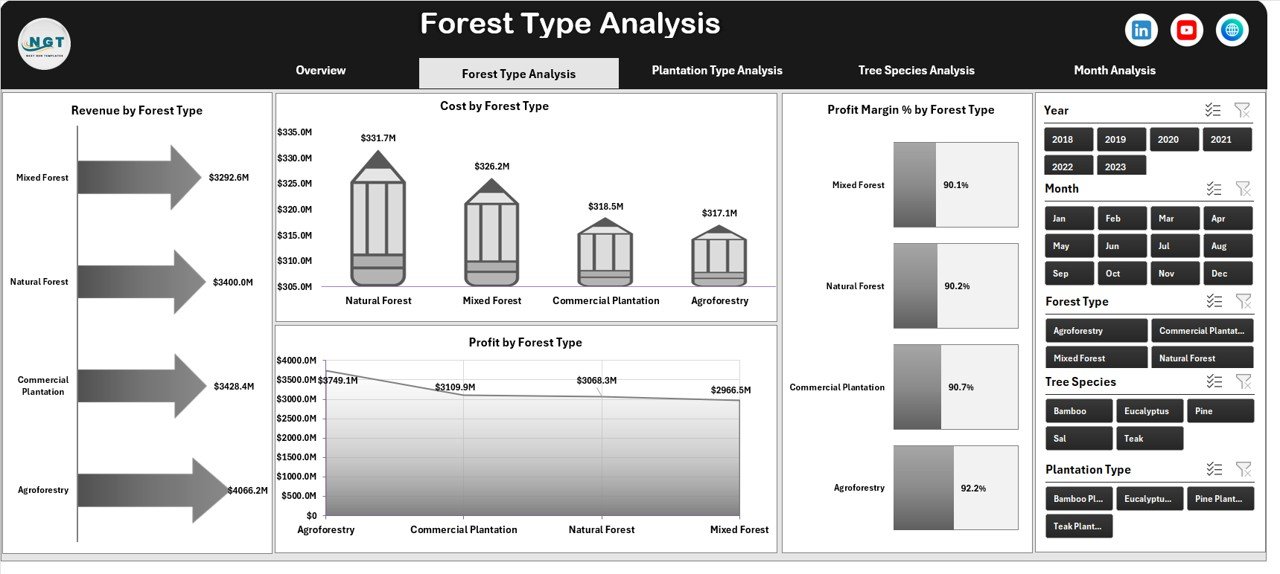
2️⃣ Forest Type Analysis – Which Forest Type Performs Best?
Forestry companies often manage multiple forest types such as:
-
Natural Forest
-
Plantation Forest
-
Mixed Forest
-
Bamboo Forest
Therefore, this page focuses on forest-level profitability.
🔹 Slicers on Right Side
Click to Purchases Forestry Dashboard in Excel
You can filter by:
-
Region
-
Month
-
Forest Manager
-
Tree Species
🔹 Charts Included
-
Revenue by Forest Type
-
Cost by Forest Type
-
Profit Margin % by Forest Type
-
Profit by Forest Type
This page helps you answer:
-
Which forest type generates the highest revenue?
-
Which forest type has the highest cost?
-
Which forest type gives the best profit margin?
As a result, management can focus investment on high-performing forest types.
3️⃣ Plantation Type Analysis – Which Plantation Strategy Works Better?
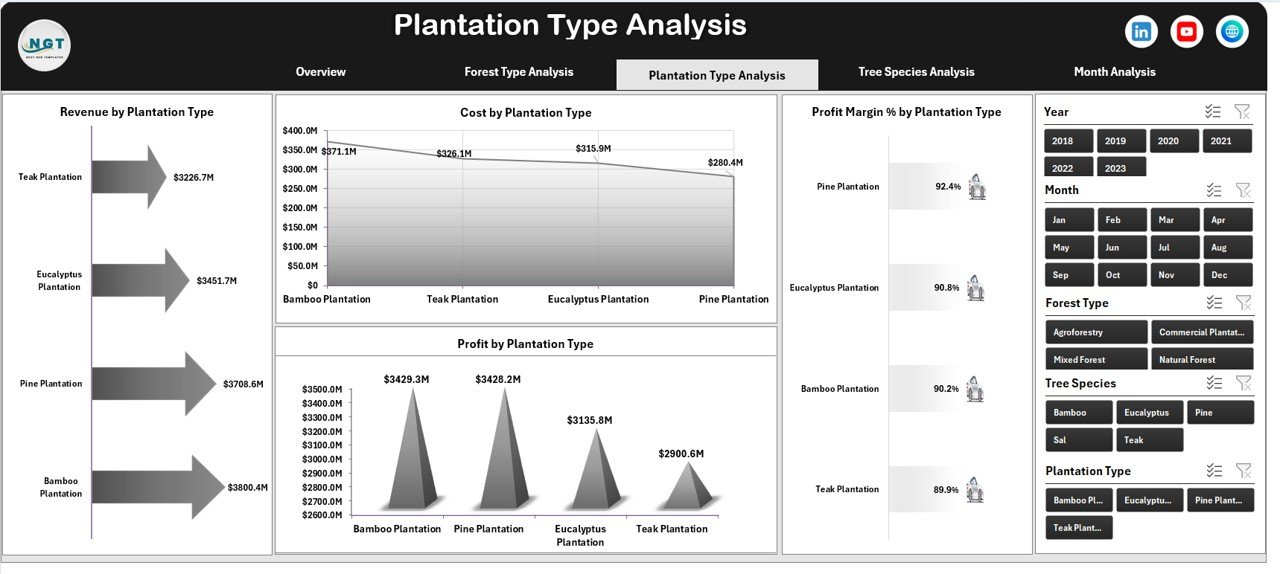
Plantation strategy directly impacts revenue and cost. Therefore, this page focuses on plantation type analysis.
Common plantation types include:
-
Commercial Plantation
-
Agroforestry
-
Timber Plantation
-
Reforestation Projects
🔹 Charts Included
-
Revenue by Plantation Type
-
Cost by Plantation Type
-
Profit Margin % by Plantation Type
-
Profit by Plantation Type
Because plantation type affects long-term returns, this analysis supports strategic planning.
4️⃣ Tree Species Analysis – Which Species Generates More Profit?
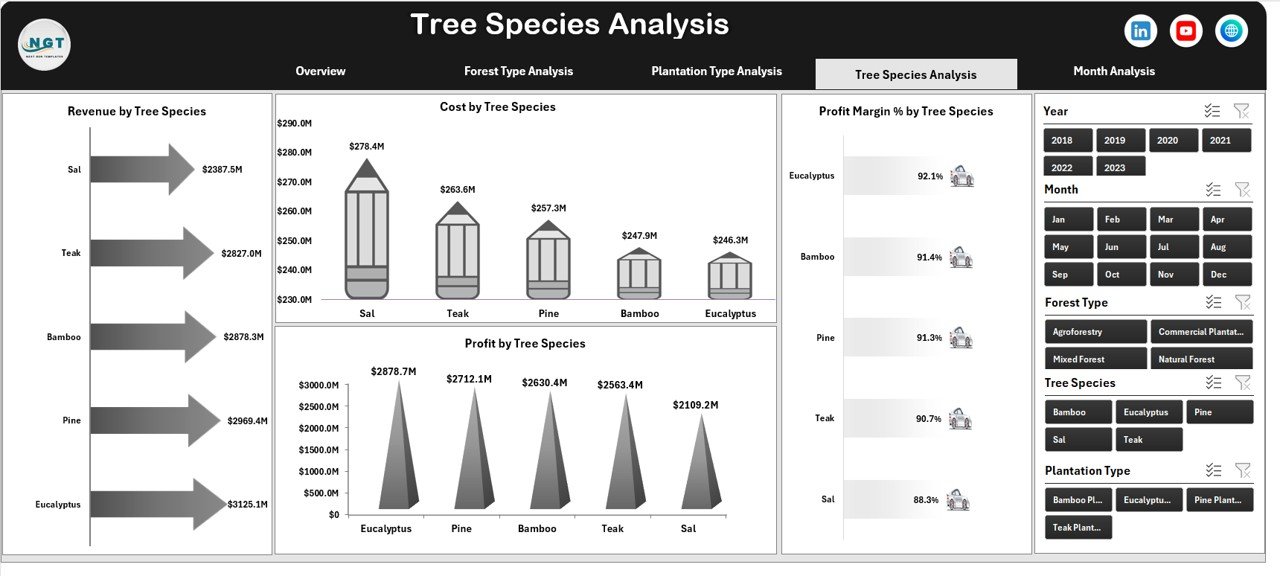
Different tree species produce different financial results. Therefore, species-level analysis becomes critical.
Examples of tree species:
-
Teak
-
Eucalyptus
-
Pine
-
Bamboo
-
Sal
🔹 Charts Included
-
Revenue by Tree Species
-
Cost by Tree Species
-
Profit Margin % by Tree Species
-
Profit by Tree Species
This page helps you:
-
Identify high-value species
-
Detect costly species
-
Plan future plantation decisions
As a result, you maximize forestry returns.
Click to Purchases Forestry Dashboard in Excel
5️⃣ Month Analysis – How Does Performance Change Over Time?
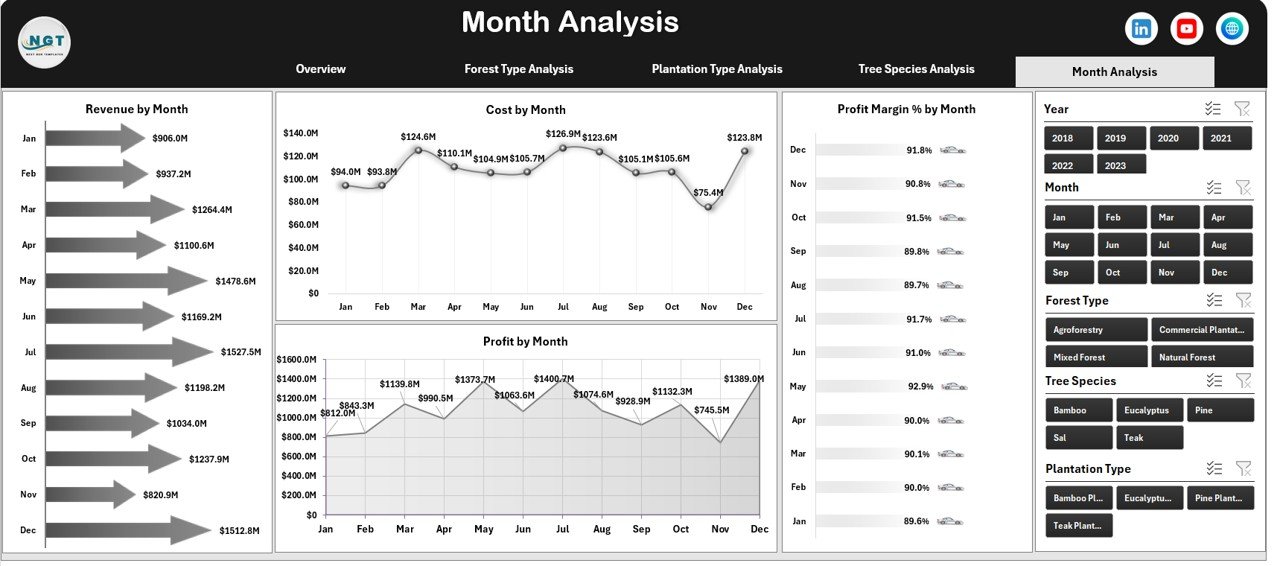
Monthly analysis allows trend tracking.
🔹 Charts Included
-
Revenue by Month
-
Cost by Month
-
Profit Margin % by Month
-
Profit by Month
Because forestry operations depend on seasons, this page becomes extremely important.
You can easily:
-
Track seasonal trends
-
Compare month-over-month performance
-
Identify cost spikes
Therefore, you improve planning accuracy.
What Does the Data Sheet Contain?
The Data Sheet stores raw data such as:
-
Date
-
Region
-
Forest Type
-
Plantation Type
-
Tree Species
-
Forest Manager
-
Harvested Area
-
Revenue
-
Cost
-
Profit
-
Profit Margin %
The dashboard uses Pivot Tables and Pivot Charts to analyze this data.
What Is the Support Sheet?
The Support Sheet stores:
-
Master lists
-
Drop-down values
-
Calculations
-
Helper columns
Because of this structured approach, the dashboard runs smoothly.
Click to Purchases Forestry Dashboard in Excel
Key KPIs Included in Forestry Dashboard in Excel
This dashboard focuses on powerful forestry KPIs:
-
Harvested Forest %
-
Total Revenue
-
Total Cost
-
Total Profit
-
Profit Margin %
-
Revenue by Region
-
Revenue by Species
-
Cost by Manager
-
Monthly Performance Trends
These KPIs help management measure operational success clearly.
Advantages of Forestry Dashboard in Excel
Using a Forestry Dashboard in Excel provides many benefits.
✅ 1. Centralized Data Management
You store all forestry data in one place.
✅ 2. Easy Performance Monitoring
You monitor revenue, cost, and profit instantly.
✅ 3. Better Decision Making
You compare forest types and plantation types clearly.
✅ 4. Cost Control
You identify high-cost regions and managers quickly.
✅ 5. Improved Profitability
You focus on high-margin species and regions.
✅ 6. Simple Excel-Based Solution
You do not require complex software.
✅ 7. Interactive Filtering
You use slicers to filter data instantly.
Because of these advantages, forestry managers gain strong control over operations.
Best Practices for the Forestry Dashboard in Excel
To get maximum value, follow these best practices.
🔹 1. Keep Data Clean
Always update data accurately. Avoid blank cells.
🔹 2. Use Structured Tables
Convert raw data into Excel tables.
🔹 3. Update Monthly
Enter new month data regularly.
🔹 4. Monitor Profit Margin
Focus more on margin than only revenue.
🔹 5. Use Filters Properly
Analyze performance by region and forest type.
🔹 6. Review Trends Regularly
Check monthly charts to detect changes early.
🔹 7. Train Your Team
Ensure managers understand dashboard usage.
When you follow these steps, the dashboard becomes a strong decision-making tool.
How Does Forestry Dashboard in Excel Improve Strategic Planning?
Because this dashboard provides deep insights, management can:
-
Allocate budget efficiently
-
Plan plantation expansion
-
Reduce operational cost
-
Improve harvesting efficiency
-
Optimize species selection
Therefore, long-term forestry planning becomes easier and more data-driven.
Conclusion
Forestry operations require structured monitoring. However, manual spreadsheets create confusion and delays. Therefore, companies need a powerful yet simple system.
The Forestry Dashboard in Excel solves this problem.
It combines:
-
Revenue analysis
-
Cost monitoring
-
Profit margin tracking
-
Forest type evaluation
-
Plantation type comparison
-
Tree species profitability
-
Monthly trend tracking
Moreover, it provides interactive slicers, pivot charts, and structured data sheets.
As a result, forestry managers gain full control over operations and profitability.
If you want better decisions, stronger financial visibility, and improved efficiency, this Forestry Dashboard in Excel becomes your ideal solution.
Frequently Asked Questions (FAQs)
❓ What is a Forestry Dashboard in Excel?
A Forestry Dashboard in Excel is a ready-to-use Excel template that tracks forestry revenue, cost, profit, and performance metrics using pivot charts.
❓ Who can use this Forestry Dashboard?
Forestry managers, plantation companies, environmental agencies, and timber businesses can use this dashboard.
❓ Do I need advanced Excel knowledge?
No. You only need basic Excel knowledge to update data and use slicers.
❓ Can I customize the dashboard?
Yes. You can add new KPIs, regions, or forest types based on your needs.
❓ How often should I update the dashboard?
You should update it monthly for accurate trend analysis.
❓ Does it support pivot charts only?
Yes. This dashboard uses pivot tables and pivot charts for all analysis.
Visit our YouTube channel to learn step-by-step video tutorials