Forestry management today demands accuracy, accountability, and transparency. Forest departments, plantation owners, sustainability managers, and environmental agencies continuously track planting activities, harvesting performance, conservation targets, and compliance metrics. However, when teams manage forestry data using scattered Excel files, monitoring performance becomes slow and confusing.
Therefore, a Forestry KPI Dashboard in Excel becomes an essential solution. It transforms raw forestry data into a clear, visual, and decision-ready format. Moreover, it helps organizations track Monthly-to-Date (MTD), Year-to-Date (YTD), targets, and previous-year performance in one structured workbook.
Click to Purchases Forestry KPI Dashboard in Excel
In this in-depth article, you will learn what a Forestry KPI Dashboard in Excel is, why it matters, how it works, its worksheet structure, key features, advantages, best practices, and frequently asked questions. Additionally, this guide explains how a ready-to-use Excel dashboard improves forest planning, sustainability tracking, and performance reporting.
What Is a Forestry KPI Dashboard in Excel?
A Forestry KPI Dashboard in Excel is a structured performance monitoring tool that tracks key forestry indicators using automated calculations, charts, and conditional formatting.
Instead of reviewing multiple spreadsheets, forest managers analyze all KPIs from a single dashboard. Moreover, Excel enables dynamic filtering, monthly comparisons, and year-over-year analysis without complex software.
This dashboard typically tracks KPIs such as:
-
🌲 Plantation area covered
-
🌱 Sapling survival rate
-
🪵 Timber yield
-
🔥 Fire incident rate
-
🌍 Carbon sequestration
-
♻️ Reforestation success
As a result, decision-makers gain instant visibility into forest performance.
Why Is a Forestry KPI Dashboard Important?
Forestry operations involve long-term planning and environmental responsibility. Therefore, managers must monitor performance regularly and accurately.
A Forestry KPI Dashboard in Excel helps because:
-
It centralizes all forestry KPIs in one file
-
It reduces manual reporting time
-
It improves data accuracy and consistency
-
It supports sustainability and compliance reporting
-
It enables faster and better decisions
Moreover, Excel dashboards remain cost-effective and easy to maintain, especially for government bodies and NGOs.
How Does a Forestry KPI Dashboard in Excel Work?
The Forestry KPI Dashboard works by connecting multiple structured worksheets into one automated reporting system.
Here is how it functions step by step:
-
Users enter actual performance data monthly
-
Users define targets and previous-year values
-
Excel formulas calculate MTD and YTD results
-
Conditional formatting highlights performance gaps
-
Charts and trends update automatically
As a result, users view real-time performance without manual calculations.
What Are the Key Worksheets in a Forestry KPI Dashboard in Excel?
This ready-to-use Forestry KPI Dashboard contains 7 structured worksheets, each designed for a specific purpose.
1. Home Sheet: How Does the Navigation Work?

The Home sheet acts as an index page for the entire dashboard.
Key Features of the Home Sheet
-
📌 Clean landing page
-
📌 6 navigation buttons
-
📌 One-click access to all major sheets
Therefore, users quickly move between dashboard, trends, inputs, and definitions without scrolling or searching.
2. Dashboard Sheet: What Does the Main Dashboard Show?
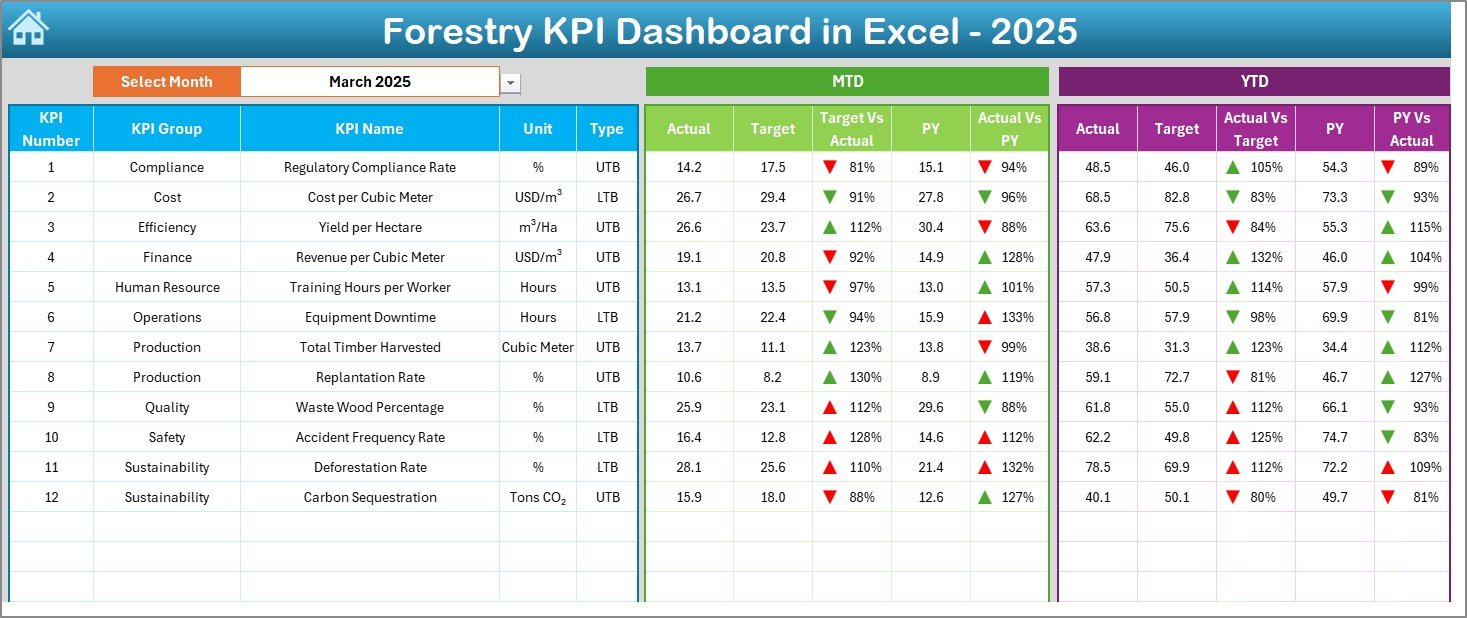
The Dashboard sheet serves as the heart of the Forestry KPI Dashboard.
Interactive Month Selection
-
📅 Month selector available at cell D3
-
Changing the month automatically updates all KPIs
KPIs Displayed on the Dashboard
The dashboard shows:
Monthly Performance (MTD)
-
MTD Actual
-
MTD Target
-
MTD Previous Year
-
Target vs Actual (with arrows)
-
Previous Year vs Actual (with arrows)
Yearly Performance (YTD)
Click to Purchases Forestry KPI Dashboard in Excel
-
YTD Actual
-
YTD Target
-
YTD Previous Year
-
Target vs Actual (with arrows)
-
Previous Year vs Actual (with arrows)
Visual Performance Indicators
-
🔼 Green arrows for improvement
-
🔽 Red arrows for underperformance
As a result, users immediately identify positive and negative trends.
3. KPI Trend Sheet: How Can You Analyze KPI Trends?
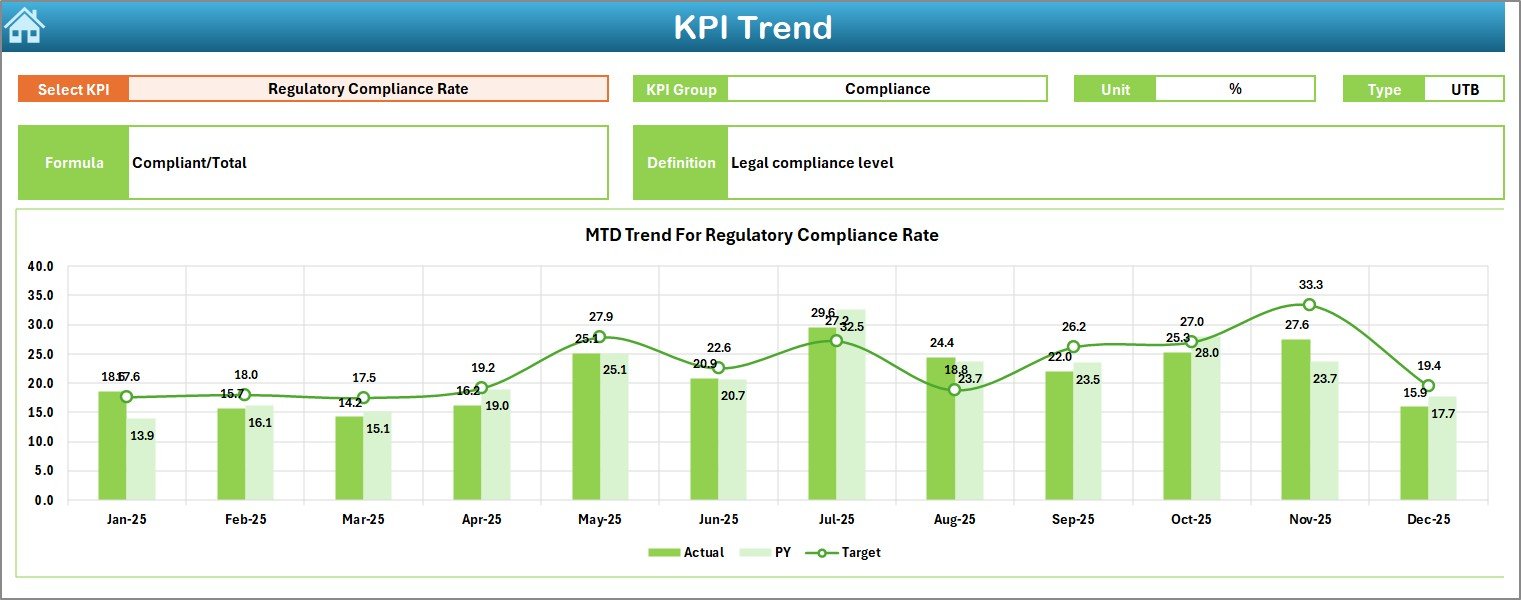
The KPI Trend sheet focuses on detailed KPI analysis over time.
KPI Selection
-
KPI selection dropdown available at cell C3
-
Users select one KPI at a time for deep analysis
KPI Information Displayed
For the selected KPI, the dashboard shows:
-
KPI Group
-
KPI Unit
-
KPI Type (LTB or UTB)
-
KPI Formula
-
KPI Definition
Trend Charts
-
📊 MTD trend chart (Actual, Target, PY)
-
📈 YTD trend chart (Actual, Target, PY)
Therefore, managers understand performance patterns instead of isolated numbers.
4. Actual Numbers Input Sheet: Where Do You Enter Actual Data?
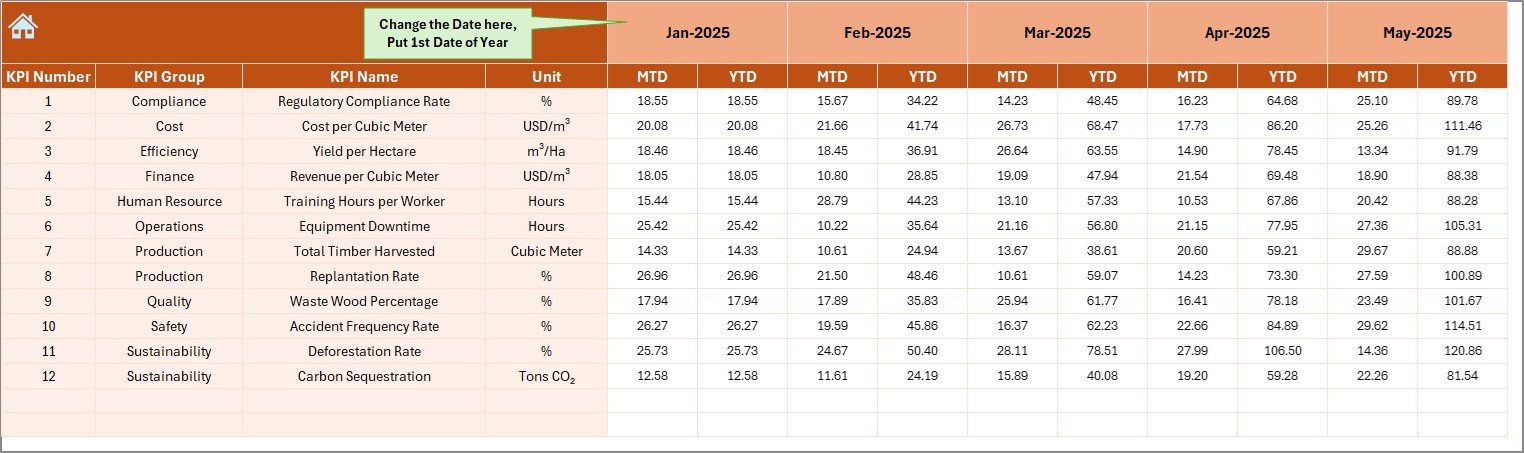
The Actual Numbers Input sheet captures real forestry performance.
How Data Entry Works
-
Select the first month of the year in cell E1
-
Enter MTD and YTD actual values for each KPI
-
Change months dynamically without breaking formulas
As a result, data entry stays structured and error-free.
5. Target Sheet: How Are KPI Targets Managed?
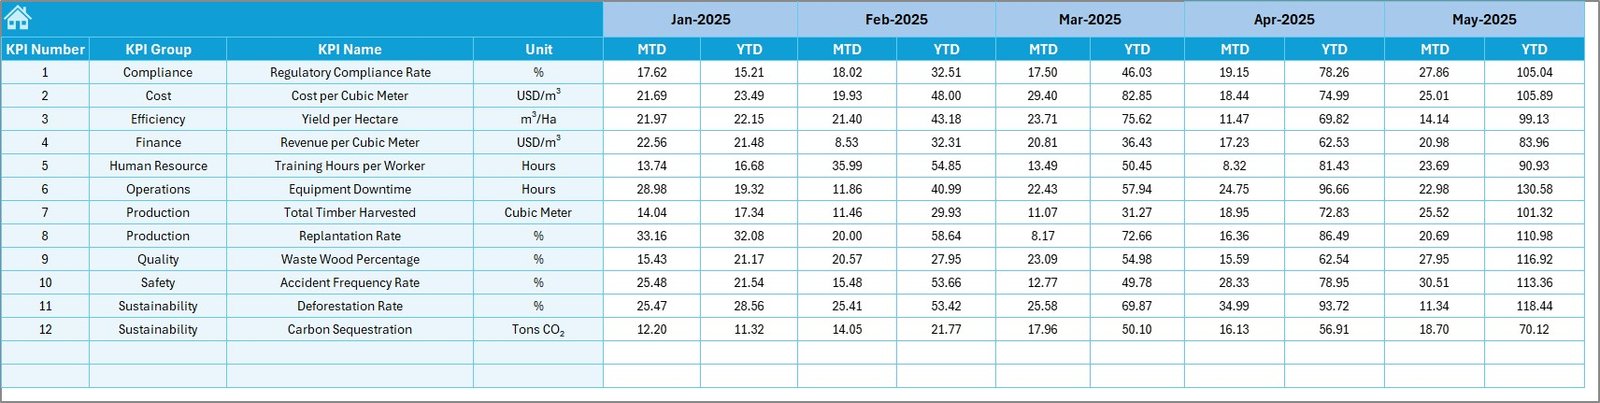
The Target sheet stores planned values for each KPI.
Target Data Entry
-
Enter MTD target values
-
Enter YTD target values
-
Maintain realistic and measurable goals
Moreover, separating targets ensures better planning and accountability.
6. Previous Year Number Sheet: Why Track Historical Data?
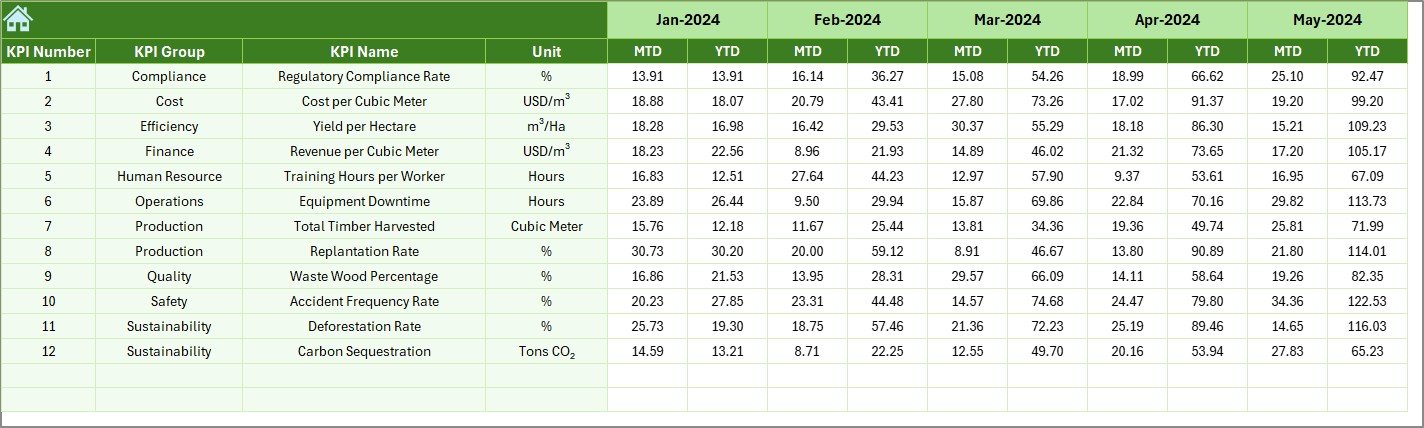
The Previous Year Number sheet stores last year’s performance data.
Benefits of Previous Year Comparison
-
Year-over-year performance tracking
-
Seasonal trend analysis
-
Better forecasting accuracy
Therefore, forestry teams evaluate progress instead of guessing performance.
Click to Purchases Forestry KPI Dashboard in Excel
7. KPI Definition Sheet: Why Is KPI Documentation Important?
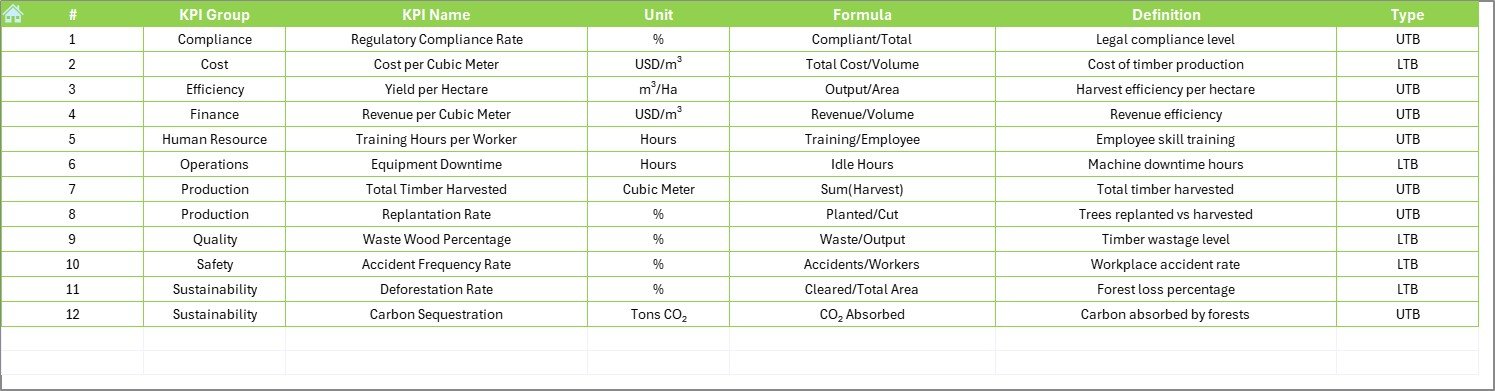
The KPI Definition sheet acts as the knowledge base of the dashboard.
Information Captured in This Sheet
-
KPI Name
-
KPI Group
-
Unit of Measurement
-
KPI Formula
-
KPI Definition
As a result, all users interpret KPIs consistently.
Advantages of a Forestry KPI Dashboard in Excel
A Forestry KPI Dashboard delivers multiple operational and strategic benefits.
Key Advantages
-
🌲 Centralized forestry performance tracking
-
📊 Automated MTD and YTD calculations
-
📉 Clear trend and variance analysis
-
⏱️ Reduced manual reporting effort
-
💰 No need for expensive BI tools
-
🌍 Supports sustainability reporting
Moreover, Excel dashboards remain flexible and scalable.
Who Should Use a Forestry KPI Dashboard in Excel?
This dashboard suits multiple stakeholders.
Ideal Users
-
Forest departments
-
Plantation managers
-
Environmental NGOs
-
Sustainability consultants
-
Government agencies
-
CSR and ESG teams
Therefore, any organization involved in forest management benefits from this tool.
Best Practices for the Forestry KPI Dashboard in Excel
To maximize value, follow these proven best practices.
1. Define KPIs Clearly
Always define KPIs with clear formulas and units. This practice avoids confusion and misinterpretation.
2. Update Data Regularly
Enter actual data monthly without delay. Timely updates ensure accurate MTD and YTD tracking.
3. Use Realistic Targets
Set achievable targets based on historical data and capacity. Unrealistic targets distort analysis.
4. Review Trends, Not Just Numbers
Focus on trend charts instead of isolated values. Trends reveal underlying performance patterns.
5. Protect Input Sheets
Apply sheet protection to avoid accidental formula changes.
6. Train Users Properly
Explain KPI definitions and dashboard navigation to all users. Knowledge improves adoption.
How Does This Dashboard Support Sustainability and ESG Goals?
Forestry plays a major role in environmental sustainability. Therefore, KPI tracking supports ESG initiatives.
This dashboard helps by:
-
Tracking reforestation progress
-
Monitoring carbon impact
-
Measuring conservation efficiency
-
Supporting regulatory reporting
As a result, organizations align forestry operations with sustainability goals.
Why Choose Excel for a Forestry KPI Dashboard?
Click to Purchases Forestry KPI Dashboard in Excel
Excel remains a powerful choice because:
-
Almost everyone already uses Excel
-
It requires no coding skills
-
It supports automation and visualization
-
It allows offline access
-
It integrates easily with other systems
Therefore, Excel delivers simplicity with power.
Conclusion: Is a Forestry KPI Dashboard in Excel Worth Using?
Absolutely.
A Forestry KPI Dashboard in Excel transforms complex forestry data into actionable insights. It simplifies performance tracking, improves transparency, and supports sustainable decision-making. Moreover, its structured worksheets, automated calculations, and visual indicators make it ideal for forestry teams of all sizes.
By using this ready-to-use dashboard, organizations save time, improve accuracy, and manage forests more responsibly.
Frequently Asked Questions (FAQs)
1. What is the main purpose of a Forestry KPI Dashboard in Excel?
The main purpose is to monitor forestry performance using MTD, YTD, target, and previous-year comparisons in one dashboard.
2. Can beginners use this Forestry KPI Dashboard?
Yes. The dashboard uses simple Excel features and clear navigation, making it beginner-friendly.
3. Can I customize KPIs in the dashboard?
Yes. You can add, remove, or modify KPIs using the KPI Definition sheet.
4. Does this dashboard support year-over-year analysis?
Yes. The Previous Year Number sheet enables direct comparison with last year’s performance.
5. Can this dashboard support sustainability reporting?
Yes. It helps track forestry sustainability metrics such as plantation success, conservation, and environmental impact.
6. Do I need advanced Excel skills to use this dashboard?
No. Basic Excel knowledge is sufficient to use and maintain the dashboard effectively.
Visit our YouTube channel to learn step-by-step video tutorials