In today’s fast-moving global economy, foreign exchange (Forex) services play a critical role in international trade, remittances, investments, and financial transactions. Financial institutions, currency exchange companies, and brokerage firms process thousands of currency conversions daily. However, managing forex operations without structured analytics often leads to reporting delays, hidden inefficiencies, and missed business opportunities.
Therefore, organizations increasingly adopt business intelligence tools to monitor forex performance effectively. One powerful solution is the Forex Services Dashboard in Power BI — a modern, interactive analytics system that transforms complex forex transaction data into meaningful visual insights.
In this comprehensive guide, you will learn everything about the Forex Services Dashboard in Power BI, including its features, structure, benefits, implementation approach, best practices, and frequently asked questions.
Click to Purchases Forex Services Dashboard in Power BI
What Is a Forex Services Dashboard in Power BI?
A Forex Services Dashboard in Power BI is an interactive reporting solution designed to track, analyze, and optimize foreign exchange operations using Key Performance Indicators (KPIs) and visual analytics.
Instead of reviewing multiple spreadsheets and manual reports, decision-makers can monitor transactions, service fees, customer behavior, and regional performance in a single dashboard.
Because Power BI enables real-time filtering and dynamic visualization, users can instantly analyze trends and make faster decisions.
Why Do Forex Businesses Need a Dashboard?
Forex operations generate large volumes of transactional data. Without analytics, teams struggle to understand performance clearly.
A Power BI dashboard helps organizations:
-
Monitor transaction performance in real time
-
Analyze revenue through service fees
-
Compare branch and channel performance
-
Track customer behavior patterns
-
Identify growth opportunities quickly
As a result, management improves operational efficiency and profitability.
Why Choose Power BI for Forex Analytics?
Power BI offers advanced analytics capabilities while remaining easy to use. Therefore, it becomes an ideal platform for financial dashboards.
Key Reasons to Use Power BI
-
Interactive and dynamic dashboards
-
Automated data refresh
-
Powerful visualization tools
-
Easy filtering using slicers
-
Drill-down analysis capability
-
Integration with Excel and databases
Moreover, Power BI allows decision-makers to explore data visually rather than manually calculating results.
Structure of the Forex Services Dashboard in Power BI
Click to Purchases Forex Services Dashboard in Power BI
This Forex Services Dashboard contains five interactive pages, each designed to analyze a specific aspect of forex operations.
Let’s explore each page in detail.
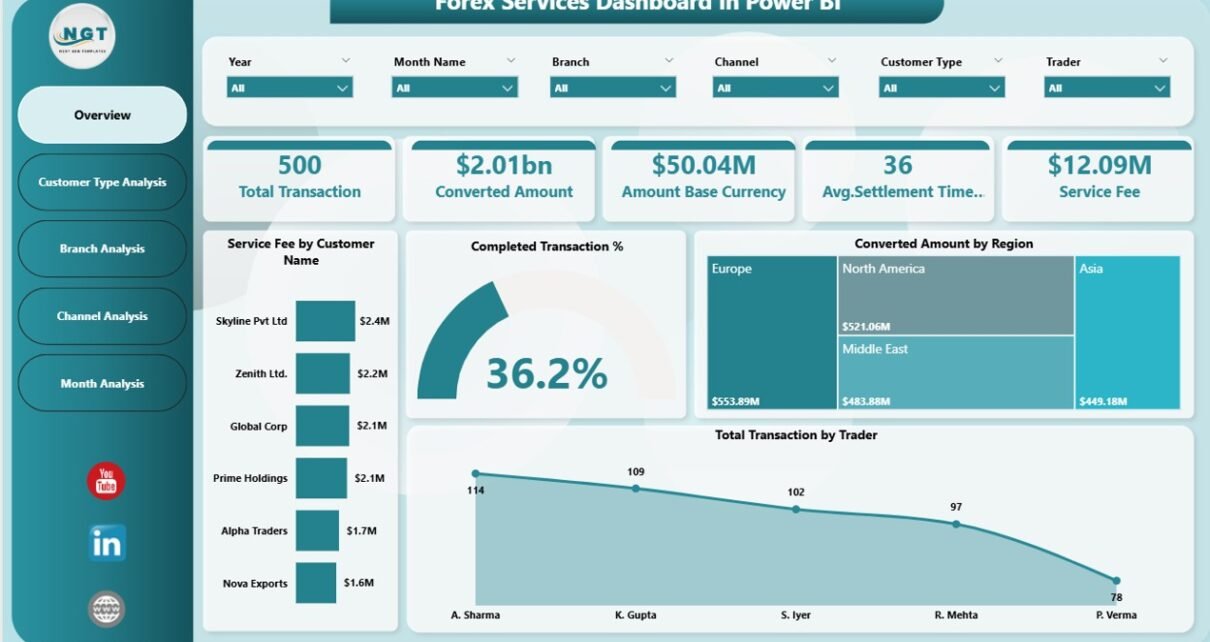
1. Overview Page – How Does the Dashboard Provide a Quick Performance Snapshot?
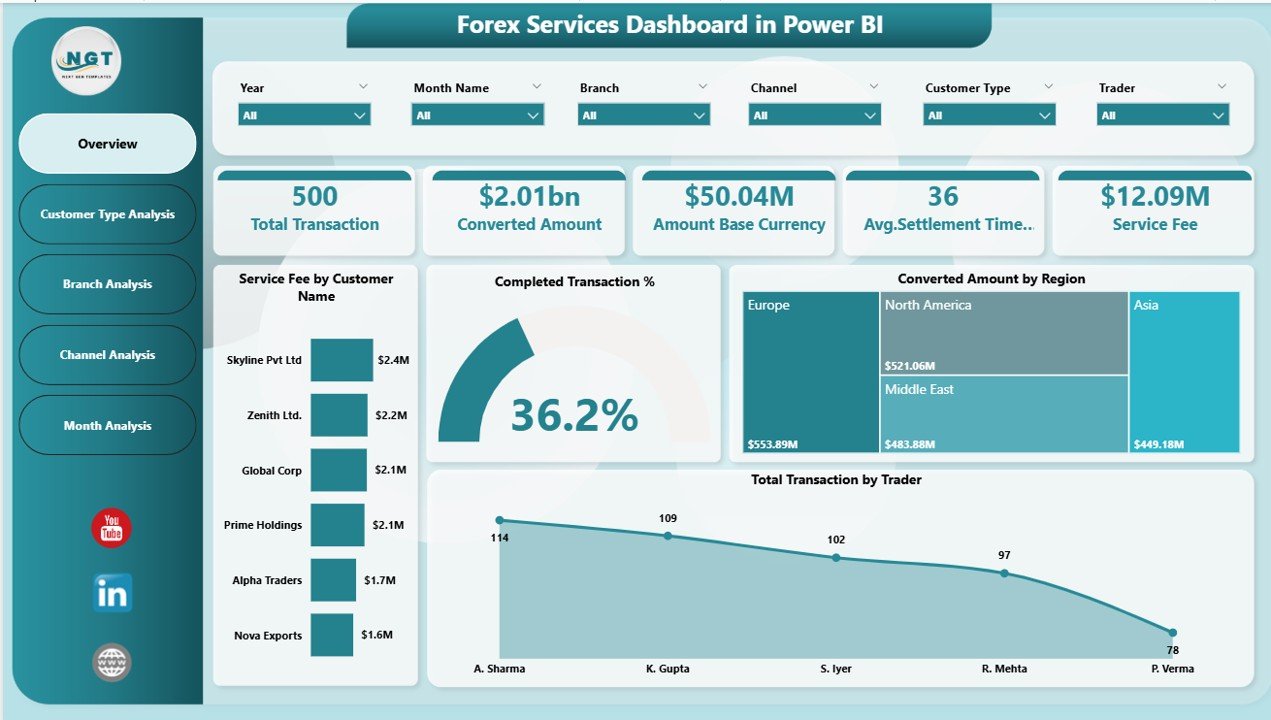
The Overview Page acts as the central monitoring hub of the dashboard. Users immediately understand overall forex performance from this page.
Key KPI Cards
The dashboard displays five important KPI cards:
-
Service Fee by Customer Name – Shows revenue contribution from customers.
-
Completed Transaction % – Indicates operational efficiency.
-
Conversed Amount by Region – Displays regional transaction volume.
-
Total Transaction by Trader – Measures trader performance.
-
Overall Business Snapshot – Provides quick operational insights.
Why Is the Overview Page Important?
Because executives need quick insights, this page helps them:
-
Identify high-value customers
-
Monitor conversion performance
-
Track regional activity instantly
-
Evaluate trader productivity
Consequently, leadership teams can make faster strategic decisions.
2. Customer Type Analysis – How Do Different Customer Segments Perform?
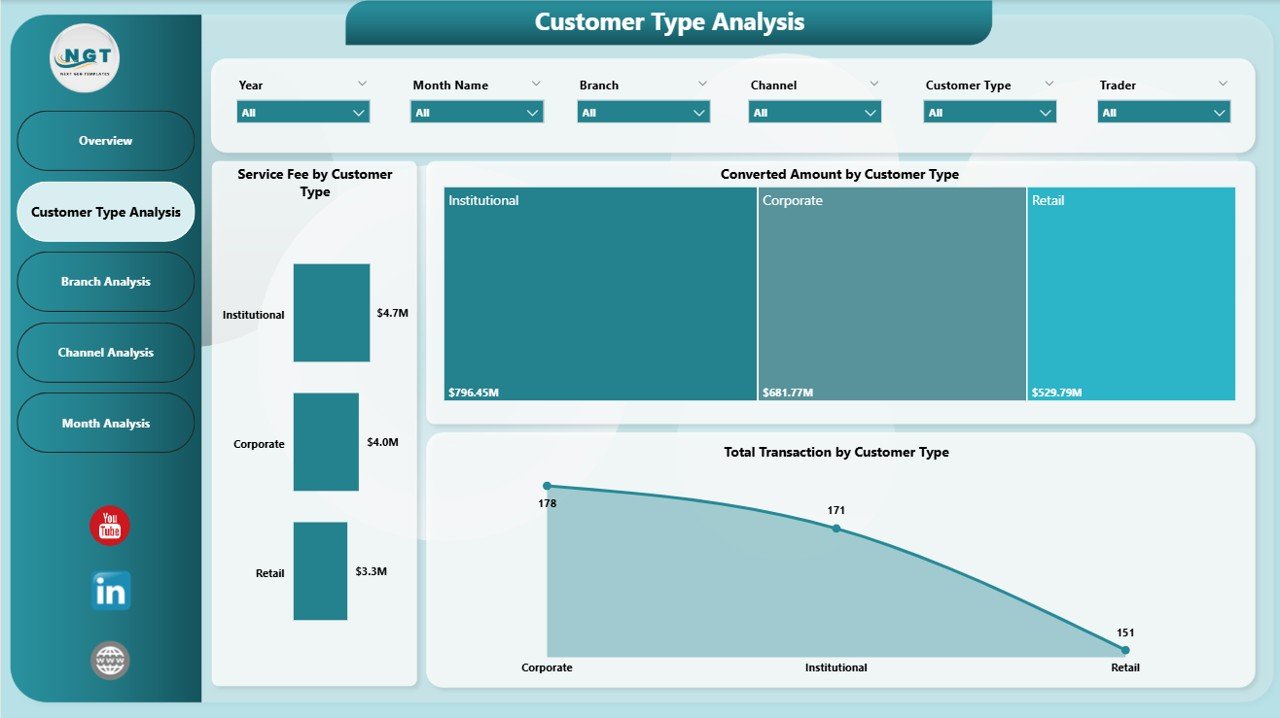
Customer segmentation plays a crucial role in forex profitability. Therefore, the dashboard includes a dedicated Customer Type Analysis page.
Charts Available
-
Service Fee by Customer Type
-
Conversed Amount by Customer Type
-
Total Transaction by Customer Type
Insights You Can Gain
Using this page, organizations can:
-
Identify profitable customer categories
-
Understand transaction behavior
-
Optimize pricing strategies
-
Improve targeted marketing campaigns
For example, corporate clients may generate higher transaction volumes, while retail customers may contribute frequent smaller transactions.
Click to Purchases Forex Services Dashboard in Power BI
3. Branch Analysis – Which Branch Performs the Best?
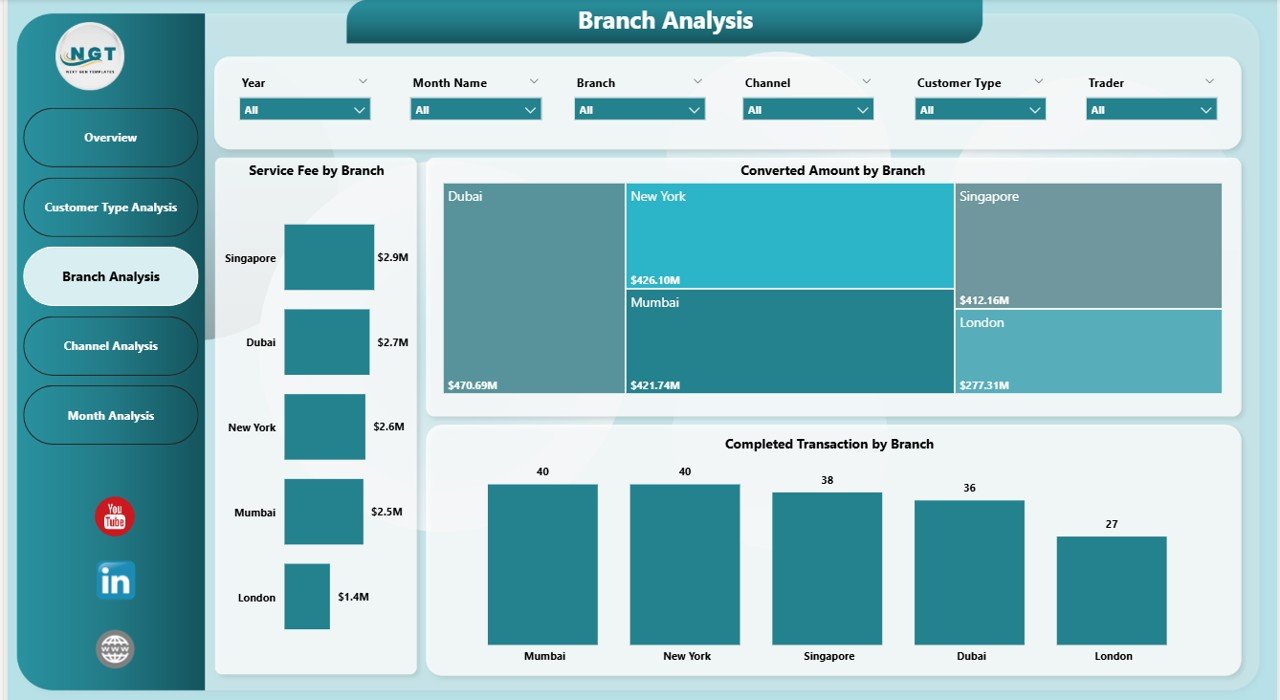
Forex businesses often operate across multiple branches. However, comparing performance manually consumes time.
The Branch Analysis Page solves this challenge.
Key Visualizations
-
Service Fee by Branch
-
Conversed Amount by Branch
-
Total Completed Transaction by Branch
Business Benefits
This analysis helps management:
-
Compare branch efficiency
-
Identify top-performing locations
-
Detect underperforming branches
-
Allocate resources effectively
As a result, organizations improve operational consistency across locations.
4. Channel Analysis – Which Transaction Channels Drive Revenue?
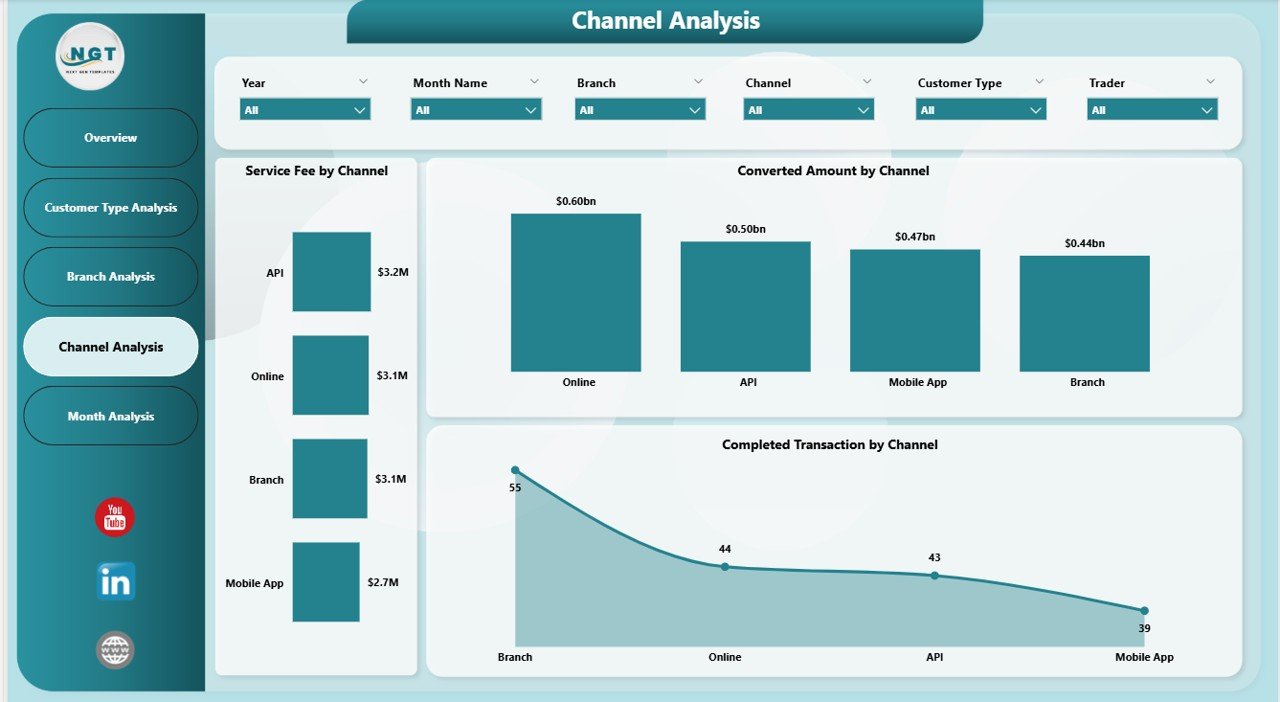
Customers use multiple channels for forex transactions, such as online platforms, agents, or branch counters. Therefore, analyzing channels becomes essential.
Dashboard Charts
-
Service Fee by Channel
-
Conversed Amount by Channel
-
Total Completed Transaction by Channel
Why Channel Analysis Matters
Channel performance analysis allows businesses to:
-
Evaluate digital adoption trends
-
Improve online transaction strategies
-
Reduce operational costs
-
Enhance customer convenience
Moreover, companies can invest more in high-performing channels.
5. Month Analysis – How Does Forex Performance Change Over Time?
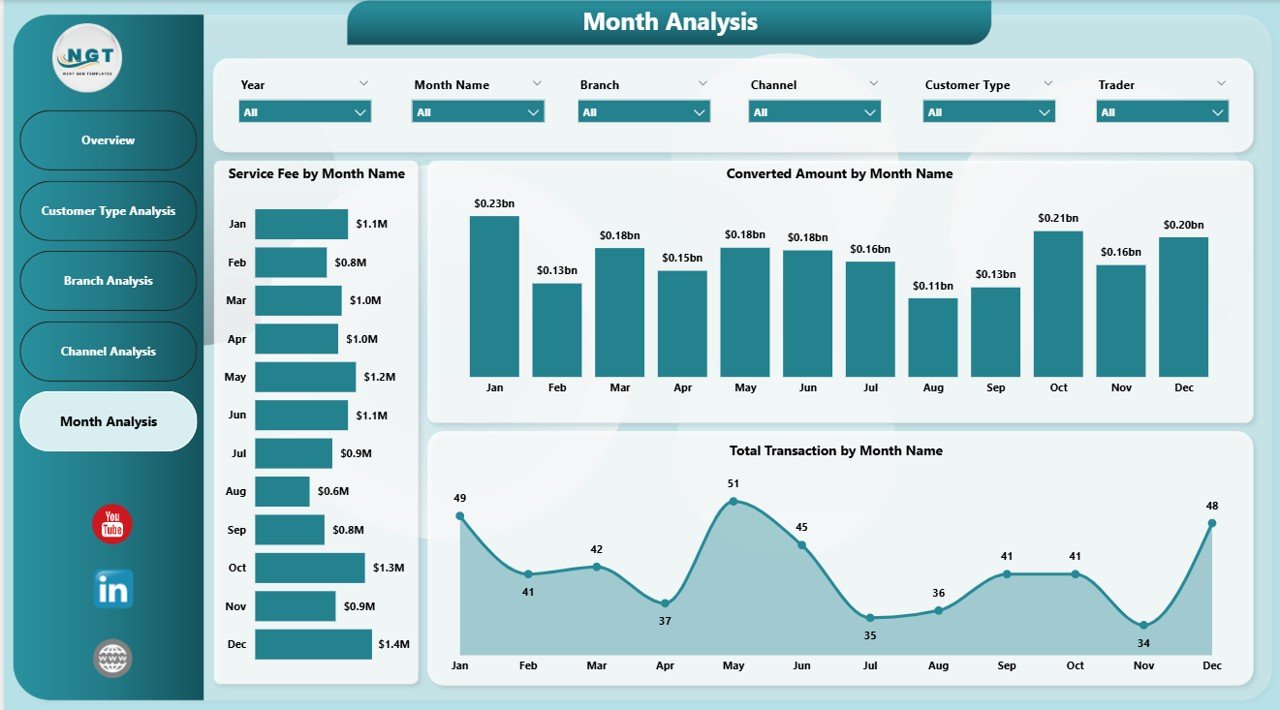
Trend analysis helps organizations understand seasonal patterns and growth opportunities.
The Month Analysis Page focuses on time-based performance tracking.
Charts Included
-
Service Fee by Month Name
-
Conversed Amount by Month Name
-
Total Transaction by Month Name
Insights Provided
This page helps users:
-
Identify peak transaction months
-
Track revenue trends
-
Forecast future demand
-
Plan operational capacity
Therefore, management can prepare better financial strategies.
Key KPIs Tracked in the Forex Services Dashboard
A strong dashboard relies on meaningful KPIs. This solution tracks several critical forex metrics.
Operational KPIs
-
Total Transactions
-
Completed Transaction Percentage
-
Trader Performance
-
Channel Efficiency
Financial KPIs
-
Service Fee Revenue
-
Currency Conversion Volume
-
Regional Contribution
-
Customer Profitability
Because these KPIs update dynamically, users always view current performance.
Advantages of Forex Services Dashboard in Power BI
Organizations gain multiple benefits after implementing this dashboard.
🚀 Improved Decision Making
Managers access real-time insights instead of waiting for reports.
📊 Centralized Data Visibility
All forex data appears in one interactive platform.
⏱ Time Savings
Automation reduces manual reporting work.
💰 Revenue Optimization
Businesses identify high-profit customers and channels.
🌍 Better Regional Analysis
Companies understand geographic performance quickly.
📈 Performance Transparency
Teams monitor traders, branches, and channels clearly.
How Does the Dashboard Improve Forex Business Operations?
The dashboard enhances daily operations in several ways.
1. Faster Reporting
Instead of creating reports manually, Power BI generates visuals automatically.
2. Accurate Monitoring
Data-driven tracking reduces human errors.
3. Strategic Planning
Managers analyze historical trends before making decisions.
4. Customer Insights
Businesses understand customer behavior more deeply.
Who Can Benefit from a Forex Services Dashboard?
Click to Purchases Forex Services Dashboard in Power BI
This dashboard serves multiple roles within financial organizations.
Financial Institutions
Banks and exchange companies monitor currency transactions effectively.
Forex Brokers
Brokers analyze trader performance and transaction volumes.
Operations Managers
Managers track workflow efficiency.
Business Analysts
Analysts perform deep performance analysis.
Executives
Leadership teams gain strategic insights quickly.
How to Implement a Forex Services Dashboard in Power BI?
Implementation becomes simple when organizations follow a structured approach.
Step 1: Collect Data
Gather transaction data, customer details, branch information, and service fees.
Step 2: Clean and Prepare Data
Remove duplicates and standardize formats.
Step 3: Load Data into Power BI
Import datasets using Power Query.
Step 4: Create Data Model
Build relationships between tables.
Step 5: Design Visualizations
Add KPI cards, charts, and slicers.
Step 6: Publish Dashboard
Share reports securely across teams.
Best Practices for the Forex Services Dashboard in Power BI
Following best practices ensures maximum dashboard effectiveness.
✅ Keep Visuals Simple
Avoid overcrowded visuals. Clear charts improve understanding.
✅ Use Meaningful KPIs
Focus only on metrics that support decision-making.
✅ Apply Consistent Formatting
Maintain consistent colors and layout.
✅ Enable Interactive Filters
Use slicers for quick analysis.
✅ Schedule Data Refresh
Keep dashboards updated automatically.
✅ Monitor Data Quality
Accurate data ensures reliable insights.
Common Challenges in Forex Analytics (and How the Dashboard Solves Them)
Challenge 1: Data Scattered Across Systems
Solution: Centralized Power BI reporting.
Challenge 2: Slow Decision Making
Solution: Real-time visual insights.
Challenge 3: Manual Reporting Errors
Solution: Automated calculations.
Challenge 4: Lack of Performance Visibility
Solution: Multi-dimensional analysis pages.
Future Trends in Forex Analytics
Forex analytics continues to evolve rapidly.
Emerging Trends
-
AI-driven forecasting
-
Real-time currency risk analysis
-
Predictive transaction analytics
-
Automated anomaly detection
-
Cloud-based reporting systems
Power BI integrates easily with these technologies, making dashboards future-ready.
How Does This Dashboard Support Data-Driven Culture?
Organizations succeed when decisions rely on data rather than assumptions.
This dashboard encourages:
-
Analytical thinking
-
Performance accountability
-
Continuous improvement
-
Transparent reporting
Consequently, teams collaborate more effectively.
Conclusion
The Forex Services Dashboard in Power BI provides a powerful and practical solution for managing forex operations using data-driven insights. Instead of relying on manual reports, organizations gain real-time visibility into transactions, service fees, customer segments, branches, and channels.
Moreover, interactive analytics help businesses identify opportunities, optimize operations, and increase profitability. Because the dashboard combines automation, visualization, and performance tracking, it becomes an essential tool for modern forex service providers.
Organizations that adopt analytics-driven dashboards not only improve efficiency but also strengthen strategic decision-making.
Frequently Asked Questions (FAQs)
1. What is a Forex Services Dashboard in Power BI?
It is an interactive analytics dashboard that tracks forex transactions, service fees, customer performance, and operational KPIs using Power BI visualizations.
2. Who should use this dashboard?
Banks, forex brokers, exchange companies, analysts, and financial managers can use it.
3. Can beginners use this dashboard?
Yes. Power BI dashboards provide user-friendly navigation and filtering options.
4. Does the dashboard support real-time data?
Yes, scheduled refresh enables near real-time monitoring.
5. What data is required to build this dashboard?
You need transaction data, customer details, branch information, channel data, and service fee records.
6. How does it improve decision-making?
It provides visual insights that help managers identify trends and performance gaps quickly.
7. Can the dashboard be customized?
Yes, organizations can modify KPIs, visuals, and filters according to business needs.
Visit our YouTube channel to learn step-by-step video tutorials