Freelancer Business Dashboard in Power BI is a powerful, ready-to-use analytics template designed for freelancers, solopreneurs, independent consultants, and small business owners who want to gain complete visibility into their business performance. This Power BI dashboard provides 5 interactive pages that let you track revenue, costs, profitability, client relationships, project performance, and payment trends — all from a single dynamic report. Whether you are a graphic designer managing projects across multiple platforms, a software developer tracking billable hours, or a marketing consultant analyzing client profitability, this template gives you the data-driven edge you need to grow your freelance business confidently.
Built with professional visuals, dynamic KPI cards, and advanced slicer-based filtering, this Freelancer Business Dashboard in Power BI eliminates the guesswork from your business decisions. You can analyze which clients bring the highest revenue, which service categories generate the best profit margins, which platforms deliver the most projects, and how your monthly revenue trends are shaping up over time. If you prefer working in spreadsheets, you can also explore the Freelancer Business Dashboard in Excel or the Freelance Business KPI Scorecard in Google Sheets.
Key Features of Freelancer Business Dashboard in Power BI
- 5 Interactive Dashboard Pages – Overview, Client Analysis, Project Insights, Payment Tracking, and Revenue Trend pages provide comprehensive freelance business analytics from every angle.
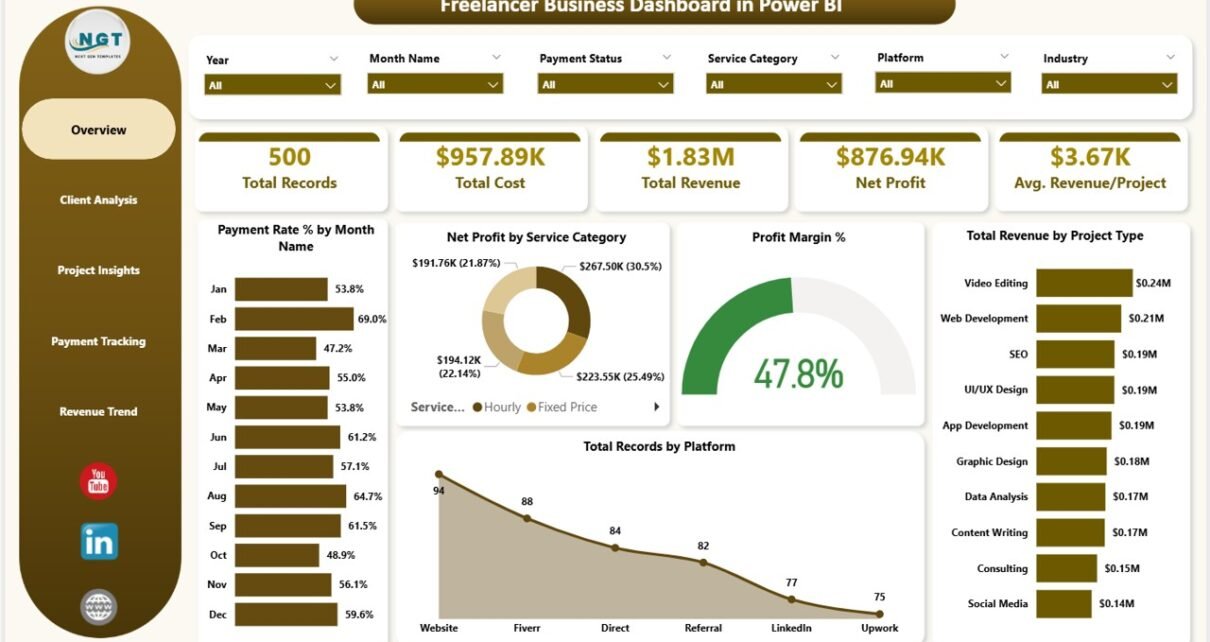
- 5 Dynamic KPI Cards – The overview page displays Total Records, Total Cost, Total Revenue, Net Profit, and Avg. Revenue/Project so you can monitor top-level metrics at a glance.
- Advanced Slicers and Filters – Filter the entire dashboard instantly by service category, project type, platform, payment status, client name, month, and more for targeted drill-down analysis.
- Client-Level Revenue and Cost Analysis – Identify your most valuable clients and most profitable service categories with detailed breakdowns.
- Multi-Platform Tracking – Compare performance across Upwork, Fiverr, Toptal, direct clients, and other freelance platforms.
- Payment Status Monitoring – Track paid, pending, and overdue payments with profit margin analysis by payment status.
- Monthly Revenue Trends – Visualize income patterns over time to forecast earnings and plan for seasonal fluctuations.
- No DAX Knowledge Required – Simply replace the sample data, click Refresh, and everything updates automatically.
Dashboard Pages Explanation
1. Overview Page
The Overview page serves as the central command center for your freelance business data. At the top, you will find 5 high-level KPI cards displaying Total Records, Total Cost, Total Revenue, Net Profit, and Avg. Revenue/Project. These cards give you an instant snapshot of your overall business health. Below the cards, the page features several analytical charts including Payment Rate % by Month Name which shows your payment collection efficiency over time, Net Profit by Service Category which reveals which types of services generate the most profit, Profit Margin % which tracks your overall profitability ratio, Total Revenue by Project Type which breaks down income by project classification, and Total Records by Platform which shows how your workload is distributed across freelance platforms. Multiple slicers are available on this page to filter all visuals simultaneously for quick, targeted analysis.
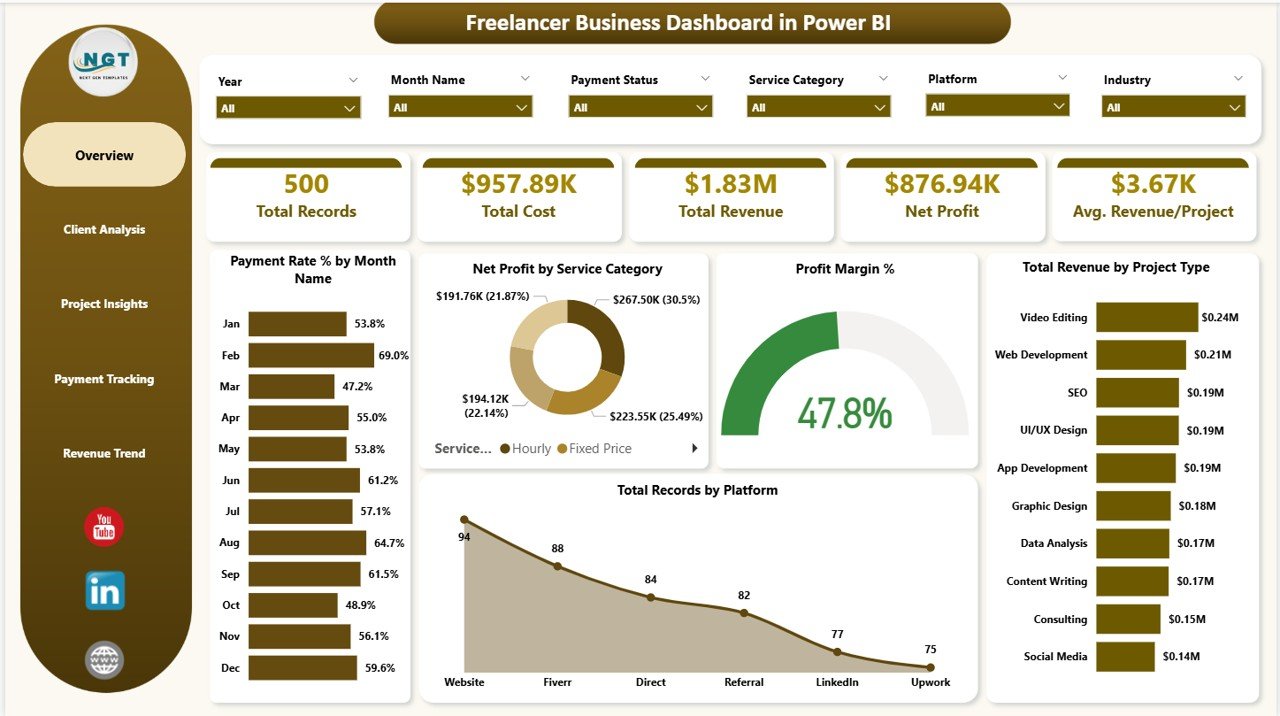
Freelancer Business Dashboard in Power BI
2. Client Analysis
The Client Analysis page dives deeper into your client relationships with detailed revenue and cost breakdowns. This page features Total Revenue by Client Name which ranks your clients from highest to lowest revenue contribution, Total Cost by Client Name which shows the cost associated with serving each client, and Profit Margin % by Service Category which helps you understand which services are most profitable when working with different clients. This page is essential for identifying which client relationships deserve more attention and which ones may need renegotiation. For related client tracking tools, check out the Freelancer Business Dashboard in Excel blog post.
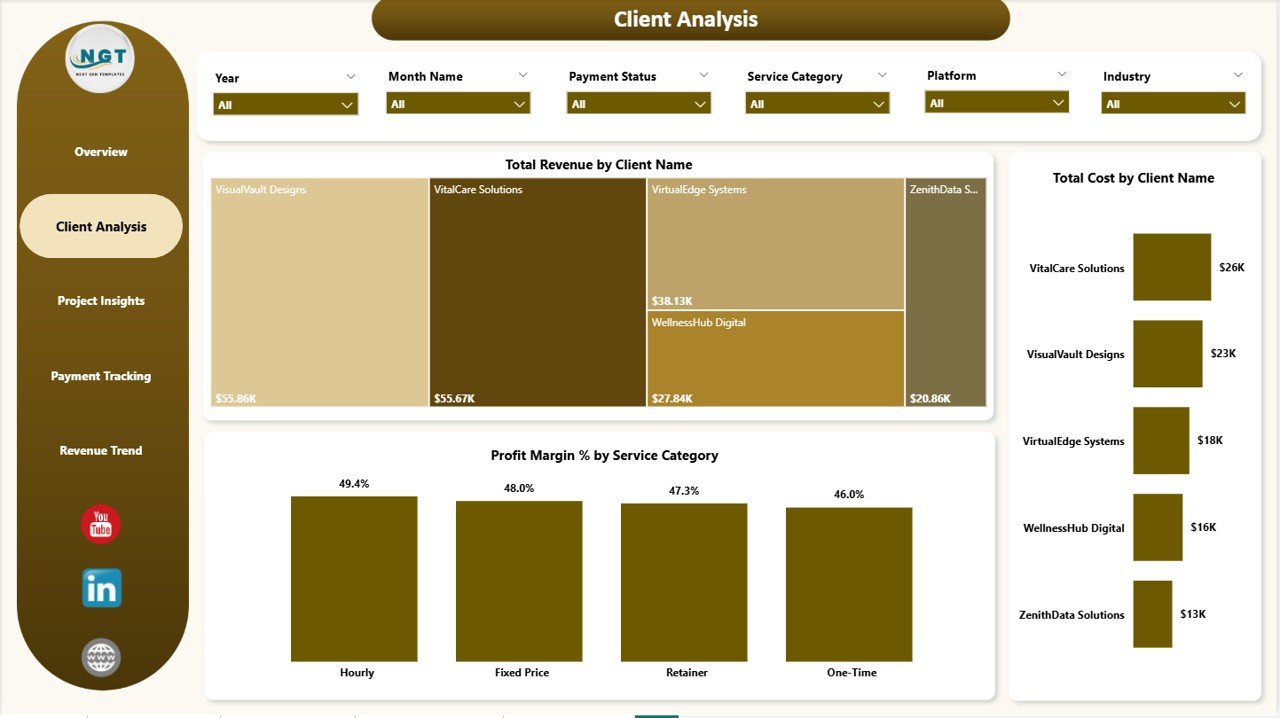
Client Analysis
3. Project Insights
The Project Insights page focuses on understanding your project economics and time allocation. It displays Total Cost by Project Type so you can see which project categories consume the most resources, Total Hours by Project Type which reveals where you spend most of your working time, and Net Profit by Platform which compares profitability across different freelancing platforms. This page helps freelancers make informed decisions about which types of projects to pursue and which platforms to prioritize for maximum return on time invested.
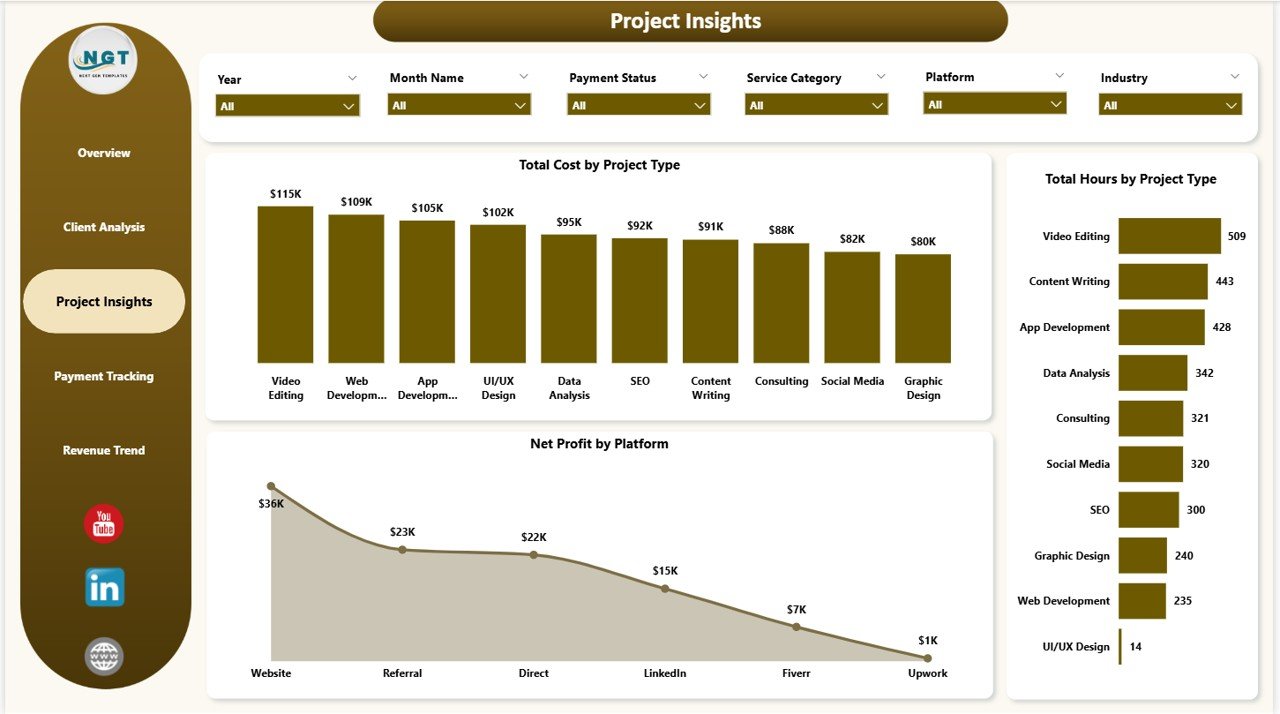
Project Insights
4. Payment Tracking
The Payment Tracking page is dedicated to monitoring your cash flow and payment collection performance. It includes Total Cost by Payment Status which segments costs by whether payments are completed, pending, or overdue, Profit Margin % by Payment Status which shows how profitability varies based on payment collection, and Avg. Client Rating by Payment Method which correlates client satisfaction with how they pay. This page is invaluable for freelancers who want to improve their invoicing workflows and reduce outstanding receivables. You may also find the Personal Finance Dashboard in Power BI useful for tracking personal finances alongside your business.
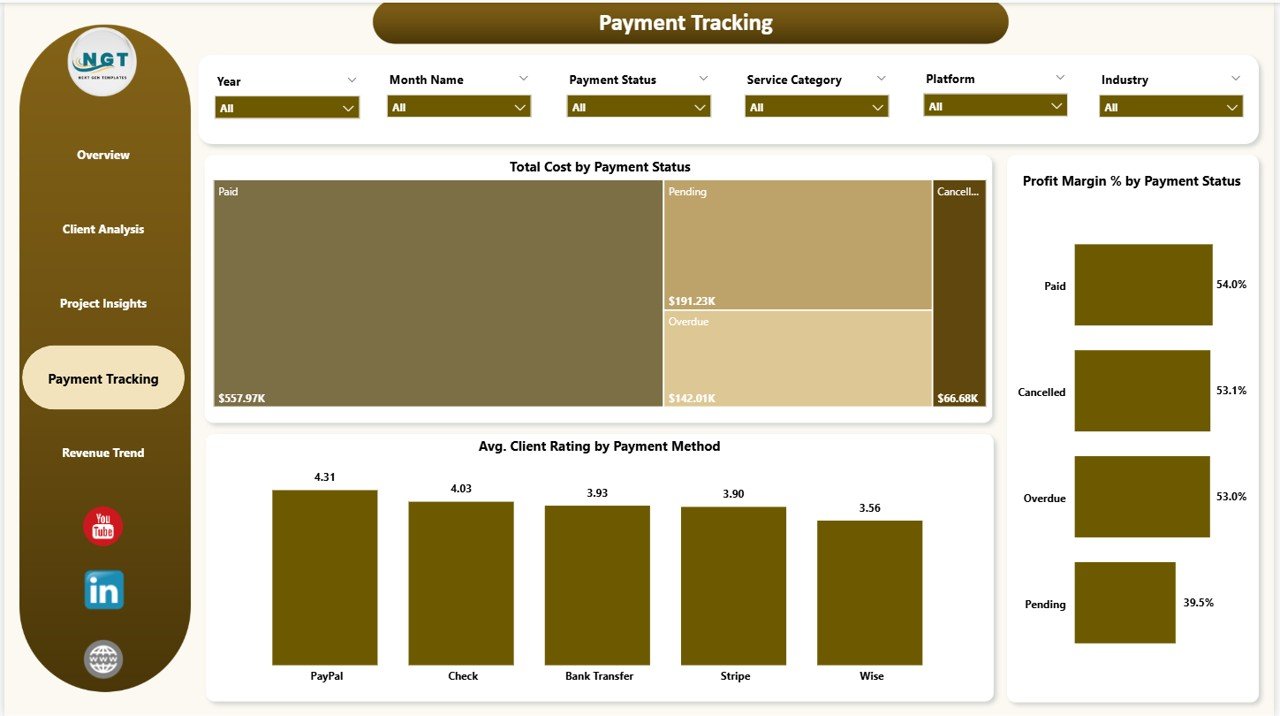
Payment Tracking
5. Revenue Trend
The Revenue Trend page provides time-based and segment-based revenue analysis to help you spot growth patterns. It shows Total Revenue by Month Name which tracks your monthly income trajectory, Total Revenue by Platform which compares how much revenue each freelancing platform generates over time, and Avg. Revenue/Project by Industry which reveals which industries pay the most per project on average. This page is perfect for forecasting future earnings, identifying seasonal patterns, and deciding which industries to target for higher-value projects.
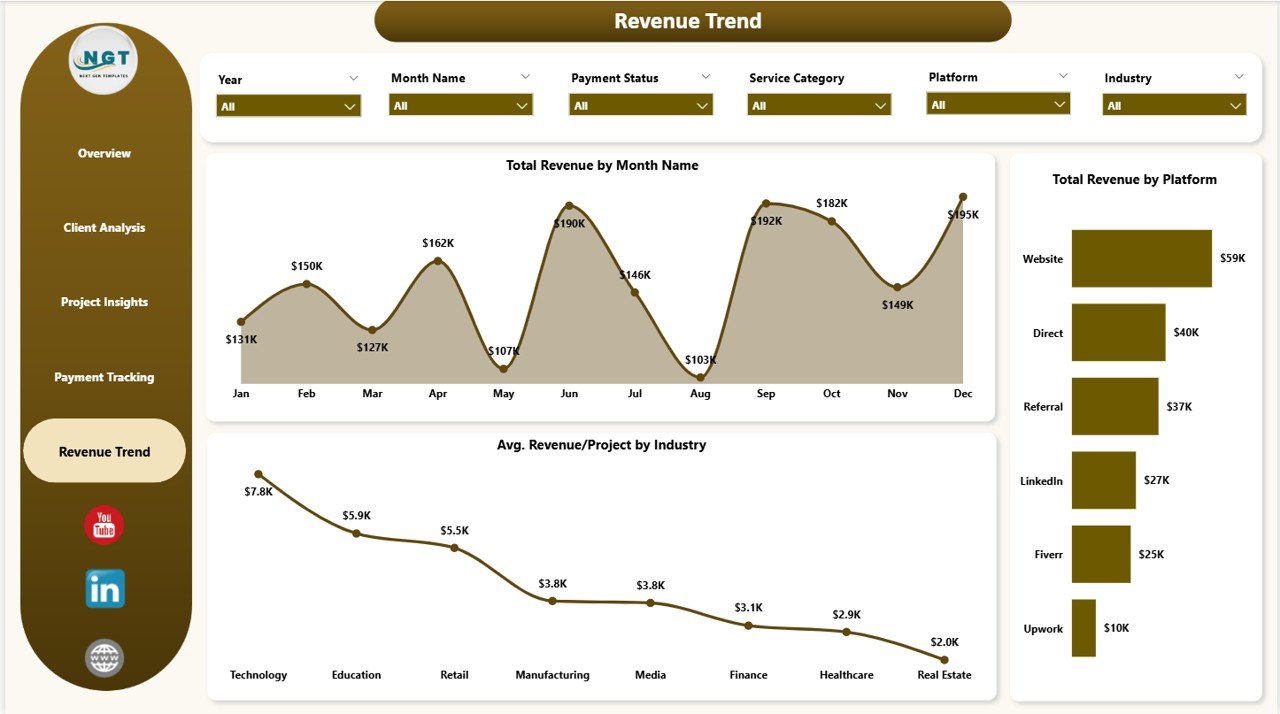
Revenue Trend
Advantages of Freelancer Business Dashboard in Power BI
- Complete Business Visibility – Monitor revenue, costs, profitability, client performance, and payment status from a single interactive report instead of juggling multiple spreadsheets.
- Data-Driven Decision Making – Identify your most profitable clients, best-performing platforms, and highest-revenue service categories with visual analytics rather than gut feelings.
- Time Savings – Replace hours of manual data crunching with automatic chart updates and slicer-based filtering that delivers instant insights.
- Professional Presentations – Use the polished dashboard visuals for client meetings, tax preparation, or business reviews without creating separate presentation materials.
- Scalable Analytics – Power BI handles large datasets efficiently, so your dashboard grows with your freelance business without performance degradation.
Opportunities for Improvement
- Goal Tracking – Adding monthly or quarterly revenue targets with progress indicators would help freelancers measure actual performance against their business goals.
- Time Utilization Rate – Including a billable vs. non-billable hours ratio would give deeper insight into how effectively freelancers are using their time.
- Client Retention Analysis – A repeat client rate metric would help freelancers understand their client loyalty and lifetime value trends.
- Expense Category Breakdown – Adding granular expense categories (software, travel, marketing) would make the cost analysis more actionable for tax planning.
Best Practices
- Update Data Weekly – Keep your dashboard current by adding new project records at least once a week for accurate trend analysis.
- Use Platform Codes Consistently – Standardize your platform names (e.g., always use “Upwork” instead of mixing “upwork” and “UpWork”) for clean slicer filtering.
- Review Client Profitability Monthly – Use the Client Analysis page at least monthly to identify underperforming client relationships early.
- Track Payment Status Actively – Monitor the Payment Tracking page to follow up on overdue invoices before they become collection problems.
- Compare Across Platforms – Use the Revenue Trend page to regularly compare platform performance and allocate your time to the most profitable channels.
Explore Relevant Templates
- Freelancer Business Dashboard in Excel – The same freelance analytics concept built in Microsoft Excel with pivot tables and dynamic charts for users who prefer spreadsheets.
- Freelance Business KPI Scorecard in Google Sheets – A cloud-based KPI scorecard template for freelancers who work primarily in Google Workspace.
- Personal Finance Dashboard in Power BI – Track your personal income, expenses, savings, and financial goals alongside your freelance business analytics.
- Personal Finance Dashboard in Excel – A comprehensive Excel-based template for managing personal finances with pivot-powered dashboards.
Frequently Asked Questions
What is the best Power BI dashboard template for freelancers?
The Freelancer Business Dashboard in Power BI from NextGenTemplates is one of the best options available for freelancers who want to track their business performance. It includes 5 interactive pages covering revenue, costs, clients, projects, and payments with dynamic KPI cards and advanced slicer-based filtering. You can download it from NextGenTemplates.com.
How do I track freelance revenue and expenses in Power BI?
You can use the Freelancer Business Dashboard in Power BI to track revenue and expenses automatically. Simply open the .pbix file in Power BI Desktop, replace the sample data with your own project records including client names, revenue amounts, costs, and payment status, then click Refresh. All 5 dashboard pages update automatically with your data.
Can I use this dashboard to compare performance across Upwork, Fiverr, and direct clients?
Yes. The dashboard includes a Platform dimension that lets you analyze Total Records by Platform, Net Profit by Platform, and Total Revenue by Platform. You can compare performance across Upwork, Fiverr, Toptal, direct client channels, and any other platforms you work on.
Do I need to know DAX or Power Query to use this template?
No advanced Power BI skills are required. The template comes pre-built with all visuals, KPI cards, and filters configured. Simply replace the sample data in the data table with your own freelance project records and click Refresh to update everything automatically.
How is the Power BI version different from the Excel version?
The Power BI version of the Freelancer Business Dashboard offers more advanced interactive filtering, cross-page drill-through capabilities, richer data visualization options, and better performance with larger datasets. The Excel version uses pivot tables and is ideal for users who prefer working in spreadsheets. Both templates cover the same analytics concepts.
What KPIs does the Freelancer Business Dashboard track?
The dashboard tracks Total Records, Total Cost, Total Revenue, Net Profit, and Avg. Revenue/Project as primary KPI cards on the overview page. Across all 5 pages, additional metrics include Payment Rate %, Profit Margin %, Avg. Client Rating, Total Hours by Project Type, and revenue breakdowns by platform, industry, and service category.
Conclusion
The Freelancer Business Dashboard in Power BI is an essential analytics tool for any freelancer who wants to move beyond manual tracking and start making data-driven business decisions. With 5 interactive pages, 5 KPI cards, advanced filtering, and professional visuals, this template gives you complete visibility into your revenue, costs, clients, projects, and payment performance. Whether you are a seasoned consultant or just starting your freelance journey, this dashboard will help you identify your most profitable work, optimize your time allocation, and grow your business with confidence.
Click here to Purchase Freelancer Business Dashboard in Power BI
For more Power BI tutorials, dashboard walkthroughs, and template guides, visit our YouTube channel: Youtube.com/@PK-AnExcelExpert. Learn how to build, customize, and master Power BI dashboards with step-by-step video tutorials. Also explore our complete collection of Power BI Dashboard Templates on NextGenTemplates.com to find more ready-to-use analytics solutions for your business needs.