Excel is a powerful tool which can be used for a wide range of business applications, for analyzing data, creating
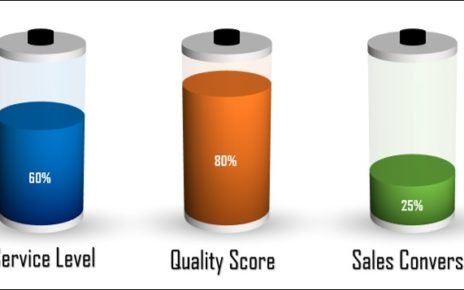
In this article, we have created Data driven 3D Battery Chart in Power Point slide. Right click on the chart
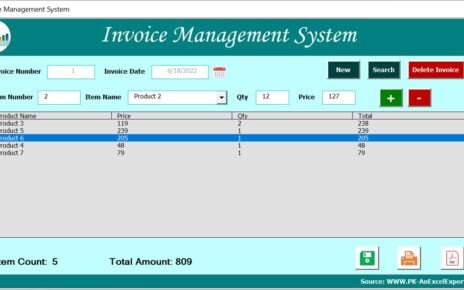
In this article, we have created Invoice Management System in Excel. In this template, we have given multiple features as