Furniture retail is a competitive and data-driven business. Every day, retailers track sales, discounts, profits, stores, regions, and product categories. However, when this data sits in multiple files or static reports, decision-making becomes slow and reactive. That is exactly why a Furniture Retail Dashboard in Power BI plays a critical role in modern retail analytics.
In this detailed guide, you will learn what a Furniture Retail Dashboard in Power BI is, why it matters, how it works, and how each dashboard page supports business decisions. Moreover, you will explore the advantages, best practices, and frequently asked questions related to this dashboard. By the end of this article, you will clearly understand how this ready-to-use Power BI dashboard helps furniture retailers move from guesswork to data-driven growth.
Click to Purchases Furniture Retail Dashboard in Power BI
What Is a Furniture Retail Dashboard in Power BI?
A Furniture Retail Dashboard in Power BI is an interactive business intelligence solution designed to analyze and visualize key retail metrics such as sales, profit, discount, store performance, region performance, and monthly trends.
Instead of checking multiple spreadsheets or static charts, this dashboard brings all critical retail data into one centralized, interactive view. As a result, store managers, regional heads, sales leaders, and executives can track performance instantly and take faster actions.
Moreover, Power BI allows users to apply slicers, filters, and dynamic visuals, which means users can explore data from different angles without technical effort.
Why Do Furniture Retailers Need a Power BI Dashboard?
Furniture retail businesses deal with large volumes of transactional data every month. Because of this, manual analysis often leads to delays and missed insights. Therefore, a Power BI dashboard becomes essential.
Here is why furniture retailers rely on this dashboard:
-
It provides real-time sales and profit visibility
-
It highlights high-performing and underperforming stores
-
It compares product categories and regions
-
It tracks discount impact on profitability
-
It supports strategic planning and forecasting
Most importantly, it helps businesses move from reactive reporting to proactive decision-making.
How Does a Furniture Retail Dashboard in Power BI Work?
A Furniture Retail Dashboard in Power BI works by connecting raw retail data to a structured data model. After that, Power BI transforms this data into interactive visuals such as cards, charts, and graphs.
Step-by-Step Working Process
-
Data Collection
Retail sales data comes from POS systems, ERP software, or Excel files. -
Data Modeling
Power BI cleans, structures, and relates data such as sales, products, stores, regions, and dates. -
Dashboard Design
Visuals like KPI cards, bar charts, and trend charts present insights clearly. -
User Interaction
Users apply slicers to filter data by month, region, store, or category. -
Insight Generation
Decision-makers identify patterns, trends, and risks instantly.
As a result, teams save time while improving accuracy and insight quality.
What Pages Are Included in the Furniture Retail Dashboard in Power BI?
This Furniture Retail Dashboard in Power BI includes five well-structured pages, each designed to answer specific business questions.
Click to Purchases Furniture Retail Dashboard in Power BI
1. What Insights Does the Overview Page Provide?
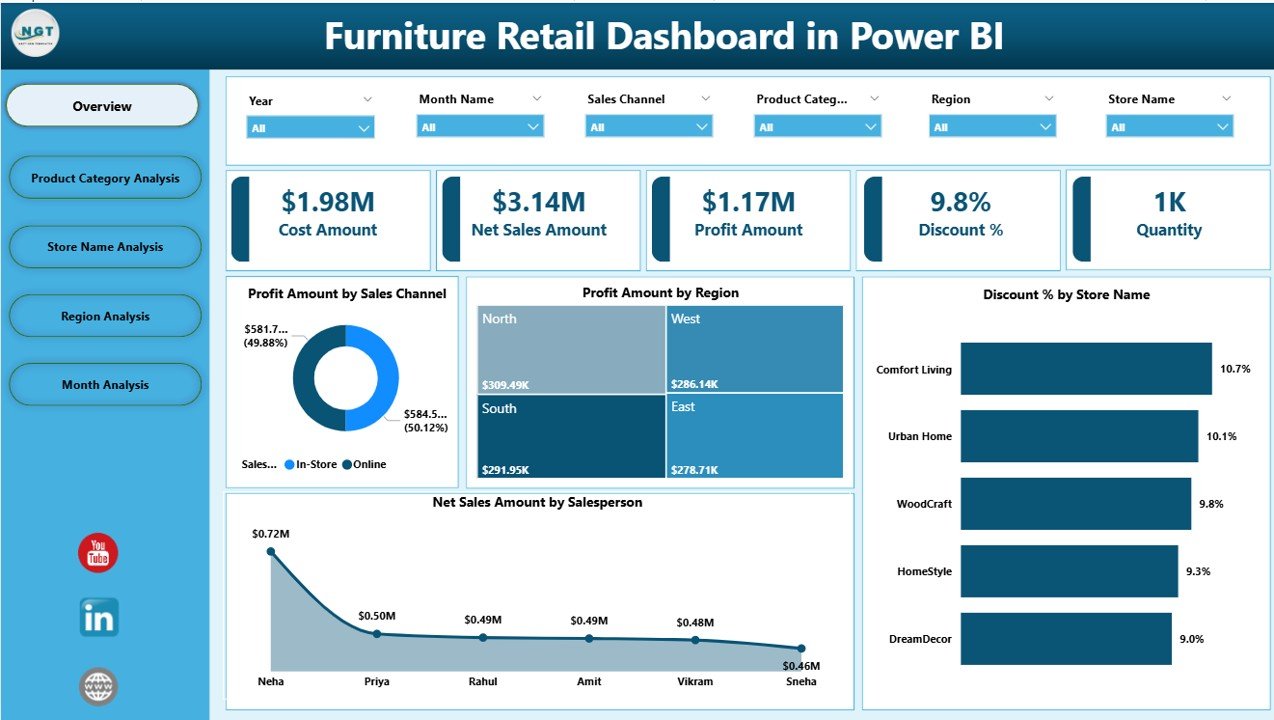
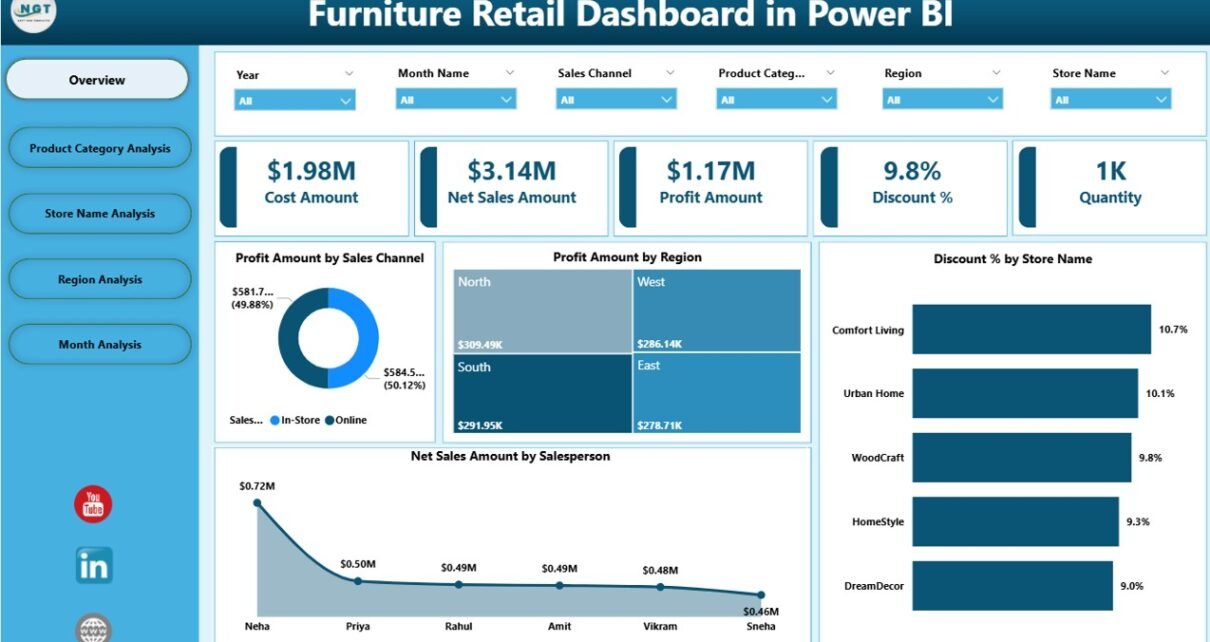
The Overview Page acts as the command center of the dashboard. It gives a quick summary of overall retail performance.
Key Features of the Overview Page
-
Interactive slicers for quick filtering
-
High-level KPI cards for instant insights
KPIs Displayed on the Overview Page
-
Profit Amount by Sales Channel
Helps compare profitability across online, offline, or wholesale channels. -
Profit Amount by Region
Shows which regions generate higher profits. -
Discount % by Store Name
Highlights stores offering higher discounts. -
Net Sales Amount by Salesperson
Identifies top-performing salespeople.
Because of this design, leadership teams can understand business health within seconds.
2. How Does Product Category Analysis Improve Retail Decisions?
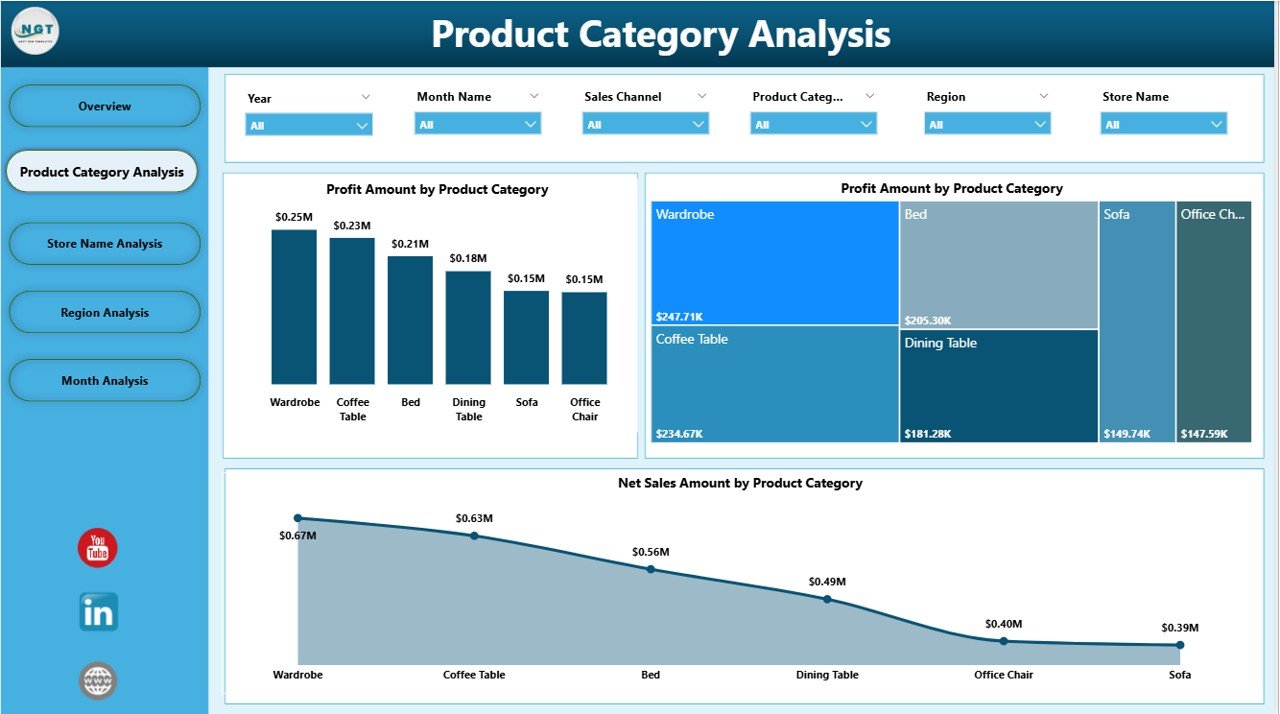
The Product Category Analysis Page focuses on category-level performance. Furniture retailers often sell multiple categories such as sofas, beds, tables, and chairs. Therefore, category-level analysis becomes essential.
Key Charts on the Product Category Analysis Page
-
Profit Amount by Product Category
-
Discount % by Product Category
-
Net Sales Amount by Product Category
Why This Page Matters
-
It identifies high-margin categories
-
It highlights categories with excessive discounts
-
It supports inventory and pricing decisions
As a result, retailers can focus on categories that drive profitability instead of just revenue.
Click to Purchases Furniture Retail Dashboard in Power BI
3. Why Is Store Name Analysis Important for Furniture Retailers?
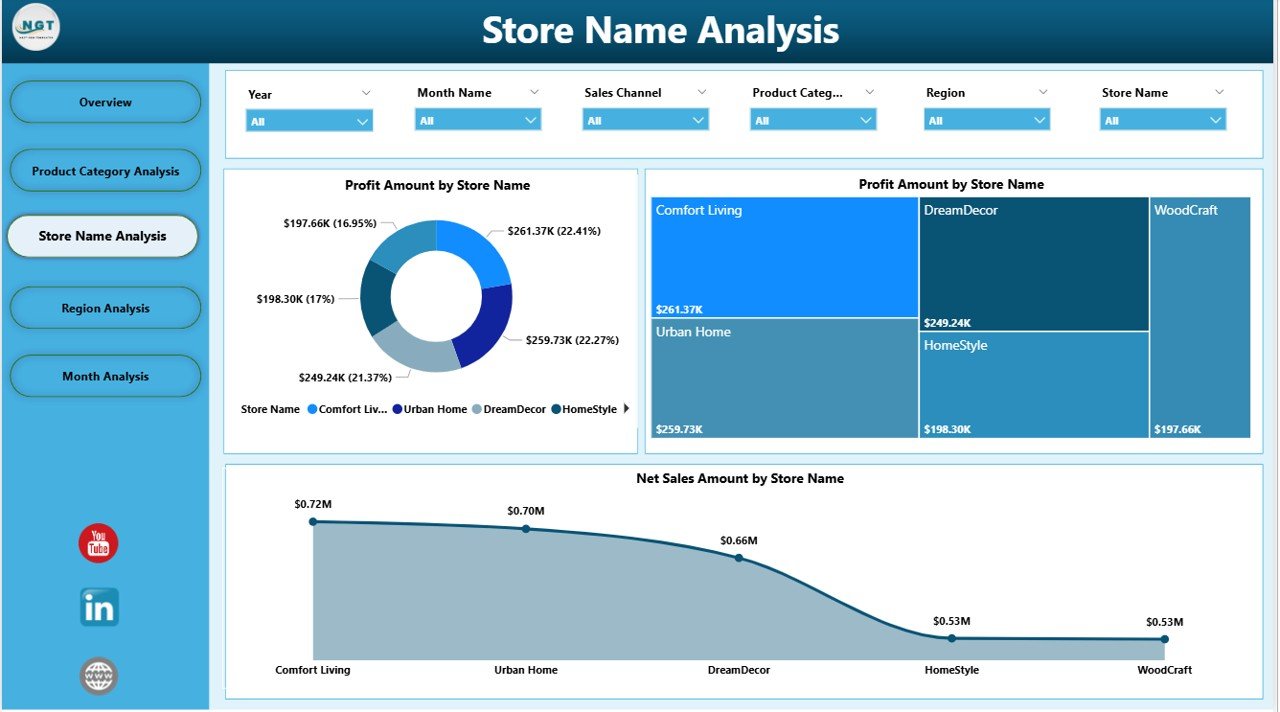
The Store Name Analysis Page evaluates individual store performance. Since furniture retailers often operate across multiple locations, store-level insights become critical.
Key Charts on the Store Name Analysis Page
-
Profit Amount by Store Name
-
Discount % by Store Name
-
Net Sales Amount by Store Name
Business Value of Store Name Analysis
-
It identifies top-performing stores
-
It flags underperforming locations
-
It reveals discount misuse at store level
Therefore, managers can take corrective actions quickly and improve store efficiency.
4. What Can Retailers Learn from Region Analysis?
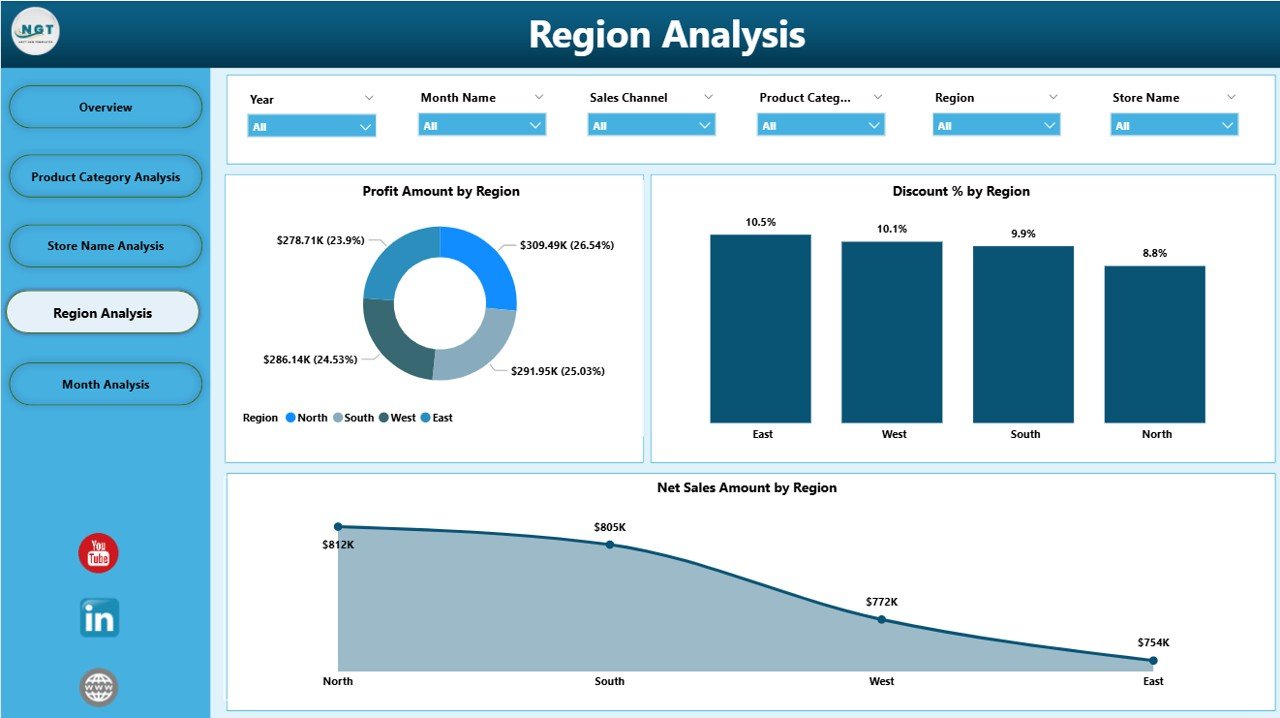
The Region Analysis Page compares performance across geographic regions. Since customer preferences and pricing strategies differ by region, this analysis becomes extremely valuable.
Key Charts on the Region Analysis Page
-
Profit Amount by Region
-
Discount % by Region
-
Net Sales Amount by Region
Why Region Analysis Matters
-
It supports regional strategy planning
-
It identifies growth opportunities
-
It helps balance discount and profit trade-offs
As a result, regional managers gain better control over their markets.
Click to Purchases Furniture Retail Dashboard in Power BI
5. How Does Month Analysis Support Trend Tracking?
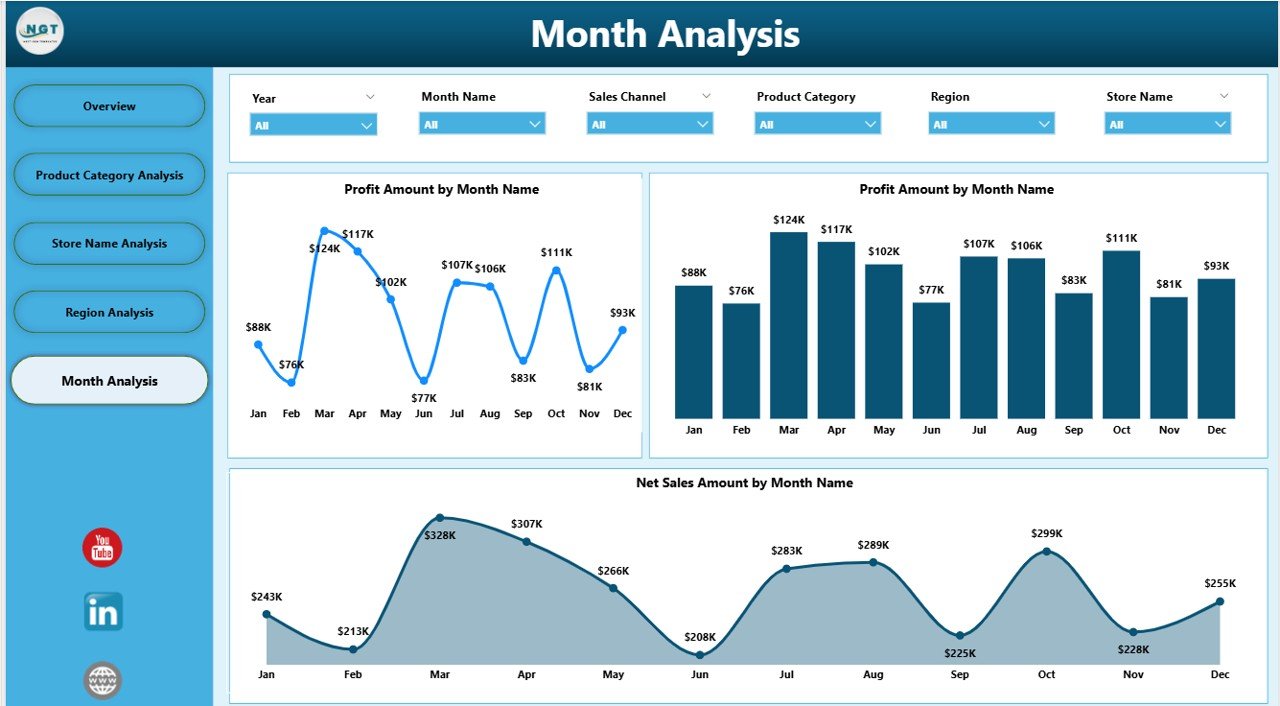
The Month Analysis Page focuses on time-based performance trends. Furniture sales often show seasonal patterns, promotions, and campaign effects.
Key Charts on the Month Analysis Page
-
Profit Amount by Month
-
Discount % by Month
-
Net Sales Amount by Month
Benefits of Month Analysis
-
It tracks seasonal demand patterns
-
It measures campaign effectiveness
-
It supports future sales forecasting
Therefore, businesses can plan inventory, promotions, and staffing more effectively.
Advantages of Furniture Retail Dashboard in Power BI
Using a Furniture Retail Dashboard in Power BI offers several advantages for retailers of all sizes.
Key Advantages
-
📊 Centralized Data Visibility
View all retail KPIs in one dashboard. -
⚡ Faster Decision-Making
Identify issues and opportunities instantly. -
🎯 Improved Profit Control
Monitor profit, discounts, and margins effectively. -
🏬 Store-Level Accountability
Compare store performance transparently. -
🌍 Regional Performance Insights
Align strategies with regional trends. -
📈 Trend-Based Planning
Track monthly and seasonal trends accurately. -
🔍 Interactive Analysis
Use slicers to explore data dynamically.
Because of these benefits, this dashboard becomes a powerful tool for retail growth.
Best Practices for the Furniture Retail Dashboard in Power BI
To get maximum value from your Furniture Retail Dashboard in Power BI, you should follow these best practices.
Best Practices
-
✅ Keep data clean and consistent
-
✅ Use standard naming conventions for stores and categories
-
✅ Update data regularly
-
✅ Limit excessive visuals for better clarity
-
✅ Use meaningful KPIs aligned with business goals
-
✅ Apply slicers logically for user-friendly navigation
-
✅ Train users on dashboard interpretation
Following these practices ensures accuracy, adoption, and long-term success.
Who Should Use a Furniture Retail Dashboard in Power BI?
This dashboard serves multiple stakeholders across the organization.
Ideal Users
-
Store Managers
-
Regional Managers
-
Sales Teams
-
Finance Teams
-
Operations Heads
-
Business Owners
-
Executives and Decision-Makers
Each role benefits from tailored insights while using the same dashboard.
How Does This Dashboard Improve Business Performance?
A Furniture Retail Dashboard in Power BI improves business performance by turning raw data into actionable insights. Instead of reacting late, teams respond early. Instead of guessing, leaders rely on facts.
Because of real-time visibility, businesses reduce losses, improve margins, and scale operations confidently.
Conclusion
A Furniture Retail Dashboard in Power BI is no longer a luxury—it is a necessity for modern furniture retailers. This dashboard provides a structured, interactive, and insightful view of sales, profit, discounts, stores, regions, and monthly trends.
With five powerful pages—Overview, Product Category Analysis, Store Name Analysis, Region Analysis, and Month Analysis—this dashboard empowers teams to make smarter and faster decisions. Moreover, when used with best practices, it becomes a long-term strategic asset for retail growth.
If you want to gain full control over your furniture retail performance, this Power BI dashboard offers the perfect solution.
Frequently Asked Questions (FAQs)
What is a Furniture Retail Dashboard in Power BI?
A Furniture Retail Dashboard in Power BI is an interactive analytics tool that tracks sales, profit, discounts, stores, regions, and trends in one centralized dashboard.
Who can use this dashboard?
Store managers, regional managers, sales teams, finance teams, and executives can all use this dashboard.
Does this dashboard support slicers?
Yes, the dashboard includes slicers that allow users to filter data by category, store, region, and time.
Can this dashboard handle large datasets?
Yes, Power BI efficiently handles large retail datasets and updates visuals quickly.
Is this dashboard suitable for small furniture retailers?
Yes, both small and large furniture retailers can benefit from this dashboard.
How often should the data be updated?
You should update data regularly, ideally daily or weekly, depending on business needs.
Can this dashboard help improve profitability?
Yes, by tracking profit, discounts, and trends, the dashboard supports better pricing and cost control decisions.
Visit our YouTube channel to learn step-by-step video tutorials