In the fast-paced world of gaming, success depends not only on creativity but also on performance tracking and data-driven decisions. Whether you run a gaming studio, manage esports operations, or handle online gaming analytics, having the right measurement system is essential.
That’s where the Gaming KPI Scorecard in Excel comes in. It helps you track critical metrics, compare actual performance with targets, and visualize trends — all inside a single, interactive Excel file.
In this article, you’ll learn what this scorecard is, how it works, what insights it delivers, and how you can apply it to make your gaming business thrive.
Click to Purchases Gaming KPI Scorecard in Excel
🎯 What Is a Gaming KPI Scorecard in Excel?
A Gaming KPI Scorecard in Excel is a performance management tool that allows you to monitor key performance indicators (KPIs) related to game development, player engagement, revenue, and marketing.
It simplifies complex data and presents it in a visually appealing, easy-to-read format. Whether you want to analyze MTD (Month-to-Date) or YTD (Year-to-Date) results, this scorecard helps you identify trends, measure success, and optimize performance.
It’s not just a spreadsheet — it’s a full-fledged management dashboard that connects creative decisions with measurable outcomes.
Click to Purchases Gaming KPI Scorecard in Excel
🧩 Structure of the Gaming KPI Scorecard Template
The Gaming KPI Scorecard template is built in Excel and includes four structured worksheets, each serving a unique purpose.
Let’s go through each one in detail.
1️⃣ Scorecard Sheet — Your Main Performance Dashboard
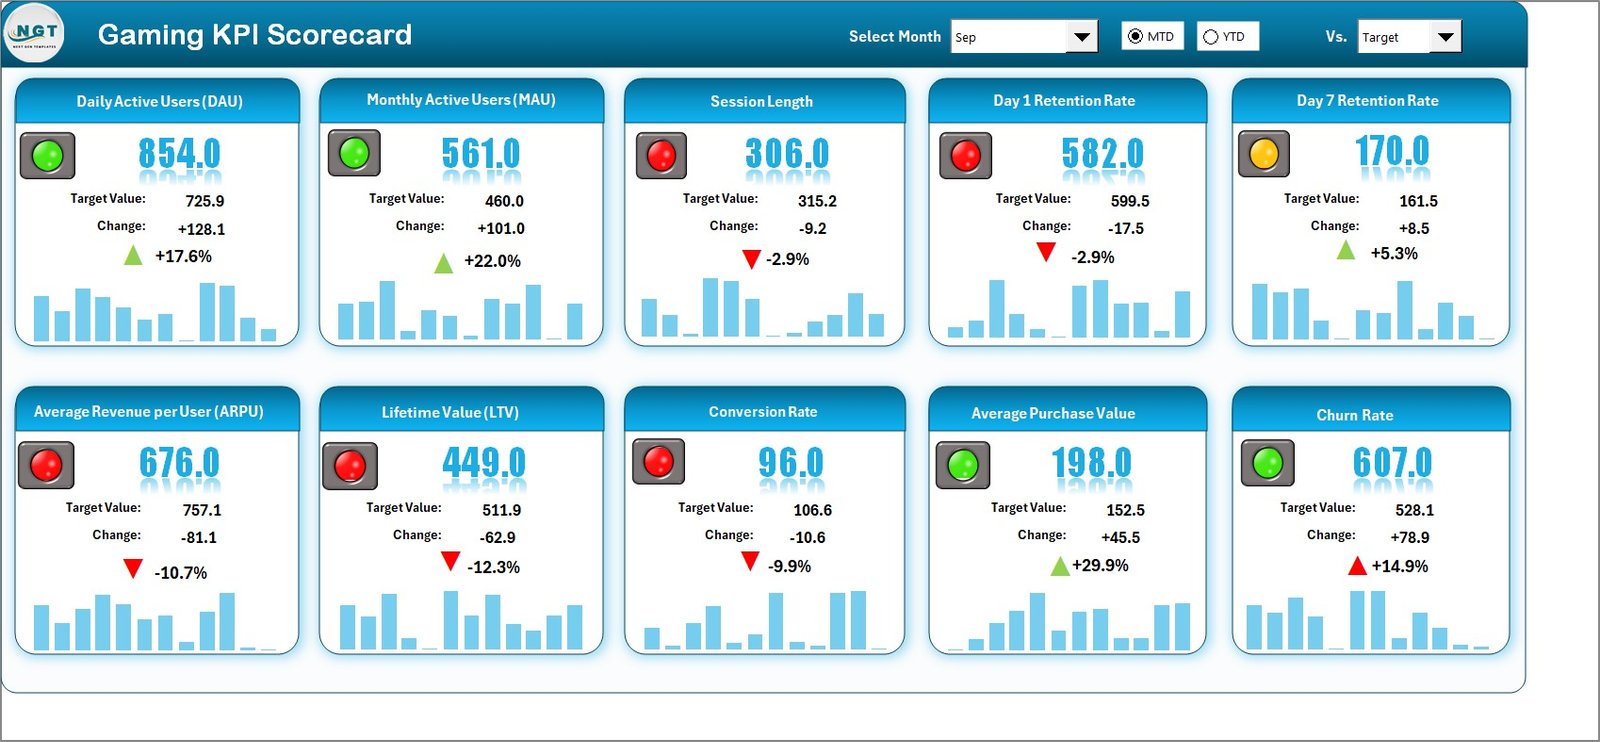
The Scorecard Sheet is the command center of this template. It gives you an instant snapshot of gaming performance through metrics, visuals, and comparisons.
Key Features:
-
🎚 Dropdown Menus:
Choose between Month, MTD, or YTD to analyze performance from different time perspectives. -
📊 Actual vs Target Comparison:
View how your actual results align with defined targets for each KPI — helping you measure success precisely. -
🟢 Visual Indicators:
Use color-coded visuals or conditional formatting to identify good or poor performance quickly. -
🧠 Comprehensive KPI Overview:
Display all KPIs together with their current values, trends, and targets for full transparency.
This sheet helps decision-makers and analysts monitor performance without manually checking multiple tabs.
2️⃣ KPI Trend Sheet — Track Monthly or Yearly Trends
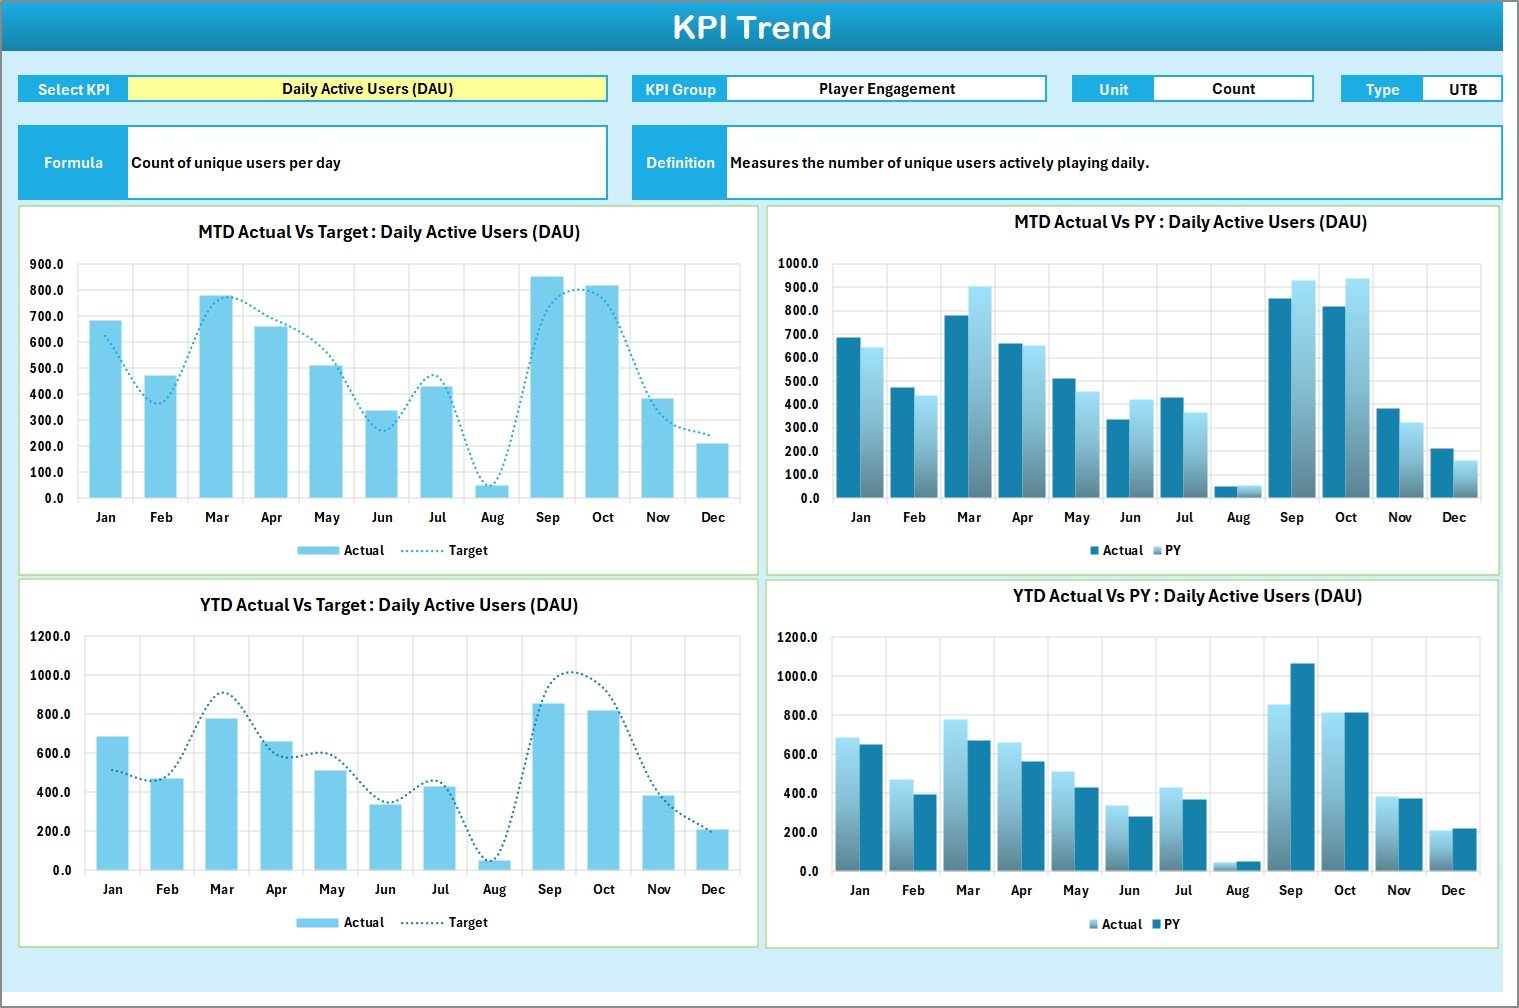
The KPI Trend Sheet visualizes how each KPI evolves over time.
Key Features:
-
📋 KPI Selection Dropdown:
Choose a KPI from the dropdown menu located in cell C3 to view details. -
⚙️ KPI Information Panel:
Instantly view KPI Group, Unit, Type (UTB or LTB), Formula, and Definition in one area. -
📈 MTD and YTD Charts:
Graphs show Actual, Target, and Previous Year (PY) data — enabling quick trend analysis.
This visual layer helps you identify seasonal patterns, game performance peaks, and dips that impact player engagement or profitability.
3️⃣ Input Data Sheet — The Data Backbone
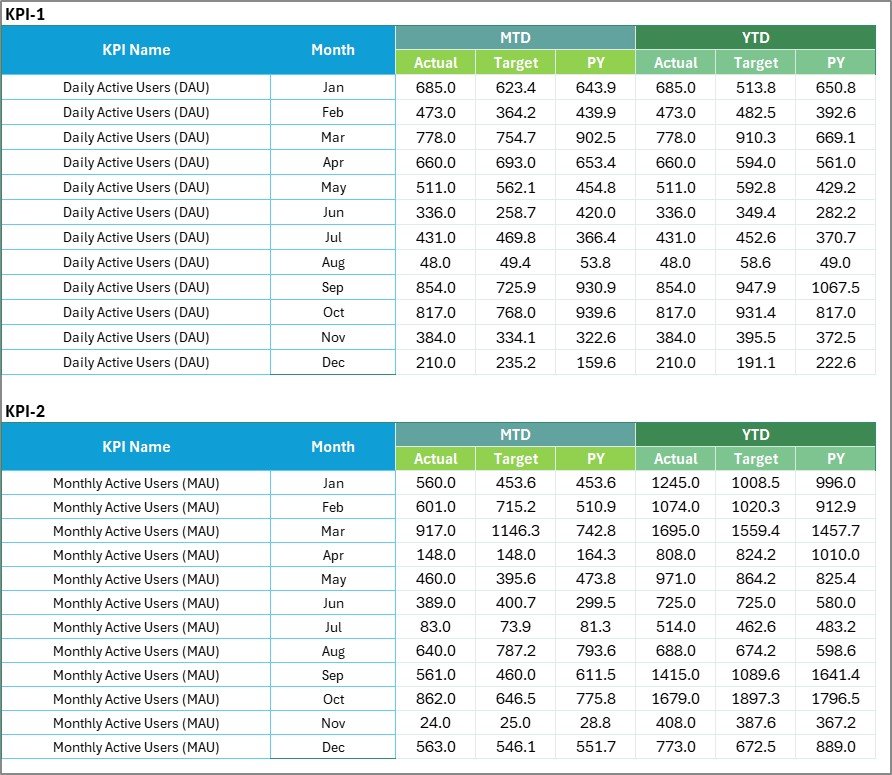
The Input Data Sheet is where all your real data resides.
Key Features:
-
🧾 Data Entry Table:
Enter all Actual, Target, and PY values for each KPI. -
🔄 Dynamic Updates:
Once you update this sheet, all visuals and reports across the workbook refresh automatically. -
📅 Flexible Structure:
You can add, remove, or modify KPIs based on your project needs.
This sheet forms the foundation of the entire system and ensures all calculations and visuals reflect real performance.
4️⃣ KPI Definition Sheet — The Glossary of Metrics
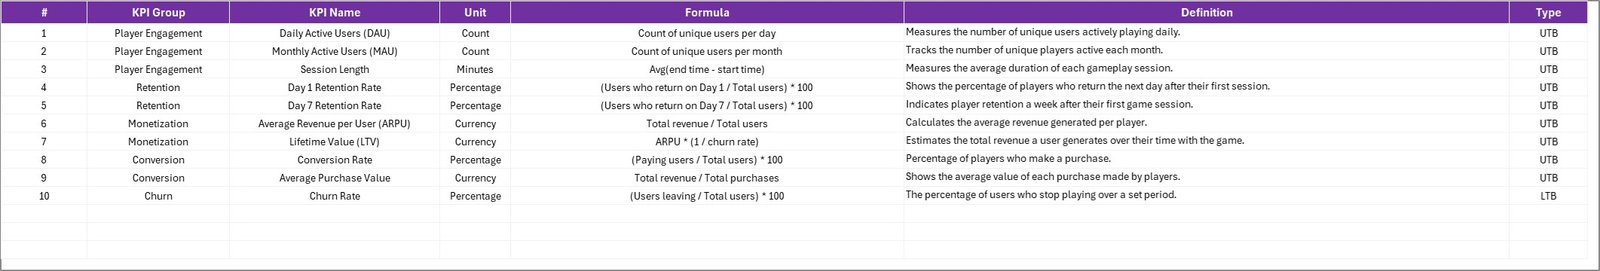
The KPI Definition Sheet is your internal guide to what every metric means and how it’s calculated.
Key Features:
-
🏷 KPI Name and Group:
Organize KPIs by category — such as Development, Marketing, Player Retention, or Revenue. -
⚖️ Unit, Formula, and Definition:
Specify how each KPI is measured and ensure everyone interprets results correctly.
This sheet ensures standardization, which is critical when multiple teams (development, marketing, and analytics) are involved.
🎮 Why the Gaming Industry Needs KPI Tracking
The gaming world has evolved dramatically. Developers, publishers, and gaming platforms now rely heavily on analytics to make strategic decisions.
A Gaming KPI Scorecard offers insights that help you:
📈 Evaluate player engagement trends
💰 Track revenue growth and in-game purchases
🧑💻 Measure development efficiency
🎯 Monitor marketing and acquisition performance
📊 Improve decision-making with real-time visuals
From indie developers to global gaming studios, data-driven insights help improve creativity, reduce costs, and increase profitability.
Click to Purchases Gaming KPI Scorecard in Excel
💡 Benefits of Using the Gaming KPI Scorecard in Excel
Here’s how the scorecard helps elevate your gaming business:
🎯 1. Centralized Performance Tracking
All your metrics — from player engagement to revenue — are organized in one file. No need to shuffle between multiple reports.
💰 2. Better Revenue Insights
Identify which titles, platforms, or campaigns drive the highest ROI.
🧑💻 3. Smarter Development Decisions
Compare planned vs actual development timelines, bug resolution rates, and patch release efficiency.
📊 4. Visual Decision Support
Use charts, color codes, and MTD/YTD views for easy and fast performance analysis.
🤝 5. Transparent Collaboration
Teams across development, marketing, and support can view common KPIs, ensuring alignment toward shared goals.
⚙️ Advantages of Gaming KPI Scorecard in Excel
-
✅ Simple yet powerful — no advanced software needed
-
📈 Auto-updating visuals and performance indicators
-
💡 Works for all gaming segments — mobile, PC, console, or online
-
🔍 Helps reduce cost and improve operational visibility
-
🧮 Customizable KPIs for every project stage
-
💬 Ideal for both independent developers and enterprise studios
The best part is that Excel provides flexibility — you can scale the scorecard as your gaming business grows.
🧭 Best Practices for Using the Gaming KPI Scorecard
To make the most of your KPI Scorecard, follow these proven tips:
-
Define Clear Objectives: Identify what success means for your game — engagement, monetization, or retention.
-
Select the Right KPIs: Avoid tracking too many; focus on 10–15 meaningful metrics.
-
Update Data Regularly: Keep information fresh to ensure visuals reflect real performance.
-
Use Color Indicators Wisely: Green for achieved, yellow for moderate, and red for below-target results.
-
Involve All Teams: Allow departments to suggest KPIs relevant to their work.
-
Review Monthly and Annually: Track both MTD and YTD trends for short- and long-term insights.
-
Automate Calculations: Use Excel formulas for accuracy and efficiency.
-
Keep Layout Simple: Avoid visual clutter — clarity makes analysis faster.
🕹 Step-by-Step Guide to Using the Scorecard
Here’s how to get started quickly:
-
Open the Excel file and locate the Input Data Sheet.
-
Enter Actual, Target, and PY data for every KPI.
-
Review the KPI Definition Sheet to confirm formulas and definitions.
-
Go to the Scorecard Sheet and explore MTD/YTD summaries.
-
Switch between KPIs using the dropdown in the KPI Trend sheet.
-
Analyze trends using interactive charts.
-
Take corrective actions where performance lags.
Following these steps ensures your dashboard provides real-time, actionable insights.
🧮 Types of Analysis Possible
You can use the Gaming KPI Scorecard to perform several important analyses:
-
Performance Comparison: Track progress between actual and target performance.
-
Player Behavior Analysis: Examine engagement, retention, and playtime trends.
-
Revenue Analysis: Assess monetization strategies and ARPU growth.
-
Marketing ROI Analysis: Evaluate campaign costs versus user acquisition results.
-
Technical Analysis: Monitor server uptime, latency, and bug resolution.
Each analysis offers data-backed evidence for improving game quality and profitability.
💬 Common Mistakes to Avoid
Avoid these errors when using your KPI Scorecard:
❌ Not updating data frequently enough
❌ Using too many unnecessary KPIs
❌ Ignoring trends and only viewing totals
❌ Forgetting to define clear KPI formulas
❌ Overcomplicating visuals with excessive colors
Keep it simple, accurate, and consistent for the best results.
📈 Example Scenario: How It Helps in Real Projects
Imagine you’re managing an online multiplayer game.
-
You notice Daily Active Users (DAU) dropped from 150K to 130K in March.
-
The Retention Rate also fell by 5%.
-
The scorecard instantly highlights these declines in red.
You investigate and find that recent server downtimes caused frustration. By addressing server performance, you see DAU rise again within a week.
This quick data-driven response saves your revenue and improves player trust.
📊 Why Use Excel for Gaming KPIs?
While there are advanced tools available, Excel remains the preferred choice for many studios because:
-
It’s cost-effective and easily available.
-
It allows customization without coding.
-
It supports interactive visuals and conditional formatting.
-
It works offline, ensuring access even without an internet connection.
-
It’s flexible enough to adapt to your gaming data needs.
The Gaming KPI Scorecard turns Excel into a performance powerhouse.
🏁 Conclusion — Power Your Gaming Strategy with Data
The gaming industry moves fast, and every second counts. With the Gaming KPI Scorecard in Excel, you can monitor progress, find opportunities, and correct issues before they impact performance.
It provides a 360° view of development, marketing, player engagement, and revenue — all in one place.
Whether you’re an indie developer, a gaming studio, or an esports organization, this Excel-based scorecard is your ultimate tool for better decision-making, faster insights, and sustained success.
Click to Purchases Gaming KPI Scorecard in Excel
❓ Frequently Asked Questions (FAQs)
1️⃣ What is a Gaming KPI Scorecard?
It’s an Excel-based tool for tracking KPIs like engagement, retention, and monetization in the gaming industry.
2️⃣ Who can use this scorecard?
Game developers, publishers, marketing analysts, and esports managers can all use it.
3️⃣ What are the key metrics in the scorecard?
Metrics include DAU, ARPU, retention rate, CPI, bug fix rate, and downtime hours.
4️⃣ Can I customize the KPIs?
Yes, you can add, delete, or rename KPIs in the Input Data or Definition sheet.
5️⃣ Does it show trends automatically?
Yes, charts in the KPI Trend sheet automatically update when new data is entered.
6️⃣ Is Excel powerful enough for gaming analytics?
Absolutely. Excel supports formulas, charts, and automation that make KPI tracking efficient.
7️⃣ Can I use this scorecard for mobile games?
Yes, it works perfectly for mobile, PC, or console games.
8️⃣ How often should I update it?
Weekly or monthly updates ensure your visuals stay accurate and relevant.
Click to Purchases Gaming KPI Scorecard in Excel
Visit our YouTube channel to learn step-by-step video tutorials