In today’s competitive manufacturing environment, glassware production companies must monitor performance closely to maintain quality, reduce waste, and improve operational efficiency. Manufacturers continuously face challenges such as production losses, quality defects, high energy consumption, and delivery delays. Therefore, businesses need a structured system that helps them track Key Performance Indicators (KPIs) clearly and consistently.
This is where the Glassware Production KPI Dashboard in Excel becomes a powerful solution. Instead of managing performance data across multiple spreadsheets, organizations can monitor all production KPIs through a single, interactive, and easy-to-use dashboard.
In this detailed guide, you will learn everything about the Glassware Production KPI Dashboard in Excel, including its structure, features, benefits, implementation strategy, best practices, and frequently asked questions.
Click to buy Glassware Production KPI Dashboard in Excel
What Is a Glassware Production KPI Dashboard in Excel?
A Glassware Production KPI Dashboard in Excel is a ready-to-use performance monitoring tool designed specifically for glass manufacturing operations. It allows production managers, plant supervisors, and business leaders to analyze operational performance using measurable KPIs.
Rather than reviewing raw data manually, users can instantly visualize performance through charts, comparisons, and automated calculations.
Because Excel remains one of the most widely used business tools, companies can implement this dashboard quickly without investing in expensive software systems.
Why Do Glassware Manufacturers Need KPI Tracking?
Glass manufacturing involves complex processes such as melting, forming, annealing, inspection, and packaging. Each stage affects production efficiency and product quality.
Without structured KPI monitoring:
- Teams struggle to identify production bottlenecks.
- Quality issues remain unnoticed.
- Energy consumption increases.
- Decision-making becomes slow.
However, when organizations use KPI dashboards, they gain real-time performance visibility.
Key Reasons to Track KPIs in Glassware Production
- Improve production efficiency
- Reduce material wastage
- Monitor furnace performance
- Maintain product quality standards
- Control operational costs
- Enhance workforce productivity
Consequently, KPI dashboards help managers move from reactive decisions to proactive management.
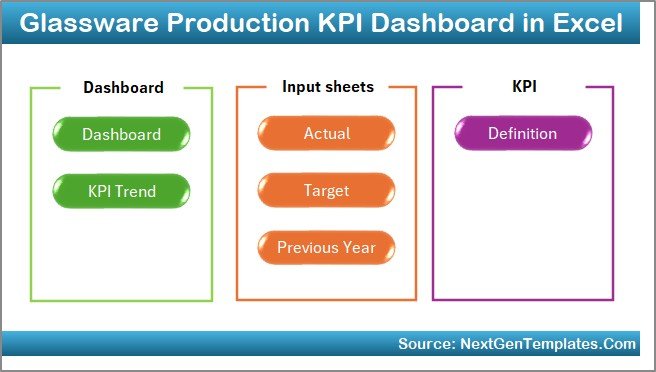
Overview of the Glassware Production KPI Dashboard Structure
This Glassware Production KPI Dashboard in Excel contains 7 structured worksheets, each designed for a specific purpose. Together, they create a complete performance management system.
Summary Page – Easy Navigation Hub
The Summary Page works as the index sheet of the dashboard.
Key Highlights:
- Provides navigation buttons
- Allows quick access to all dashboard sheets
- Improves user experience
- Reduces manual sheet searching
Because users can jump directly to required sections, navigation becomes faster and more efficient.
Click to buy Glassware Production KPI Dashboard in Excel
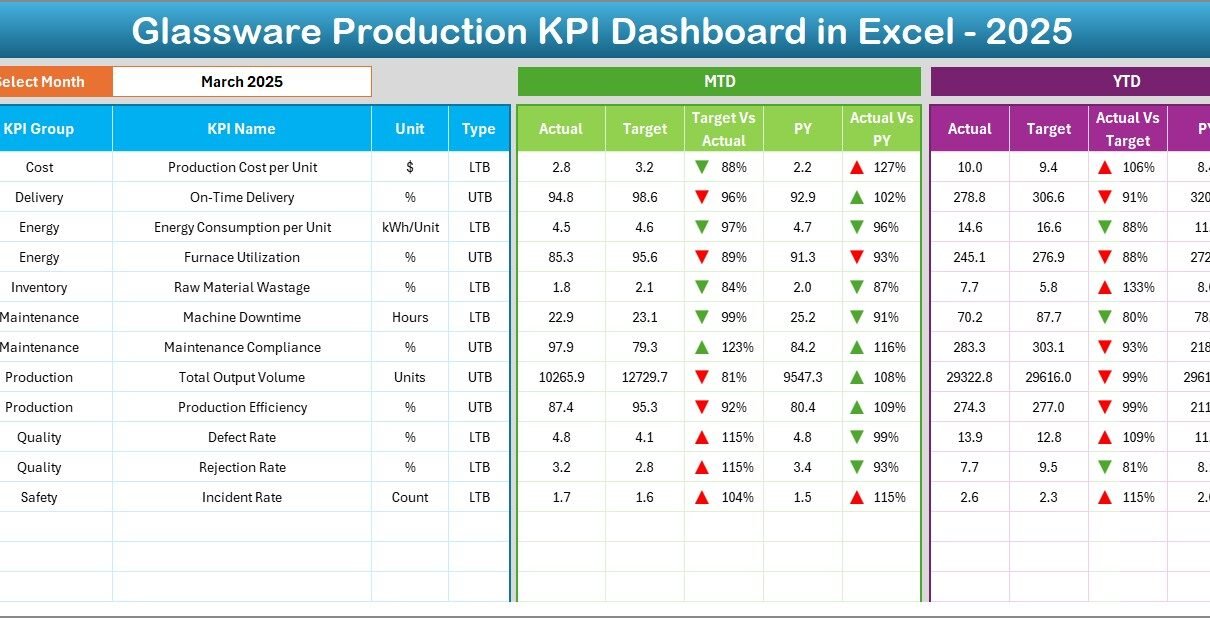
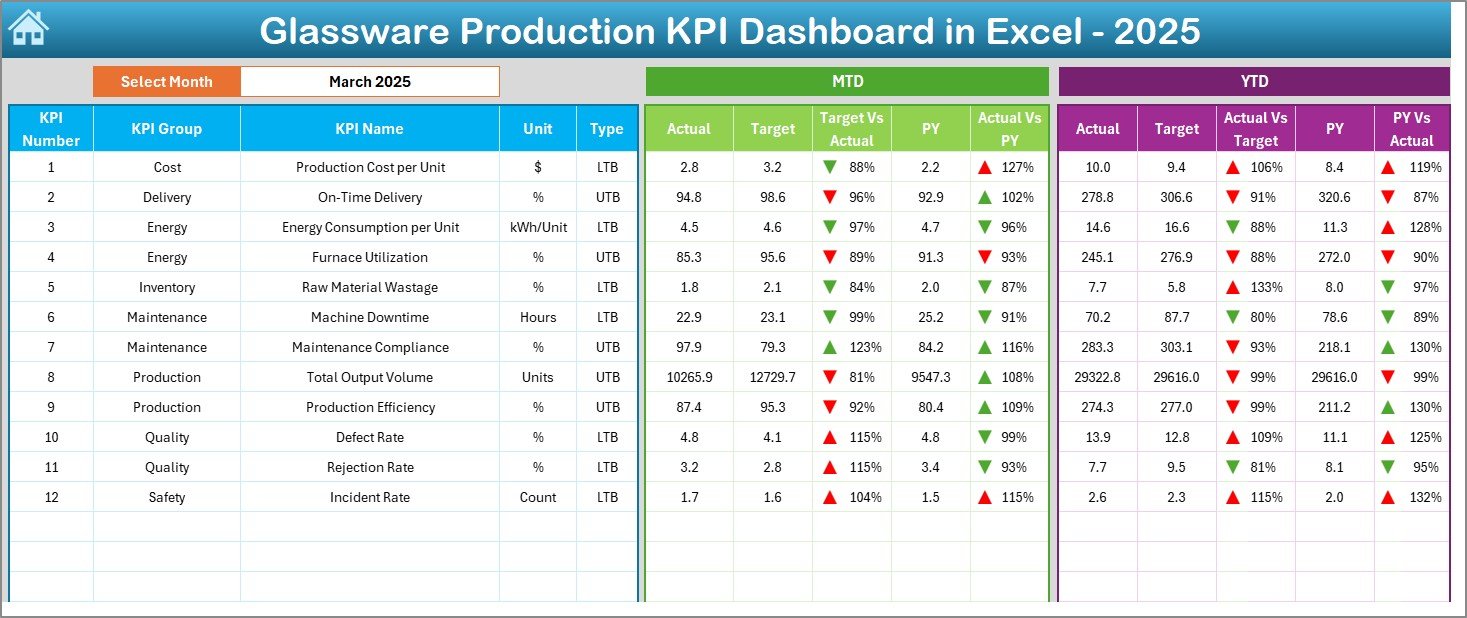
Dashboard Sheet – The Main Performance View
The Dashboard Sheet acts as the central analytical page where all KPIs appear visually.
Interactive Features
- Month selection dropdown available in cell D3
- Entire dashboard updates automatically after month selection
- Dynamic KPI calculations
Performance Metrics Displayed
The dashboard shows:
- MTD (Month-to-Date) Actual
- MTD Target
- Previous Year Performance
- Target vs Actual comparison
- Previous Year vs Current Year comparison
Additionally, conditional formatting uses:
- Up arrows for positive performance
- Down arrows for negative trends
Therefore, users instantly understand performance without deep analysis.
YTD Analysis Included
The dashboard also displays:
- YTD Actual values
- YTD Target values
- Previous Year YTD performance
- Automated variance indicators
As a result, management receives both short-term and long-term performance insights.
Click to buy Glassware Production KPI Dashboard in Excel
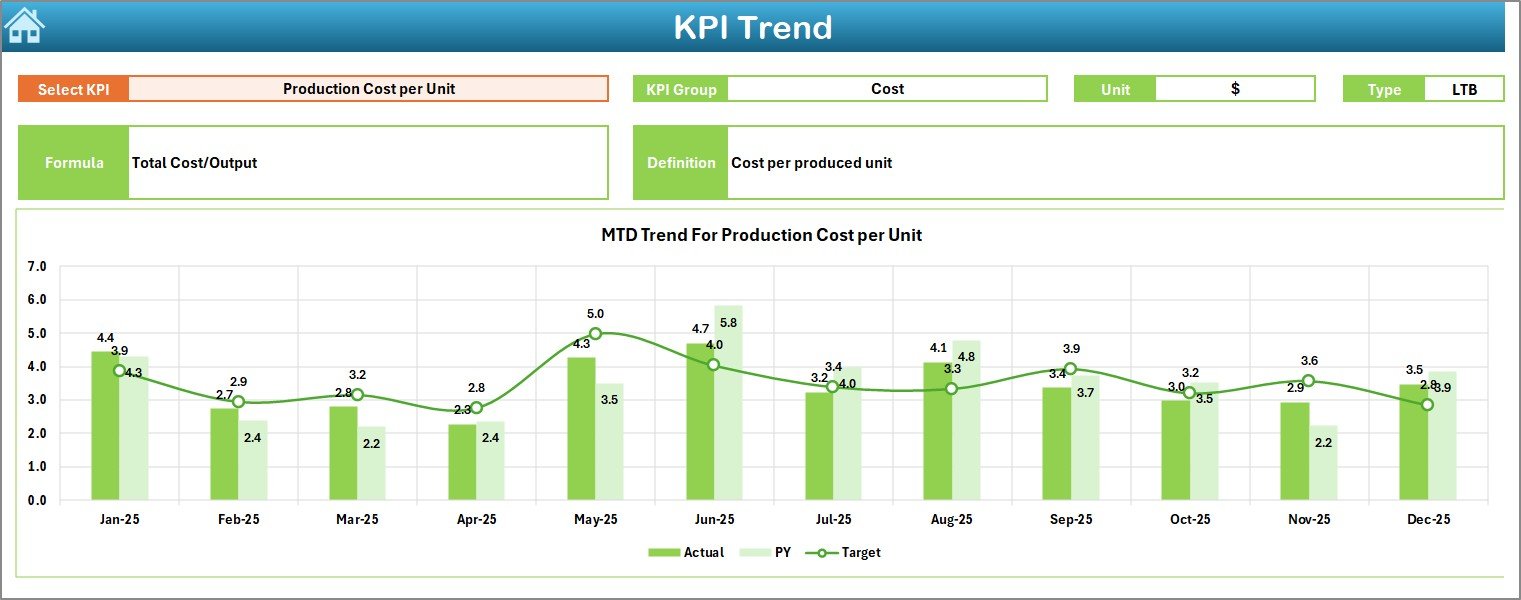
Trend Sheet – KPI Performance Analysis
The Trend Sheet allows detailed KPI-level analysis.
How It Works
Users select a KPI from the dropdown located in cell C3.
Immediately, the dashboard displays:
- KPI Group
- Unit of Measurement
- KPI Type (LTB or UTB)
- KPI Formula
- KPI Definition
Trend Visualization
The sheet includes:
- MTD Trend Chart
- YTD Trend Chart
- Actual vs Target comparison
- Previous Year comparison
Because trends reveal performance patterns, managers can identify recurring problems quickly.
Click to buy Glassware Production KPI Dashboard in Excel
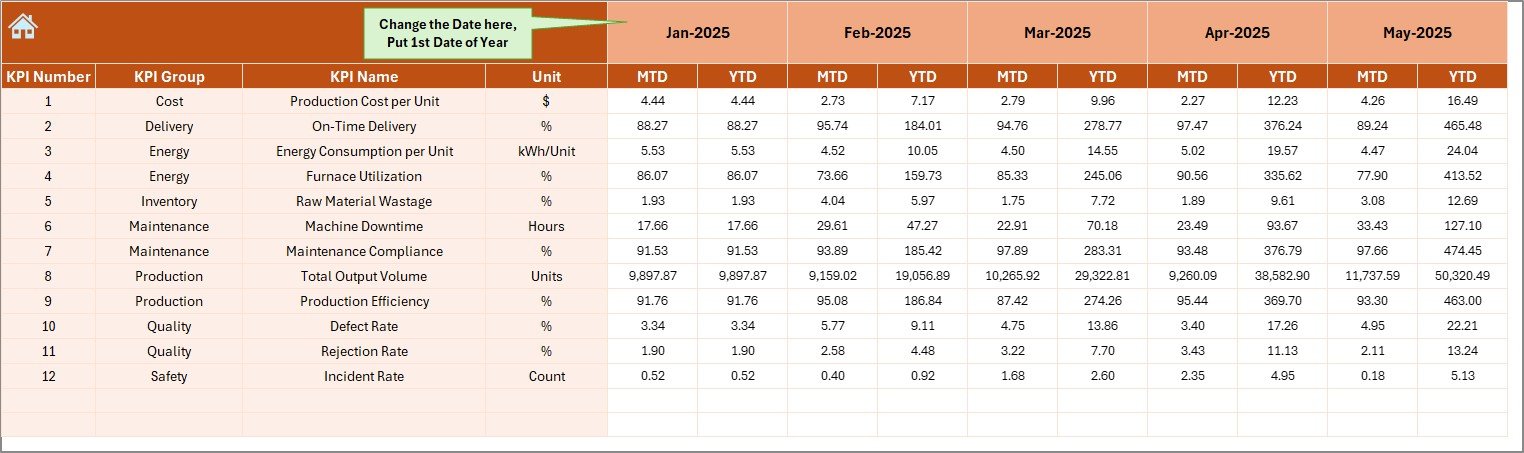
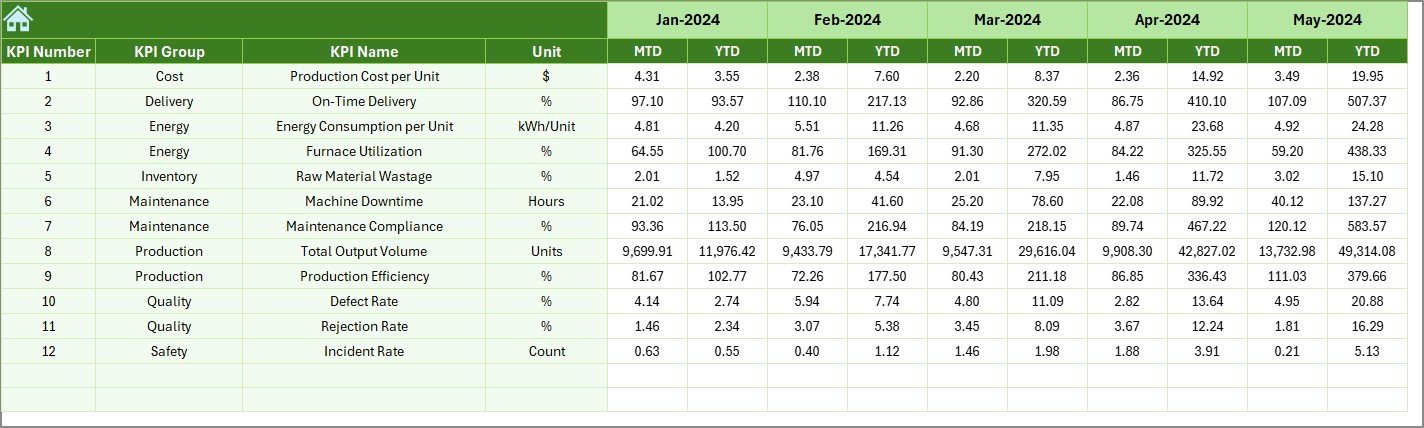
Actual Numbers Input Sheet
This sheet captures operational data.
Data Entry Instructions
- Enter actual production numbers.
- Input both MTD and YTD values.
- Select starting month in cell E1.
Once users update data, the dashboard refreshes automatically.
This structure ensures accuracy while keeping data entry simple.
Click to buy Glassware Production KPI Dashboard in Excel
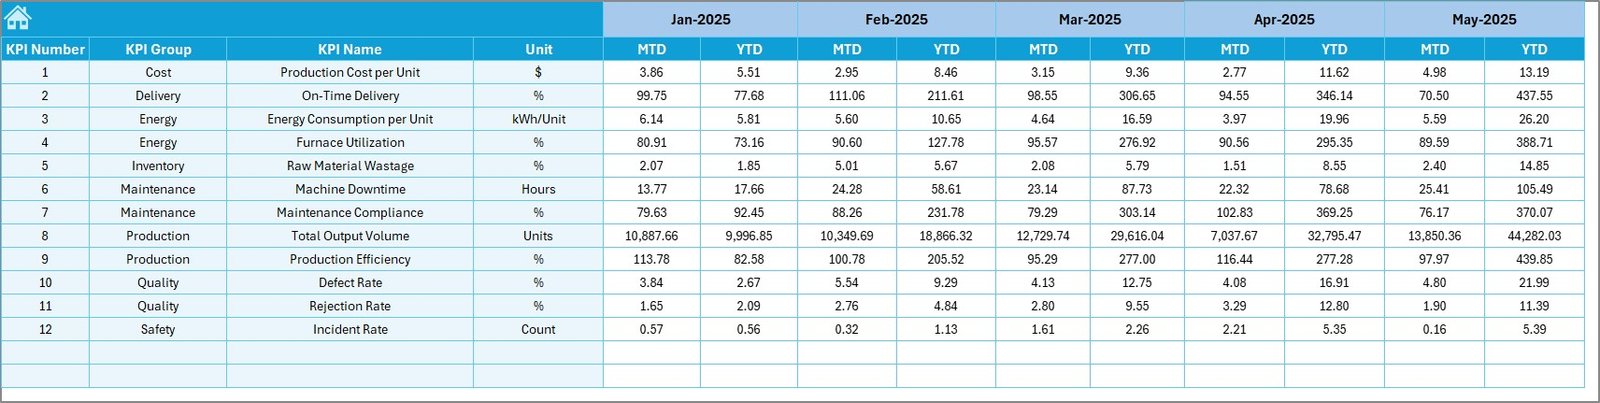
Target Sheet – Performance Goals Management
The Target Sheet defines expected performance levels.
Users enter:
- Monthly KPI Targets
- MTD Targets
- YTD Targets
Since targets drive performance measurement, accurate input becomes essential.
Managers can adjust targets according to business strategies or seasonal production changes.
Click to buy Glassware Production KPI Dashboard in Excel
Previous Year Numbers Sheet
Historical comparison plays a critical role in manufacturing analysis.
In this sheet, users enter:
- Previous year KPI values
- Same structure as current-year data
Therefore, companies can evaluate growth trends and operational improvement over time.
Click to buy Glassware Production KPI Dashboard in Excel
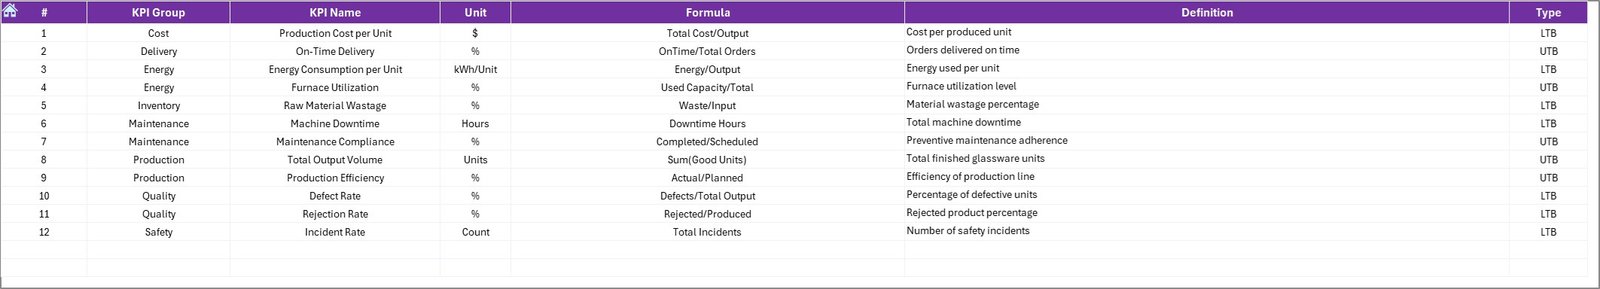
KPI Definition Sheet – KPI Documentation Center
The KPI Definition Sheet standardizes KPI understanding across teams.
Information Captured
- KPI Name
- KPI Group
- Unit
- Formula
- KPI Definition
Because everyone refers to the same definitions, confusion reduces significantly.
Click to buy Glassware Production KPI Dashboard in Excel
What KPIs Can You Track in Glassware Production?
A well-designed dashboard supports multiple manufacturing KPIs.
Production KPIs
- Production Output Volume
- Furnace Efficiency
- Machine Utilization Rate
- Cycle Time
Quality KPIs
- Defect Rate
- Rejection Percentage
- Breakage Rate
- Quality Compliance Rate
Operational KPIs
- Energy Consumption per Unit
- Downtime Hours
- Maintenance Efficiency
- Labor Productivity
Financial KPIs
- Cost per Unit Produced
- Production Cost Variance
- Profit Margin per Batch
Tracking these KPIs ensures complete operational visibility.
How Does the Dashboard Improve Decision-Making?
Managers often rely on delayed reports. However, dashboards provide instant insights.
Faster Decision Process
- Identify underperforming KPIs immediately.
- Compare targets with actual results.
- Detect production issues early.
Data-Driven Planning
Since trends appear visually, leadership can:
- Adjust production schedules
- Optimize manpower allocation
- Reduce operational waste
Therefore, decision-making becomes accurate and timely.
Advantages of Glassware Production KPI Dashboard in Excel
Using this dashboard offers multiple business advantages.
- Centralized Performance Monitoring
All KPIs appear in one location, which eliminates scattered reporting.
- Easy Implementation
Since Excel powers the dashboard, companies avoid complex software installation.
- Automated Analysis
Formulas calculate performance automatically, saving time.
- Visual Insights
Charts and indicators simplify data interpretation.
- Historical Comparison
Previous-year tracking helps measure growth effectively.
- Improved Accountability
Teams clearly understand performance expectations.
- Cost-Effective Solution
Organizations achieve advanced analytics without expensive BI tools.
How to Use the Glassware Production KPI Dashboard Step by Step?
Step 1: Define KPIs
Enter KPI details in the KPI Definition Sheet.
Step 2: Input Targets
Fill monthly targets in the Target Sheet.
Step 3: Enter Actual Data
Update production results in the Actual Numbers Sheet.
Step 4: Add Previous Year Data
Input historical performance for comparison.
Step 5: Select Month
Choose a month from cell D3 in Dashboard Sheet.
Step 6: Analyze Trends
Use Trend Sheet for deep KPI analysis.
Following these steps ensures smooth dashboard operation.
Best Practices for the Glassware Production KPI Dashboard
To achieve maximum value, organizations should follow proven practices.
Keep KPIs Relevant
Choose KPIs aligned with production goals.
Update Data Regularly
Enter data daily or weekly for accurate insights.
Maintain Data Accuracy
Validate numbers before input.
Use Standard Definitions
Ensure KPI definitions remain consistent.
Monitor Trends, Not Just Numbers
Focus on patterns instead of single-month results.
Review Dashboard Periodically
Conduct monthly performance reviews using dashboard insights.
Common Challenges and How to Overcome Them
Challenge 1: Incorrect Data Entry
Solution: Use validation rules and standardized formats.
Challenge 2: Too Many KPIs
Solution: Focus on critical performance indicators.
Challenge 3: Lack of User Adoption
Solution: Train teams on dashboard usage.
Challenge 4: Irregular Updates
Solution: Assign responsibility for data entry.
Who Can Benefit from This Dashboard?
Many professionals within glass manufacturing organizations benefit from this tool.
- Plant Managers
- Production Supervisors
- Operations Heads
- Quality Control Managers
- Business Analysts
- Manufacturing Consultants
Because the dashboard remains user-friendly, both technical and non-technical users can operate it easily.
Why Choose Excel for KPI Dashboards?
Although many analytics tools exist, Excel remains highly practical.
Key Reasons
- Widely available
- Easy customization
- No licensing complexity
- Strong formula capabilities
- Pivot and chart support
Therefore, Excel dashboards provide flexibility along with affordability.
Future Improvements You Can Add
Organizations can enhance dashboards further.
- Automated data import
- Power Query integration
- Department-wise dashboards
- Mobile-friendly reporting
- Power BI integration
These improvements help scale analytics maturity over time.
Conclusion
The Glassware Production KPI Dashboard in Excel provides a structured and practical approach to monitoring manufacturing performance. Instead of relying on manual reporting, organizations gain real-time insights into production efficiency, quality performance, and operational trends.
Because the dashboard combines automation, visualization, and standardized KPI tracking, managers can make faster and smarter decisions. Moreover, the ability to compare MTD, YTD, and previous-year performance ensures continuous improvement.
Ultimately, companies that adopt KPI-driven management achieve higher productivity, reduced waste, and stronger operational control. Therefore, implementing this dashboard represents a smart step toward data-driven glass manufacturing excellence.
Frequently Asked Questions (FAQs)
What is a KPI dashboard in glass manufacturing?
A KPI dashboard tracks production, quality, and operational performance metrics using visual charts and automated calculations.
Can beginners use this Excel dashboard?
Yes. The dashboard uses simple input sheets and automated calculations, so beginners can operate it easily.
How often should data be updated?
You should update data daily or weekly to maintain accurate performance insights.
Can I customize KPIs?
Yes. Users can modify KPI definitions, formulas, and targets according to business needs.
Does the dashboard support yearly analysis?
Yes. It includes YTD tracking and previous-year comparisons for long-term performance evaluation.
Is Excel suitable for manufacturing analytics?
Yes. Excel provides powerful analytical capabilities while remaining cost-effective and flexible.
Can this dashboard integrate with Power BI later?
Yes. You can easily connect Excel data with Power BI for advanced visualization.
Watch the step-by-step video tutorial:
Visit our YouTube channel to learn step-by-step video tutorials
Click to buy Glassware Production KPI Dashboard in Excel