Heavy machinery plays a critical role in industries such as construction, mining, manufacturing, infrastructure, and energy. Excavators, cranes, loaders, bulldozers, and other machines operate for long hours and involve high maintenance costs. Therefore, organizations must monitor performance, operating hours, downtime, and maintenance expenses carefully.
However, when teams manage heavy machinery data through scattered Excel sheets or manual reports, insights remain hidden. As a result, costs increase, breakdowns happen unexpectedly, and decision-making becomes slow.
That is why a Heavy Machinery Dashboard in Power BI becomes a powerful and practical solution. It converts raw machinery data into interactive visuals, KPI cards, and analytical reports. Moreover, it allows managers to track operating hours, maintenance costs, downtime, and repair expenses in one centralized system.
Click to Purchases Heavy Machinery Dashboard in Power BI
In this in-depth guide, you will learn what a Heavy Machinery Dashboard in Power BI is, why it matters, how it works, its page structure, key features, advantages, best practices, and frequently asked questions. Additionally, you will understand how this dashboard supports cost control, preventive maintenance, and operational efficiency.
What Is a Heavy Machinery Dashboard in Power BI?
A Heavy Machinery Dashboard in Power BI is an interactive business intelligence solution designed to monitor and analyze key performance indicators related to heavy equipment operations.
Instead of reviewing multiple reports, managers analyze all machinery KPIs from a single dashboard. Moreover, Power BI enables users to apply slicers, filters, and drill-down options for deeper insights.
This dashboard typically tracks:
-
Average operating hours
-
Maintenance cost
-
Repair cost
-
Downtime hours
-
Machine count
-
Maintenance percentage
As a result, organizations gain real-time visibility into machinery performance across projects, plants, regions, brands, and machine types.
Why Is a Heavy Machinery Dashboard in Power BI Important?
Heavy machinery involves significant capital investment. Therefore, even small inefficiencies lead to major financial losses.
A Heavy Machinery Dashboard in Power BI becomes important because it helps organizations:
-
Monitor equipment utilization continuously
-
Control maintenance and repair costs
-
Reduce unplanned downtime
-
Improve asset lifespan
-
Support preventive maintenance planning
Moreover, when decision-makers visualize data clearly, they take faster and more confident actions.
How Does a Heavy Machinery Dashboard in Power BI Work?
A Heavy Machinery Dashboard in Power BI works by connecting raw operational data to interactive visuals.
Step-by-Step Workflow
-
Data Collection
Teams capture machinery data in Excel, ERP, or maintenance systems. -
Data Modeling
Power BI cleans, transforms, and structures the data. -
KPI Calculation
Measures calculate operating hours, downtime, maintenance cost, and repair cost. -
Visualization
Charts, cards, and tables display insights clearly. -
Interaction
Slicers allow users to filter data by plant, project, brand, or machine type.
As a result, users analyze performance instantly without manual calculations.
Page Structure of the Heavy Machinery Dashboard in Power BI
This dashboard includes 5 well-structured pages, each designed for a specific analytical purpose.
Overview Page: What Does the Overview Page Show?

The Overview Page acts as the central control panel for the entire dashboard.
Key Features of the Overview Page
-
Interactive slicers for filtering data
-
KPI cards for quick performance snapshot
-
High-level cost and utilization metrics
KPIs and Visuals on the Overview Page
-
Average Operating Hours by Project
-
Under Maintenance Machine %
-
Maintenance Cost by Shift
-
Maintenance Cost by Region
-
Repair Cost by Plant
Because this page summarizes overall performance, managers use it for quick reviews and executive reporting.
Machine Type Analysis: How Do Different Machine Types Perform?
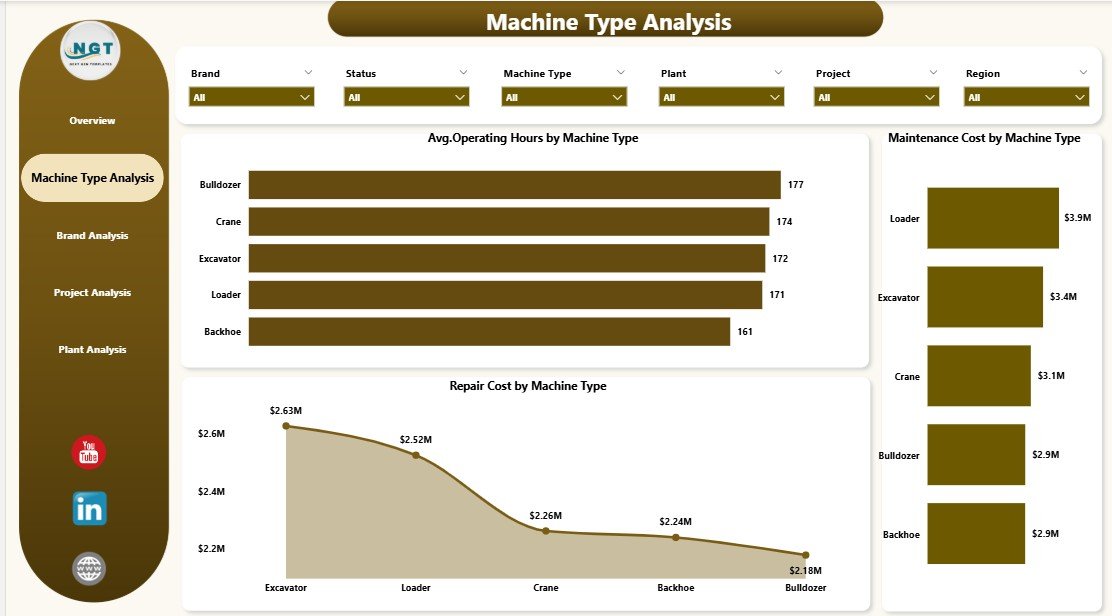
The Machine Type Analysis Page focuses on performance comparison across different machinery categories.
Key Insights Provided
-
Equipment utilization patterns
-
Cost differences across machine types
-
Maintenance and repair intensity
Charts Included
-
Average Operating Hours by Machine Type
-
Maintenance Cost by Machine Type
-
Repair Cost by Machine Type
As a result, managers identify which machine types consume higher maintenance budgets and require optimization.
Brand Analysis: Which Machinery Brands Perform Better?
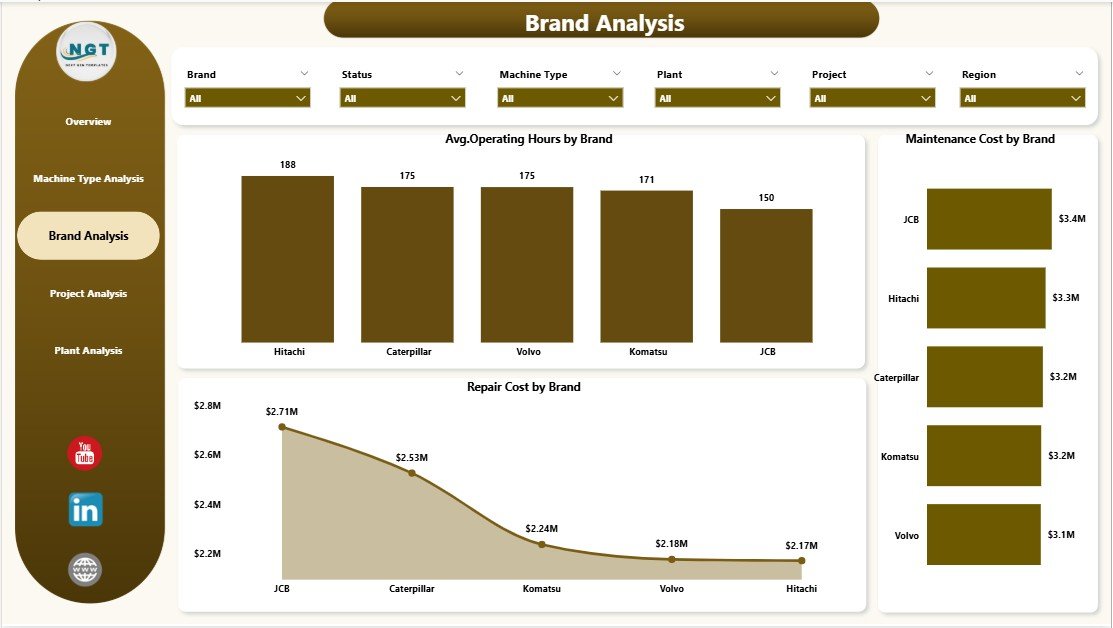
The Brand Analysis Page compares performance across machinery manufacturers.
Why Brand Analysis Matters
Different brands show different reliability, maintenance costs, and operating efficiency. Therefore, brand-level analysis supports procurement and replacement decisions.
Charts on the Brand Analysis Page
-
Average Operating Hours by Brand
-
Maintenance Cost by Brand
-
Repair Cost by Brand
With these insights, organizations select reliable brands and reduce long-term ownership costs.
Click to Purchases Heavy Machinery Dashboard in Power BI
Project Analysis: How Does Machinery Perform Across Projects?
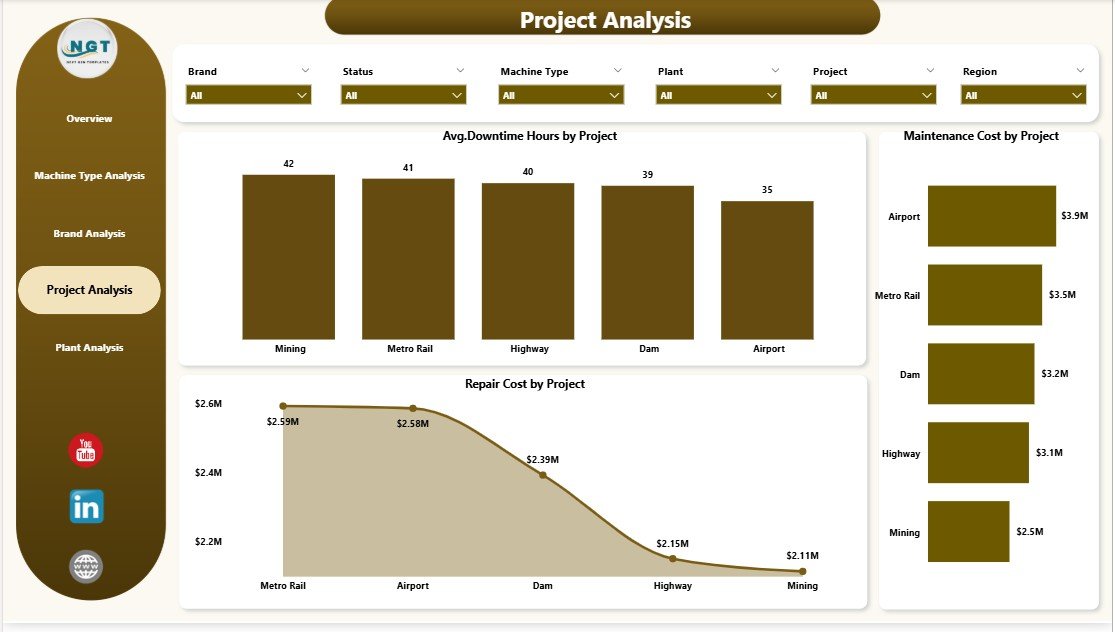
The Project Analysis Page highlights machinery performance across different projects.
Key Benefits of Project-Level Analysis
-
Identify high-downtime projects
-
Track cost overruns
-
Improve project planning
Charts Included
-
Average Downtime Hours by Project
-
Maintenance Cost by Project
-
Repair Cost by Project
As a result, project managers take corrective actions quickly.
Plant Analysis: How Efficient Are Different Plants?
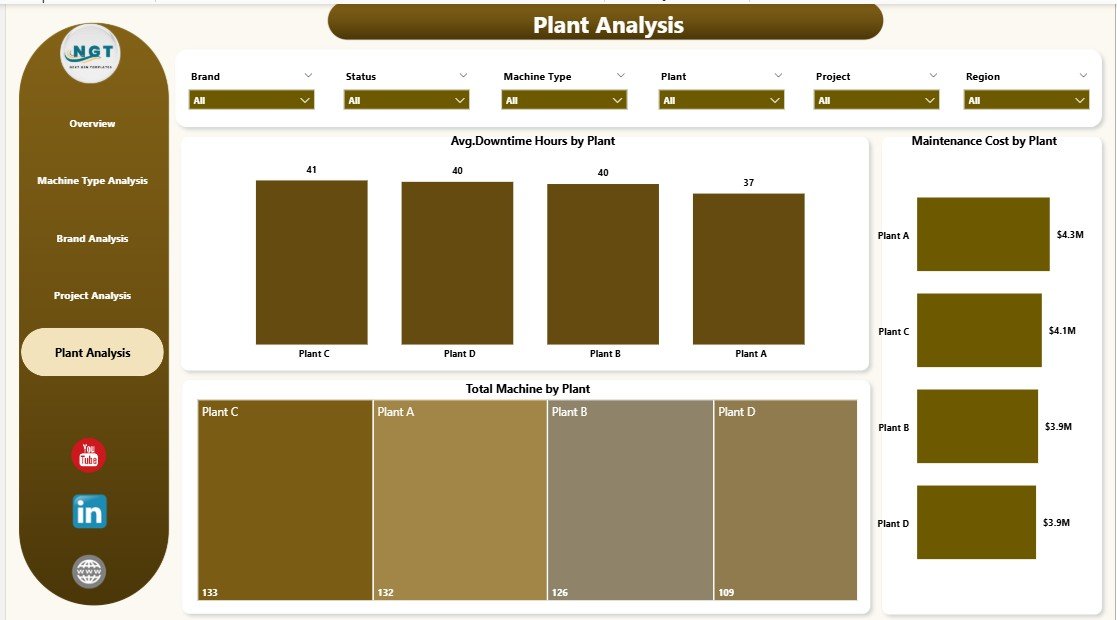
The Plant Analysis Page evaluates machinery performance at the plant level.
Key Metrics on the Plant Analysis Page
-
Average Downtime Hours by Plant
-
Maintenance Cost by Plant
-
Total Machines by Plant
This page helps operations teams optimize plant-level asset utilization.
Advantages of a Heavy Machinery Dashboard in Power BI
A Heavy Machinery Dashboard in Power BI delivers multiple operational and financial benefits.
Key Advantages
-
📊 Centralized machinery performance tracking
-
⏱️ Reduced downtime through proactive monitoring
-
💰 Better control over maintenance and repair costs
-
🔍 Clear visibility across projects, plants, and regions
-
📈 Faster and data-driven decision-making
Moreover, the dashboard improves collaboration between maintenance, operations, and management teams.
Opportunities for Improvement Using This Dashboard
While the dashboard provides strong insights, organizations can unlock even more value.
Improvement Opportunities
-
Add predictive maintenance indicators
-
Include machine age and lifecycle analysis
-
Track spare parts consumption
-
Integrate real-time IoT sensor data
-
Add cost-per-hour metrics
By enhancing data depth, organizations improve forecasting accuracy.
Best Practices for the Heavy Machinery Dashboard in Power BI
To maximize dashboard value, organizations must follow proven best practices.
Best Practices Checklist
-
✅ Keep data sources clean and consistent
-
✅ Standardize machine type and brand naming
-
✅ Update data regularly
-
✅ Use meaningful slicers
-
✅ Limit visuals to avoid clutter
-
✅ Focus on actionable KPIs
Moreover, regular review meetings ensure teams act on insights.
Who Should Use a Heavy Machinery Dashboard in Power BI?
This dashboard benefits a wide range of users.
Ideal Users
-
Operations managers
-
Maintenance managers
-
Project managers
-
Plant heads
-
Finance and cost control teams
-
Equipment procurement teams
Because the dashboard supports both operational and strategic decisions, it fits multiple roles.
How Does This Dashboard Support Cost Control?
Cost control remains a major challenge in heavy machinery operations.
The dashboard supports cost control by:
-
Tracking maintenance and repair expenses
-
Identifying cost-heavy machine types
-
Highlighting inefficient projects
-
Comparing plant-level performance
As a result, organizations reduce unnecessary spending.
How Does the Dashboard Improve Preventive Maintenance?
Preventive maintenance reduces breakdowns and extends equipment life.
This dashboard improves preventive maintenance by:
-
Monitoring operating hours
-
Tracking downtime trends
-
Identifying frequently repaired machines
-
Highlighting under-maintenance percentages
Therefore, maintenance teams schedule servicing proactively.
How Does Power BI Enhance Heavy Machinery Analysis?
Power BI offers advanced features that enhance analysis.
Power BI Capabilities
-
Interactive slicers
-
Drill-down and drill-through
-
Dynamic KPI calculations
-
Real-time data refresh
-
Secure sharing and access
Because of these features, Power BI becomes ideal for machinery analytics.
Common Challenges Solved by This Dashboard
Click to Purchases Heavy Machinery Dashboard in Power BI
Organizations often face several challenges in machinery management.
Challenges Addressed
-
Lack of visibility
-
High downtime
-
Rising maintenance costs
-
Poor asset utilization
-
Delayed decision-making
This dashboard solves these challenges through structured analytics.
Conclusion: Why Choose a Heavy Machinery Dashboard in Power BI?
A Heavy Machinery Dashboard in Power BI transforms raw operational data into actionable insights. It helps organizations monitor operating hours, downtime, maintenance cost, and repair cost from one centralized platform.
Moreover, with structured pages such as Overview, Machine Type Analysis, Brand Analysis, Project Analysis, and Plant Analysis, decision-makers gain complete visibility into machinery performance.
As a result, organizations reduce downtime, control costs, improve productivity, and extend equipment lifespan. Therefore, investing in a Heavy Machinery Dashboard in Power BI becomes a smart and strategic decision.
Frequently Asked Questions (FAQs)
What is a Heavy Machinery Dashboard in Power BI used for?
A Heavy Machinery Dashboard in Power BI tracks operating hours, maintenance cost, downtime, and repair expenses to support better equipment management.
Can this dashboard connect to Excel data?
Yes, the dashboard easily connects to Excel, ERP systems, and maintenance databases.
Who benefits the most from this dashboard?
Operations managers, maintenance teams, project managers, and plant heads benefit the most.
Does this dashboard support real-time data?
Yes, Power BI supports scheduled and real-time data refresh based on data sources.
Can we customize the dashboard KPIs?
Yes, organizations can customize KPIs, visuals, and slicers based on business needs.
Is Power BI suitable for large machinery datasets?
Yes, Power BI handles large datasets efficiently and provides fast analysis.
How does this dashboard reduce downtime?
It identifies downtime trends early and supports preventive maintenance planning.
Visit our YouTube channel to learn step-by-step video tutorials