In the fast-paced world of hospitality, maintaining exceptional service quality while managing costs, occupancy, and guest satisfaction can be challenging. Every decision — from staffing to pricing — impacts overall performance. To stay ahead, hotel managers, restaurant owners, and hospitality executives rely on data-driven insights that help them monitor, analyze, and improve operations efficiently.
That’s where the Hospitality KPI Scorecard in Excel comes into play.
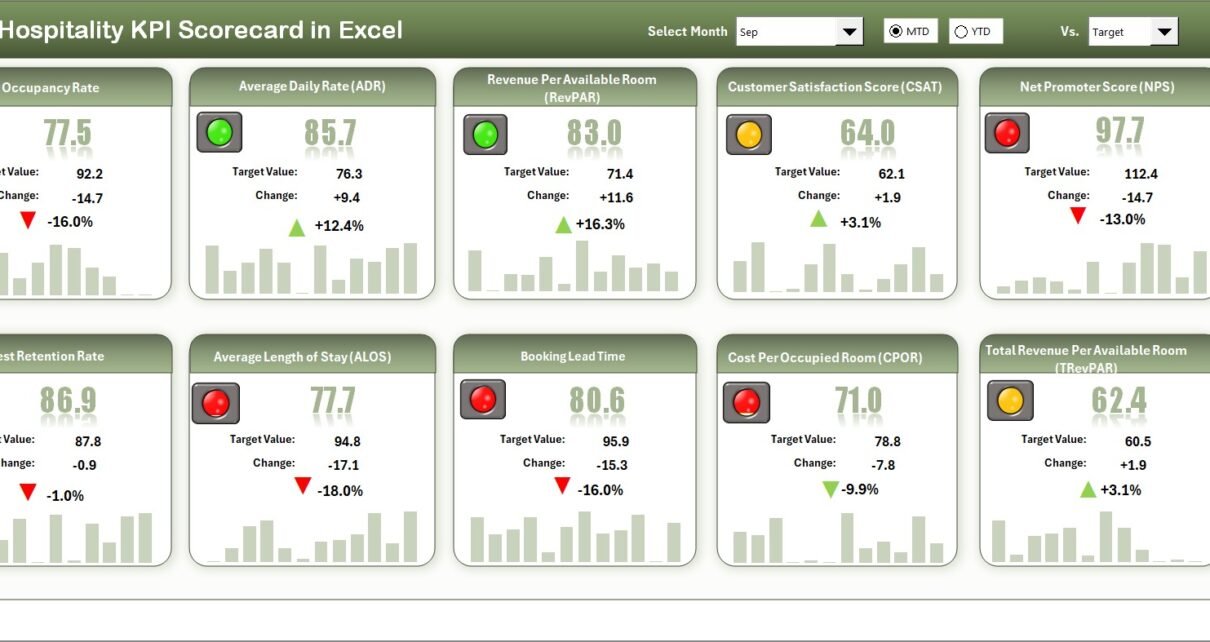
This powerful, ready-to-use Excel template simplifies performance tracking by consolidating all critical Key Performance Indicators (KPIs) into one interactive dashboard. It provides Month-to-Date (MTD) and Year-to-Date (YTD) comparisons, visual indicators, and customizable data fields — empowering hospitality professionals to make informed decisions quickly.
Click to buy Hospitality KPI Scorecard in Excel
What Is a Hospitality KPI Scorecard in Excel?
A Hospitality KPI Scorecard in Excel is a performance management tool designed to measure and monitor key metrics in the hospitality industry — such as occupancy rate, revenue per available room (RevPAR), guest satisfaction score, and employee efficiency.
This Excel-based scorecard centralizes data from multiple sources, compares Actual vs Target performance, and displays trends using charts and conditional formatting.
By combining clarity with visual appeal, it helps decision-makers see what’s working, identify underperforming areas, and take immediate corrective actions.
Key Features of the Hospitality KPI Scorecard in Excel
This KPI scorecard is built for hotels, resorts, restaurants, travel lodges, and hospitality chains of all sizes. It includes four primary worksheet tabs, each designed to deliver actionable insights.
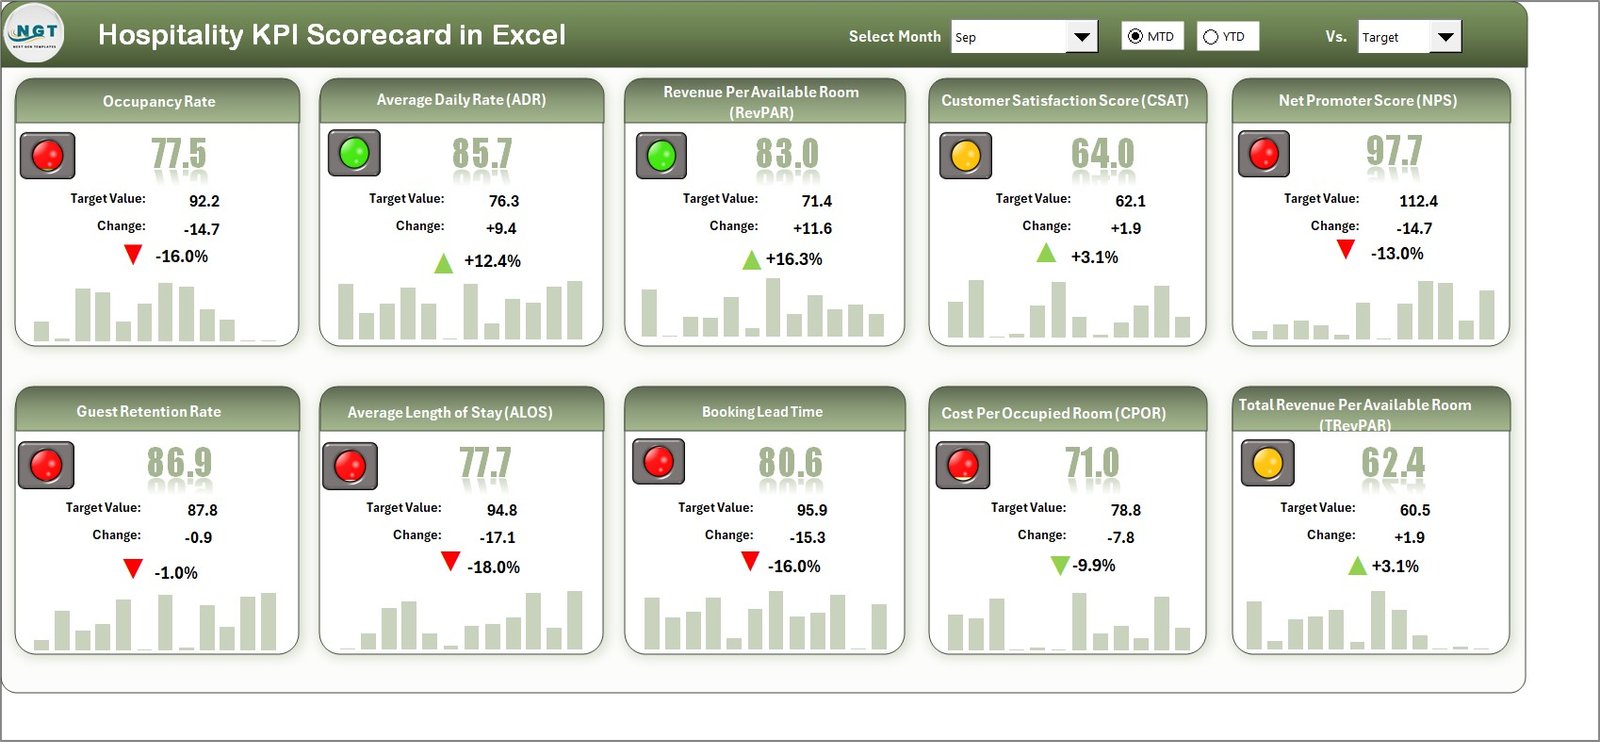
Scorecard Sheet – The Performance Dashboard
The Scorecard Sheet acts as the main control panel where users can evaluate performance across multiple KPIs at a glance.
Key highlights include:
- Dropdown Menus: Quickly select the month, and choose between MTD or YTD analysis.
- Actual vs Target Comparison: Instantly compare performance against predefined targets.
- Visual Indicators: Use color-coded icons or conditional formatting to highlight KPIs performing above or below expectations.
- Comprehensive Overview: View up to 10 KPIs simultaneously, giving a full snapshot of operational efficiency.
This sheet is ideal for daily or weekly performance meetings, where quick insights are vital.
Click to buy Hospitality KPI Scorecard in Excel
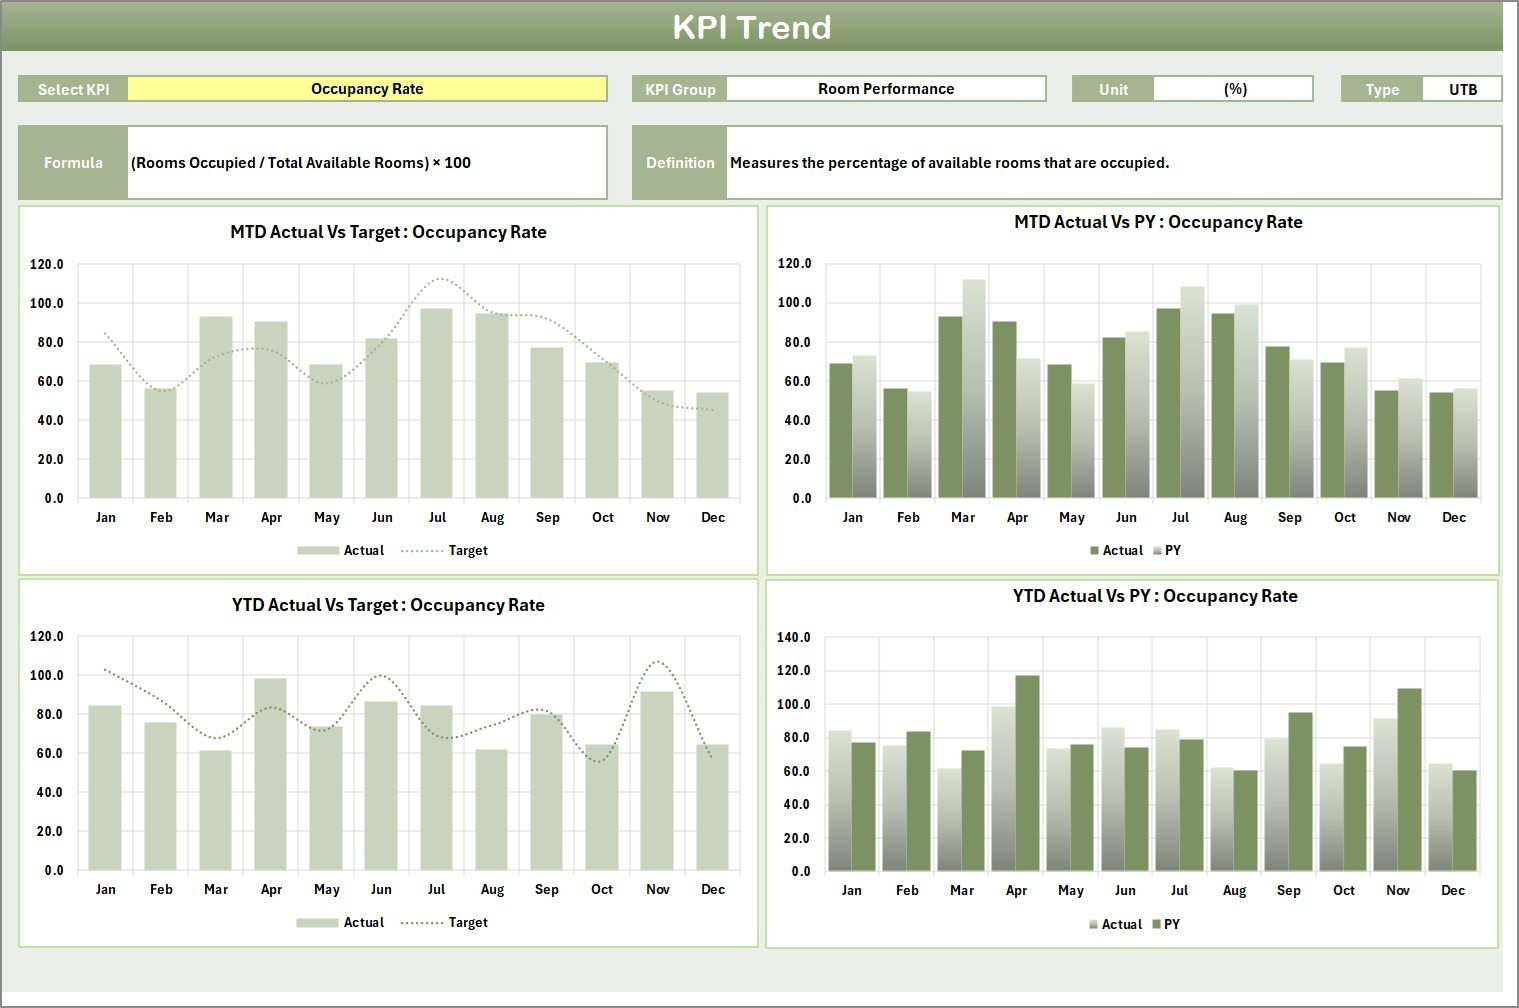
KPI Trend Sheet – Understanding the Movement of Metrics
The KPI Trend Sheet is designed to help managers and analysts dive deeper into each KPI’s trend.
Features include:
- KPI Selection Dropdown (Cell C3): Choose any KPI from the dropdown to view detailed metrics.
- KPI Group & Unit Display: Shows KPI Group (e.g., Finance, Operations, Customer Experience), Unit of Measurement, and Type (UTB – Upper the Better or LTB – Lower the Better).
- Formula and Definition: Each KPI includes a clear formula and definition to ensure consistent understanding across departments.
- MTD & YTD Trend Charts: Visualize trends for Actual, Target, and Previous Year (PY) data in an easy-to-interpret line or column chart.
This tab is essential for identifying performance patterns over time.
Click to buy Hospitality KPI Scorecard in Excel
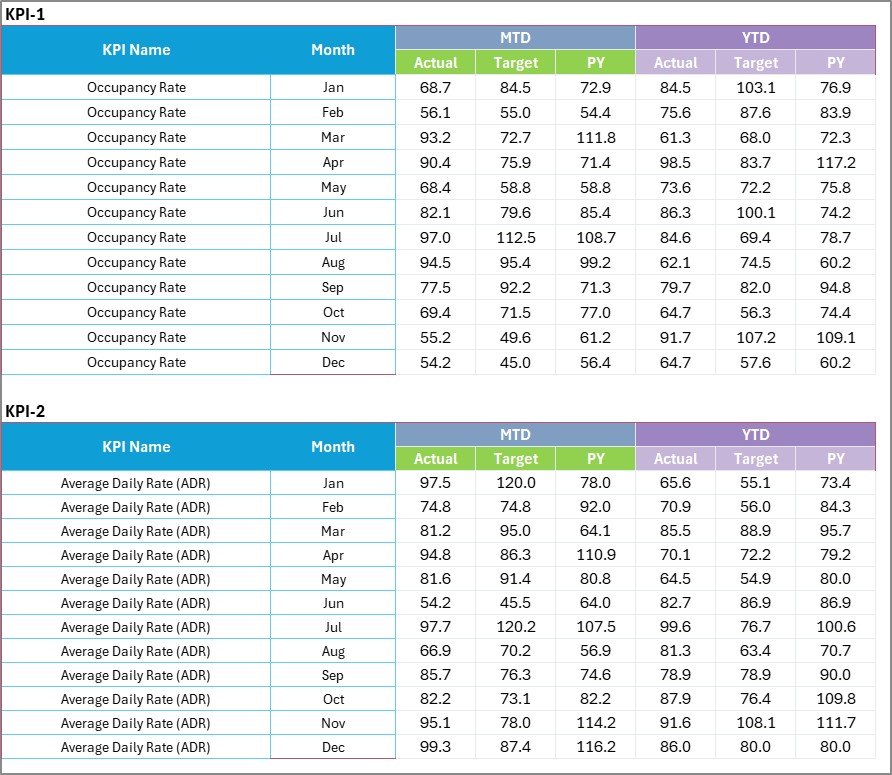
Input Data Sheet – The Data Backbone
The Input Data Sheet acts as the central repository where users record all KPI data.
Main functionalities include:
- Data Entry Fields: Add actual performance figures, target values, and prior year benchmarks.
- Dynamic Updating: As new results come in, updating the data automatically refreshes the entire scorecard.
- Flexibility: Adaptable for hotels, restaurants, or chains of multiple outlets.
This structure ensures data accuracy and consistency across reports.
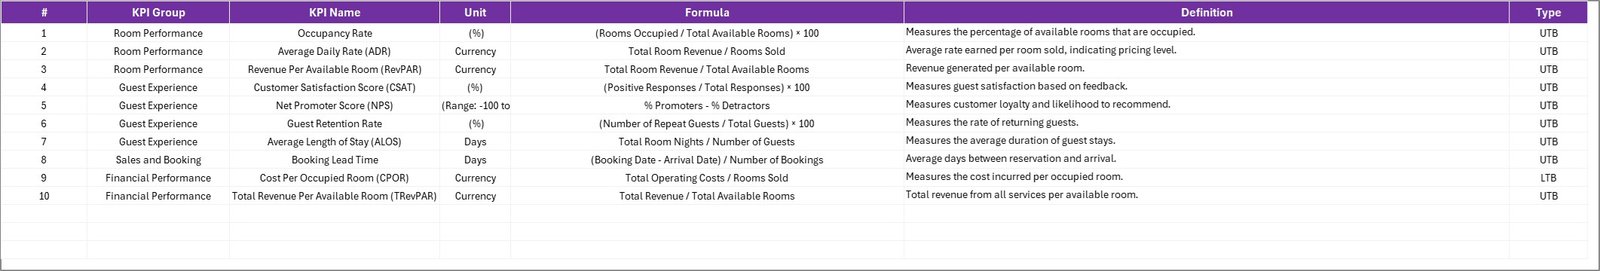
KPI Definition Sheet – The Knowledge Base
To ensure everyone interprets metrics the same way, the KPI Definition Sheet stores important metadata about each KPI.
It contains:
- KPI Name & Group
- Unit of Measurement (%, USD, Count, etc.)
- Formula for Calculation
- Definition & Interpretation Guide
This promotes alignment and transparency across all reporting levels.
Why Use a Hospitality KPI Scorecard in Excel?
The hospitality industry thrives on efficiency, quality, and customer experience. However, tracking performance across departments — from housekeeping to food service — can be overwhelming.
A well-designed KPI Scorecard simplifies this process by:
- Bringing all key data into one structured format
- Allowing trend analysis for MTD and YTD
- Comparing actual vs target and vs previous year
- Highlighting performance gaps with visual cues
- Enabling continuous performance improvement
Ultimately, it helps organizations shift from reactive decision-making to proactive performance management.
Important KPIs to Track in the Hospitality Industry
Every hospitality business has unique goals, but the following KPIs are universally important:
Operational KPIs
- Occupancy Rate (%): Measures the percentage of available rooms occupied over a specific period.
- Average Daily Rate (ADR): Indicates the average revenue earned per occupied room.
- Revenue per Available Room (RevPAR): A critical measure combining occupancy and ADR to assess profitability.
- Average Check Value: Tracks the average customer spending per transaction in restaurants or cafes.
Customer Experience KPIs
- Guest Satisfaction Score (GSS): Reflects customer happiness through survey data.
- Online Review Rating: Aggregated from platforms like Google, TripAdvisor, and Booking.com.
- Complaint Resolution Time: Measures how quickly guest complaints are resolved.
Financial KPIs
- Total Revenue: Tracks income from all streams — rooms, food & beverage, events, etc.
- Operating Margin (%): Shows how efficiently operations generate profits.
- Cost per Occupied Room (CPOR): Helps manage expenses per room sold.
Workforce and Service KPIs
- Employee Turnover Rate: Indicates HR effectiveness in retaining staff.
- Training Hours per Employee: Measures investment in staff development.
- Service Response Time: Tracks how promptly staff attend to guest requests.
These KPIs collectively shape the performance landscape of any hospitality business.
How the Hospitality KPI Scorecard Works
The Hospitality KPI Scorecard in Excel integrates data inputs, KPI definitions, and visualization into one dynamic file.
Here’s how it functions step-by-step:
Input Data: Enter monthly performance values in the Input Data sheet.
Auto-Calculation: Excel formulas compute actual vs target and generate variance percentages.
Scorecard Update: The Scorecard sheet automatically refreshes with new figures.
Visualization: Charts and indicators display real-time performance changes.
Analysis: The KPI Trend sheet allows a detailed review of any specific metric.
This seamless workflow transforms raw data into actionable intelligence.
Advantages of Using the Hospitality KPI Scorecard in Excel
1. Centralized Data Management
All performance indicators are available in one file, eliminating the need for multiple spreadsheets or manual consolidation.
2. Real-Time Decision Support
Instant comparisons of actual vs target help managers take immediate corrective actions.
3. Visual Insights
Charts, graphs, and color indicators make complex data easy to interpret for everyone — from frontline supervisors to top executives.
4. Customizable and Scalable
The template can be modified to include new KPIs, departments, or even hotel branches as the business expands.
5. Cost-Effective and User-Friendly
Unlike expensive BI tools, Excel offers a familiar interface with no licensing costs, making this scorecard accessible to all.
6. Performance Transparency
Department heads can see exactly where they stand, fostering accountability and continuous improvement.
How to Customize the Scorecard for Your Organization
Adapting the Hospitality KPI Scorecard to your specific business setup is easy.
Follow these simple steps:
- Add New KPIs: Use the KPI Definition sheet to define new performance metrics.
- Update Data Ranges: Adjust data validation lists for months and KPI groups.
- Design Department-Specific Tabs: Create copies of the Scorecard sheet for HR, Finance, or Operations.
- Integrate Macros (Optional): Add automation features such as refresh buttons or data import scripts.
With just a few tweaks, the template becomes your organization’s personalized performance management system.
Real-World Example of KPI Tracking in Hospitality
Let’s consider a mid-sized hotel chain that tracks 10 KPIs monthly using this Excel scorecard.
For September 2024, the following results appear:
- Occupancy Rate: 82% (Target 80%)
- ADR: $120 (Target $125)
- RevPAR: $98 (Target $100)
- Guest Satisfaction: 4.5/5 (Target 4.2/5)
- Operating Margin: 23% (Target 22%)
Using color indicators, the scorecard highlights green for metrics exceeding the target and red for those lagging behind. This allows managers to quickly spot improvement areas and plan actionable strategies.
Best Practices for the Hospitality KPI Scorecard in Excel
To make the most of your KPI Scorecard, follow these proven best practices:
1. Keep KPIs Aligned with Business Goals
Every KPI should reflect organizational objectives, such as enhancing guest experience or optimizing costs.
2. Update Data Regularly
Update actual and target data on a monthly or weekly basis for accurate reporting.
3. Use Conditional Formatting
Color coding and symbols (✅/❌) help in visual differentiation between achieved and missed targets.
4. Document KPI Definitions
Always maintain clear definitions and formulas for KPIs in the definition sheet to avoid misinterpretation.
5. Review Trends Periodically
Use the KPI Trend sheet to evaluate historical performance and forecast future outcomes.
6. Share Reports Across Teams
Distribute scorecards among departments to encourage a culture of transparency and data-driven accountability.
7. Automate Where Possible
Add simple Excel macros to refresh charts or copy data automatically to save time.
Following these steps ensures consistency, clarity, and reliability in your performance tracking.
Challenges Faced Without a KPI Scorecard
Without a centralized KPI scorecard, hospitality businesses often face:
- Data scattered across multiple files
- Delayed performance reviews
- Poor visibility into department performance
- Inaccurate comparisons between actual and target
- Lack of accountability
Implementing a unified Excel-based system resolves these issues instantly.
The Impact of KPI Scorecards on Hospitality Businesses
Adopting a structured KPI monitoring system transforms the way hospitality businesses operate.
Here’s what changes:
- Improved Decision-Making: Managers base choices on facts, not assumptions.
- Enhanced Guest Experience: Consistent service quality improves customer loyalty.
- Better Resource Utilization: Staff and budgets are allocated more effectively.
- Revenue Growth: Focused attention on underperforming areas increases profitability.
These benefits make KPI scorecards indispensable in today’s competitive environment.
Conclusion
The Hospitality KPI Scorecard in Excel is more than a template — it’s a comprehensive performance management system that brings clarity, consistency, and control to your hospitality operations.
By organizing KPIs across Scorecard, Trend, Input, and Definition sheets, it allows for both a high-level overview and detailed insights. Managers can track MTD and YTD trends, visualize performance gaps, and make smarter decisions faster.
Whether you’re running a boutique hotel, a restaurant chain, or a resort group, this Excel-based scorecard is your gateway to data-driven success.
Frequently Asked Questions (FAQs)
- What is a Hospitality KPI Scorecard used for?
It’s used to track and analyze key performance indicators across hospitality functions like rooms, dining, operations, and guest experience to improve efficiency and profitability.
- Can I customize the KPI list in this template?
Yes, the template is fully customizable. You can add or modify KPIs in the KPI Definition sheet and adjust formulas accordingly.
- How often should I update the data?
You should update it monthly or weekly depending on your reporting cycle and business requirements.
- Does this scorecard work for restaurants as well?
Absolutely. You can tailor it for restaurants, cafes, or resorts by modifying the KPIs relevant to food service or customer satisfaction.
- How does it compare with Power BI or other BI tools?
While Power BI offers advanced automation, Excel provides flexibility, simplicity, and affordability — making it ideal for small to mid-sized businesses.
- Can I track multiple branches using one file?
Yes. You can add a “Branch” column in the Input Data sheet and filter performance by location using slicers or pivot tables.
- Is technical knowledge required to use it?
Not at all. Anyone with basic Excel skills can use and update the scorecard easily.
Visit our YouTube channel to learn step-by-step video tutorials
Watch the step-by-step video tutorial:
Click to buy Hospitality KPI Scorecard in Excel