In the healthcare industry, every second counts and every decision impacts lives. To ensure hospitals operate efficiently, data transparency and timely insights are essential. That’s where the Hospitals KPI Dashboard in Power BI comes in — a powerful, ready-to-use analytics tool designed to monitor performance, improve patient care, and optimize hospital management.
This dashboard combines clinical, operational, and financial KPIs into one centralized system, giving healthcare leaders the ability to track performance and make data-driven decisions quickly and accurately. Built using Microsoft Power BI and integrated with Excel data sources, it provides real-time visibility into all major hospital functions.
Click to Purchases Hospitals KPI Dashboard in Power BI
🧩 What Is a Hospitals KPI Dashboard in Power BI?
A Hospitals KPI Dashboard is a visual analytics solution that helps track key performance indicators (KPIs) such as patient satisfaction, bed occupancy, treatment turnaround time, doctor efficiency, and financial performance.
By connecting Power BI to hospital data sources, managers and administrators can monitor trends, detect issues, and identify opportunities for improvement — all through interactive visuals and dynamic filters.
Unlike traditional spreadsheets or static reports, this Power BI dashboard allows you to interact with data, apply filters like Month or KPI Group, and drill through detailed insights with just a click.
Click to Purchases Hospitals KPI Dashboard in Power BI
⚙️ Structure of the Hospitals KPI Dashboard
The Hospitals KPI Dashboard in Power BI includes three analytical pages that together deliver a complete performance monitoring experience.
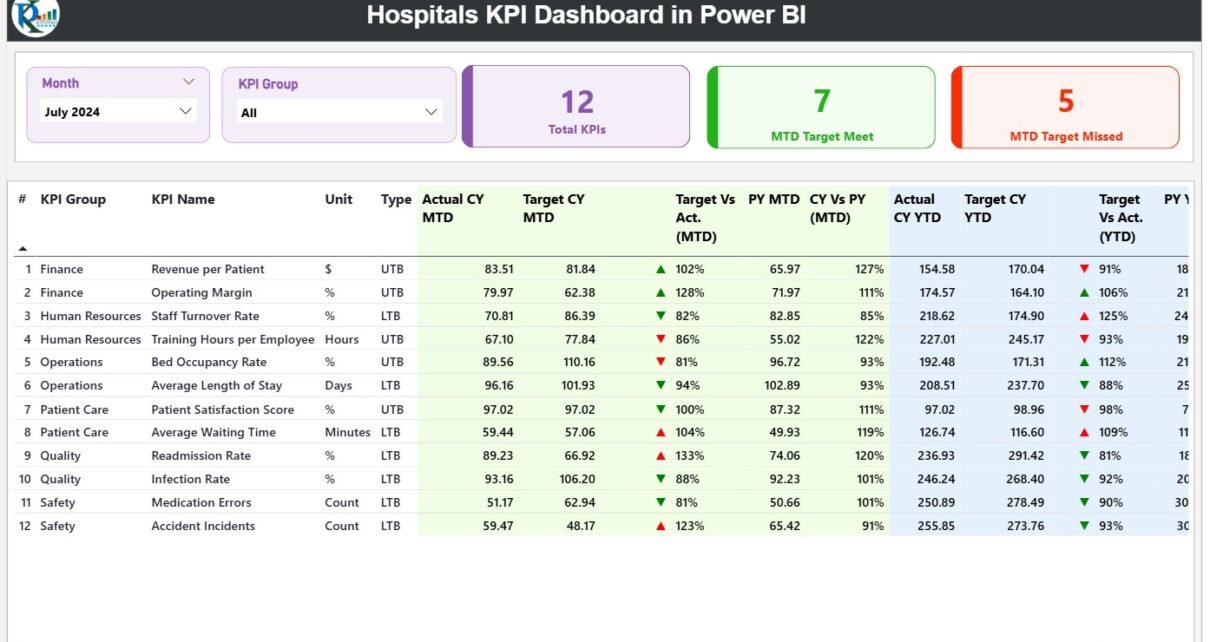
🩺 1️⃣ Summary Page — The Central Command Center
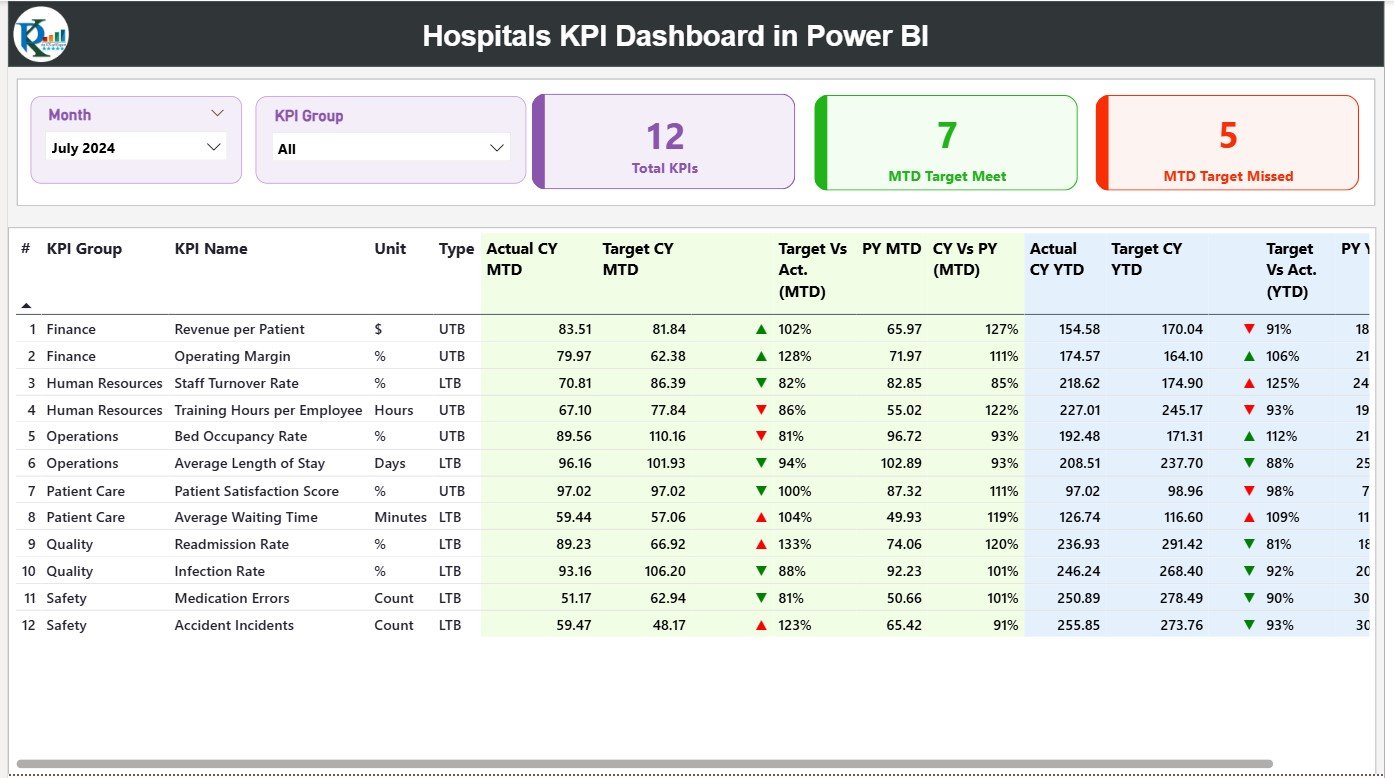
The Summary Page is the heart of the dashboard. It provides a comprehensive overview of all hospital KPIs and their performance against targets.
🔍 Key Highlights:
-
Slicers:
Month and KPI Group filters at the top make it easy to focus on specific time periods or performance categories. -
KPI Performance Cards:
Three cards summarize performance:-
Total KPIs Count
-
MTD (Month-to-Date) Target Met Count
-
MTD Target Missed Count
-
-
Detailed KPI Table:
A performance table displays:-
KPI Number (sequence ID)
-
KPI Group (Operational, Clinical, Financial, etc.)
-
KPI Name
-
Unit of Measurement
-
Type (UTB – Upper the Better, LTB – Lower the Better)
-
Actual CY MTD / Target CY MTD
-
Performance Icons (▲ ▼) showing whether KPIs meet or miss their targets.
-
Target vs Actual (MTD) percentage.
-
Previous Year (PY) Comparisons for both MTD and YTD metrics.
-
YTD Icons for visual target indicators.
-
Each KPI row shows red or green arrows based on its performance, making it easy for hospital administrators to understand the overall operational health in seconds.
💡 Example: If “Average Patient Waiting Time” is lower than the target, a green ▲ icon appears. If it’s higher, the cell turns red with a ▼ icon — instantly signaling the need for review.
📈 2️⃣ KPI Trend Page — Tracking Progress Over Time
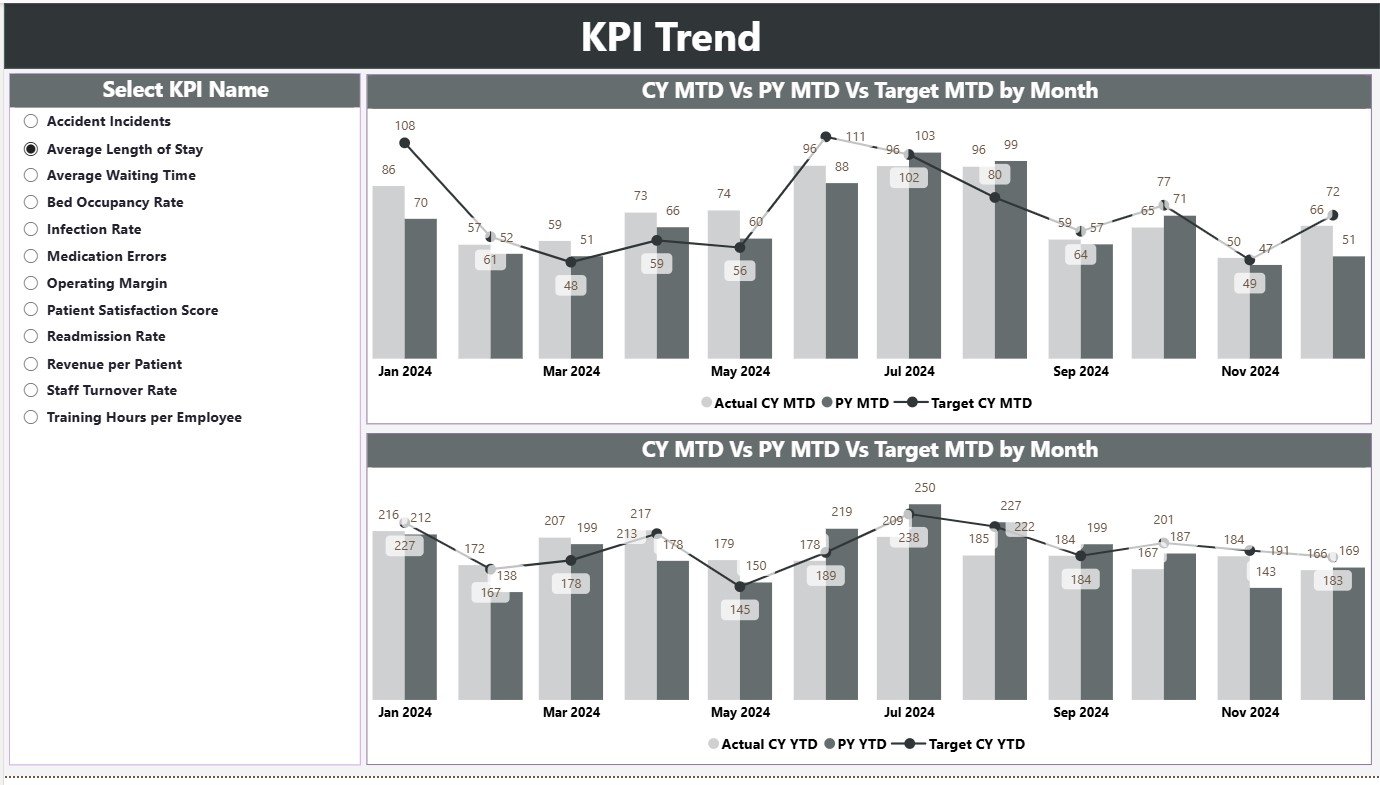
This page provides trend analysis through combo charts that plot Actual, Target, and Previous Year performance for both MTD and YTD metrics.
🩸 Key Features:
-
Slicer: Select any KPI name to view its detailed trend.
-
Dual Combo Charts:
-
Chart 1 — MTD Trend: Displays monthly comparison for current, previous, and target data.
-
Chart 2 — YTD Trend: Shows cumulative progress toward annual goals.
-
-
Dynamic Visualization: Enables healthcare teams to spot trends and anomalies instantly.
💬 Example: When tracking “Bed Occupancy Rate (%)”, you can easily identify if occupancy improved from last year and whether it aligns with capacity goals.
Click to Purchases Hospitals KPI Dashboard in Power BI
📜 3️⃣ KPI Definition Page — Deep Dive into KPI Details
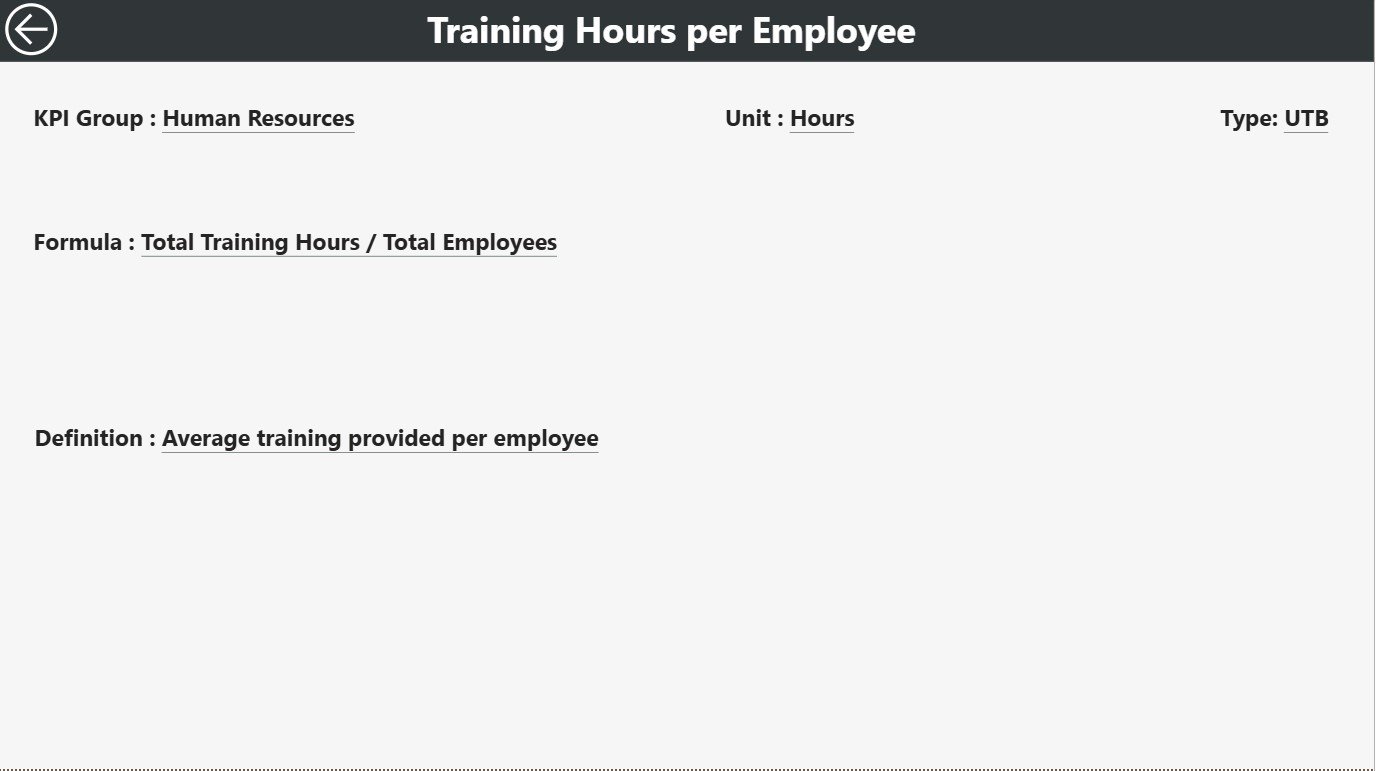
The KPI Definition Page acts as a drill-through view, allowing users to explore the logic and context behind each KPI.
⚡ Highlights:
-
Hidden by default but accessible through drill-through from the Summary Page.
-
Displays each KPI’s Formula, Definition, Type (LTB or UTB), and Measurement Unit.
-
A Back Button on the top-left corner brings you back to the main page instantly.
This feature ensures users can understand exactly how each KPI is calculated — creating transparency and consistency across the hospital network.
📊 Excel Data Integration — Simple, Flexible, and Reliable
The data source for this Power BI dashboard is a well-structured Excel file containing three main worksheets:
🧾 1. Input_Actual Sheet
-
Record actual KPI numbers for each month.
-
Columns: KPI Name, Month (first date of month), MTD Value, and YTD Value.
-
Automatically feeds live data into Power BI visuals.
🎯 2. Input_Target Sheet
-
Stores the target values for every KPI.
-
Columns: KPI Name, Month, MTD Target, YTD Target.
-
Ensures precise comparison of performance versus goals.
📚 3. KPI Definition Sheet
-
Serves as the KPI database containing:
-
KPI Number
-
KPI Group
-
KPI Name
-
Unit
-
Formula
-
Definition
-
Type (LTB or UTB)
-
All data updates from these sheets reflect automatically in Power BI, ensuring that reports remain accurate and current.
🧠 Importance of KPIs in Hospital Management
Hospitals generate vast amounts of data daily — from admissions to discharges, costs, and clinical outcomes. Without proper tracking, this data remains underutilized. KPIs bridge that gap by converting raw information into measurable indicators.
A Hospitals KPI Dashboard helps management to:
-
Monitor the quality of care and patient satisfaction.
-
Optimize staff allocation and resource utilization.
-
Control operational costs and reduce inefficiencies.
-
Maintain regulatory compliance and accreditation standards.
-
Benchmark performance across departments or facilities.
🩺 Common KPIs for Hospitals in Power BI Dashboards
To make your dashboard meaningful, include KPIs from all major areas of hospital operations.
🧬 1. Clinical KPIs
-
Patient Satisfaction Score (%)
-
Average Waiting Time (minutes)
-
Bed Occupancy Rate (%)
-
Readmission Rate (%)
-
Surgery Success Rate (%)
-
Average Length of Stay (days)
💸 2. Financial KPIs
-
Revenue per Patient (USD)
-
Average Cost per Admission
-
Operating Margin (%)
-
Claim Rejection Rate (%)
-
Billing Accuracy (%)
👨⚕️ 3. Operational KPIs
-
Doctor-to-Patient Ratio
-
Nurse Utilization Rate (%)
-
Equipment Downtime (hours)
-
Emergency Response Time (minutes)
-
Outpatient Conversion Rate (%)
🧑🤝🧑 4. Workforce KPIs
-
Staff Turnover Rate (%)
-
Training Hours per Employee
-
Absenteeism Rate (%)
-
Overtime Hours (%)
🧯 5. Safety and Compliance KPIs
-
Incident Reporting Rate
-
Compliance Audit Score (%)
-
Infection Rate (%)
-
Safety Training Completion (%)
Tracking these KPIs ensures that the hospital remains efficient, compliant, and patient-focused.
Click to Purchases Hospitals KPI Dashboard in Power BI
🌟 Advantages of Hospitals KPI Dashboard in Power BI
1. Centralized Performance Tracking
Monitor every department — from administration to surgery — on a single screen.
2. Real-Time Decision-Making
Dynamic visuals and live connections ensure leaders make fast, informed choices.
3. Improved Patient Care
Quickly identify bottlenecks affecting patient experience, treatment speed, and quality.
4. Resource Optimization
Understand how beds, staff, and equipment are utilized — minimizing waste and delays.
5. Benchmarking & Accountability
Compare departments and set measurable improvement goals.
6. Simplified Reporting
Eliminate manual report creation with automated dashboards that update in real time.
7. Scalability & Customization
Easily add new KPIs, departments, or financial metrics as your hospital grows.
🧩 Opportunities for Improvement
While the dashboard provides immense value, you can enhance it further with the following improvements:
-
Integrate live data feeds from Hospital Information Systems (HIS) or Electronic Health Records (EHRs).
-
Add Power BI alerts for threshold breaches (e.g., occupancy exceeding 90%).
-
Connect with Power Automate for automated report distribution.
-
Include drill-down pages for department-level performance.
-
Apply predictive analytics to forecast patient load and resource needs.
Implementing these enhancements can transform your dashboard from a monitoring tool into a strategic decision engine.
Click to Purchases Hospitals KPI Dashboard in Power BI
🏆 Best Practices for Using Hospitals KPI Dashboard in Power BI
Follow these best practices to ensure your dashboard remains accurate, insightful, and impactful:
✅ 1. Define Clear KPIs
Make sure each KPI has a clear owner, definition, and data source.
✅ 2. Keep Data Fresh
Update your Excel or database connections regularly to maintain data accuracy.
✅ 3. Use Slicers Effectively
Provide intuitive filters like Department, Region, or Month for flexible analysis.
✅ 4. Apply Conditional Formatting
Use consistent colors for positive (green) and negative (red) trends for visual clarity.
✅ 5. Validate Data
Before publishing updates, verify that all formulas and aggregations display correctly.
✅ 6. Protect Sensitive Data
Restrict access to patient-level details and apply data-masking if necessary.
✅ 7. Document Every KPI
Maintain detailed documentation of formulas and definitions in the KPI Definition sheet.
✅ 8. Automate Data Refresh
Schedule Power BI refresh cycles to keep dashboards live without manual updates.
✅ 9. Encourage Data Literacy
Train hospital staff to interpret dashboard visuals and insights effectively.
✅ 10. Review and Improve Regularly
Conduct quarterly reviews to refine KPIs based on changing hospital goals.
🧮 Example Use Case — Improving Hospital Efficiency
Imagine a hospital using this dashboard for monthly reviews:
-
Average Waiting Time: 42 minutes vs Target 30 minutes → 🔴 Needs optimization.
-
Bed Occupancy Rate: 88% vs Target 85% → 🟢 Excellent utilization.
-
Claim Rejection Rate: 8% vs Target 5% → ⚠️ Review billing process.
-
Revenue per Patient: $1,250 vs Target $1,200 → ✅ Performing well.
These insights empower leaders to take corrective actions immediately rather than waiting for end-of-quarter reports.
📈 How This Dashboard Supports Decision-Making
The Hospitals KPI Dashboard in Power BI supports:
-
Operational Transparency: Managers see what’s happening in real time.
-
Goal Alignment: Everyone works toward the same measurable objectives.
-
Efficiency Improvement: Identify problem areas before they escalate.
-
Regulatory Compliance: Track and document metrics for audits.
-
Data-Driven Culture: Encourage staff to make decisions based on insights, not assumptions.
🧭 Conclusion
The Hospitals KPI Dashboard in Power BI is a game-changing solution for modern healthcare management. It transforms complex datasets into clear, actionable visuals that enhance transparency, accountability, and efficiency across the organization.
By integrating Excel data sources and Power BI’s visualization power, this dashboard delivers everything from real-time performance monitoring to strategic forecasting — empowering hospitals to deliver better care while maintaining financial stability.
Click to Purchases Hospitals KPI Dashboard in Power BI
💬 Frequently Asked Questions (FAQs)
1. What is a Hospitals KPI Dashboard in Power BI?
It’s an interactive data visualization tool that tracks and analyzes hospital performance metrics such as patient satisfaction, costs, and efficiency.
2. Why should hospitals use Power BI for KPI tracking?
Power BI simplifies complex healthcare data into interactive visuals, making performance monitoring faster and easier.
3. Can I add new KPIs to this dashboard?
Yes. You can easily add or modify KPIs in the Excel data source and refresh the dashboard.
4. How often should I update the Excel data?
You should update it monthly or weekly depending on hospital reporting cycles to maintain accuracy.
5. Can I link this dashboard with live hospital systems?
Yes. You can connect Power BI with HIS, EHR, or SQL databases for real-time reporting.
6. What visuals are used in the dashboard?
It includes KPI cards, combo charts, tables, and icons with conditional formatting for intuitive visualization.
7. Is this dashboard secure?
Yes. You can control access through Power BI service permissions and apply data masking to sensitive fields.
8. Does it require coding knowledge?
No. The dashboard is built using Power BI’s drag-and-drop interface, making it user-friendly and easy to maintain.
Click to Purchases Hospitals KPI Dashboard in Power BI
Visit our YouTube channel to learn step-by-step video tutorials