In today’s talent-driven business world, organizations rely heavily on data to make strategic hiring decisions. The recruitment process has evolved from intuition-based judgments to data-driven insights that enable faster, smarter, and more effective hiring. One of the most powerful tools that supports this transformation is the Executive Search & Staffing KPI Dashboard in Power BI.
This interactive dashboard helps staffing firms, HR professionals, and talent acquisition teams track performance metrics, identify gaps, and optimize the recruitment pipeline in real time. Built entirely in Power BI, it centralizes all key performance indicators (KPIs) into one visual platform, giving leaders a clear view of their hiring efficiency, recruiter productivity, and client satisfaction.
Let’s explore this dynamic dashboard — its features, structure, benefits, and best practices for maximizing your staffing analytics.
Click to Purchases Executive Search & Staffing KPI Dashboard in Power BI
What Is an Executive Search & Staffing KPI Dashboard in Power BI?
An Executive Search & Staffing KPI Dashboard in Power BI is a visual reporting solution that consolidates recruitment and staffing data into a single, easy-to-analyze workspace. It brings together data from Excel or other HR systems, allowing you to track progress against targets, measure recruiter performance, and identify trends over time.
Instead of manually preparing reports in spreadsheets, this Power BI dashboard automates the visualization process. Users can filter by month, KPI group, or recruiter, and instantly view metrics such as:
-
Number of candidates sourced
-
Conversion rate per recruitment stage
-
Time to fill critical roles
-
Offer acceptance rate
-
Client satisfaction score
-
Cost per hire
-
Candidate engagement level
By centralizing all these metrics, decision-makers can focus more on strategy and less on manual reporting.
Structure of the Executive Search & Staffing KPI Dashboard
This dashboard has three main pages, each serving a unique analytical purpose. It also connects directly to an Excel data source, ensuring the numbers stay up-to-date with minimal manual intervention.
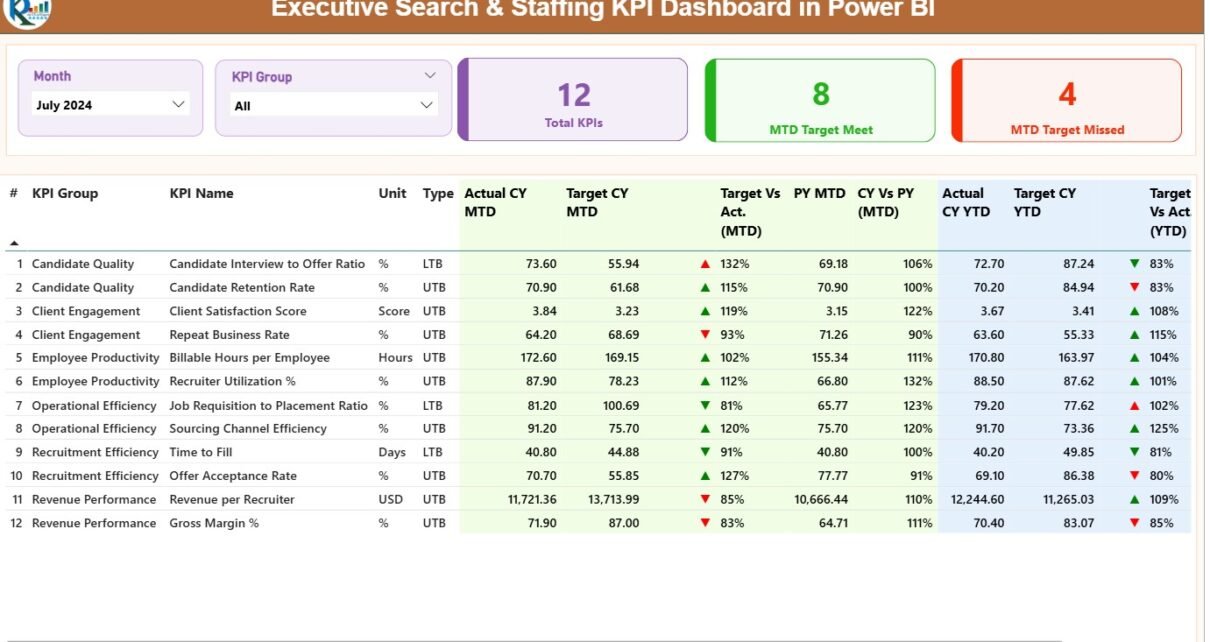
1️⃣ Summary Page
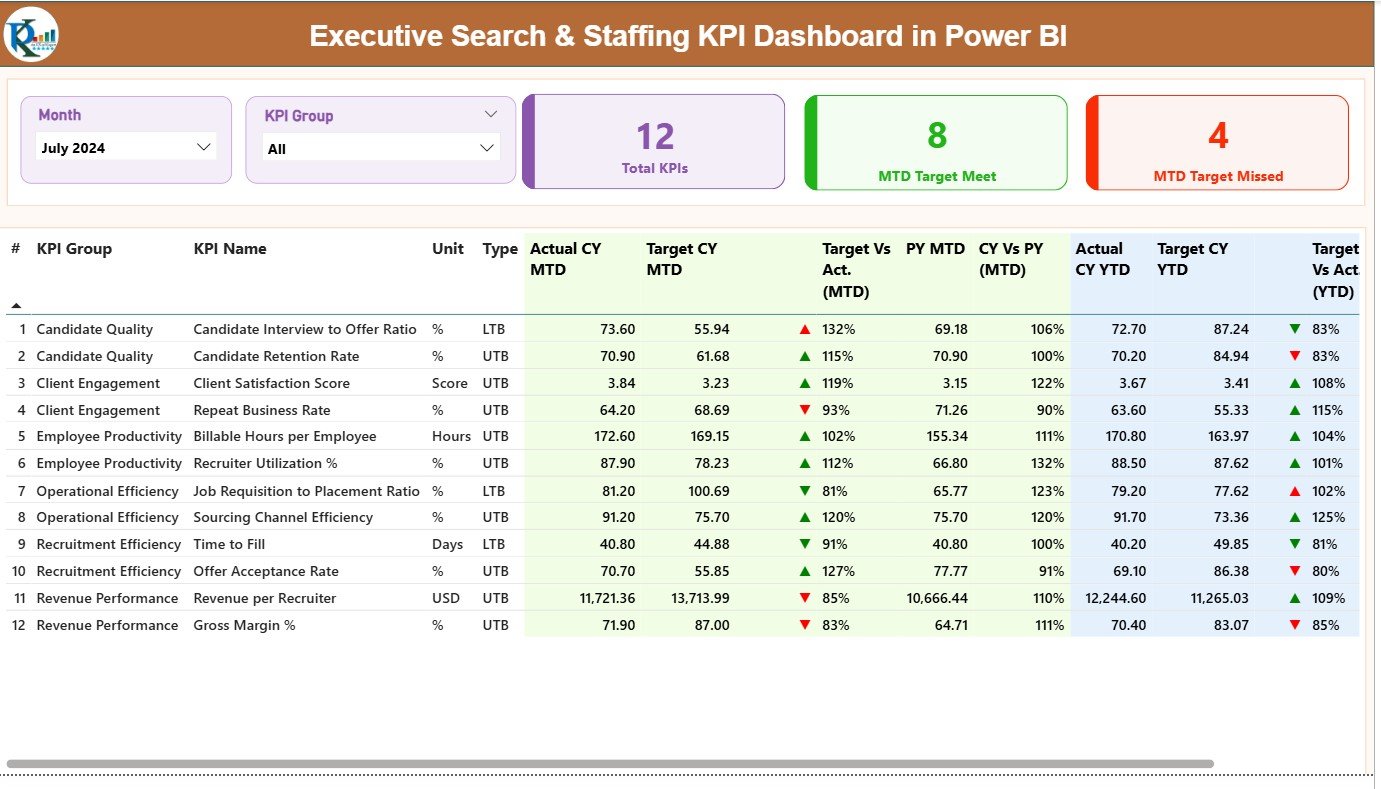
The Summary Page is the main hub of the dashboard — offering a complete overview of performance across all staffing KPIs.
At the top, users can find slicers for Month and KPI Group, allowing easy filtering and analysis by period or category.
Key Elements on the Summary Page:
-
Total KPIs Count – Shows the total number of KPIs tracked.
-
MTD Target Met Count – Displays how many KPIs achieved their Month-to-Date targets.
-
MTD Target Missed Count – Highlights KPIs that fell short of targets.
2️⃣ KPI Trend Page
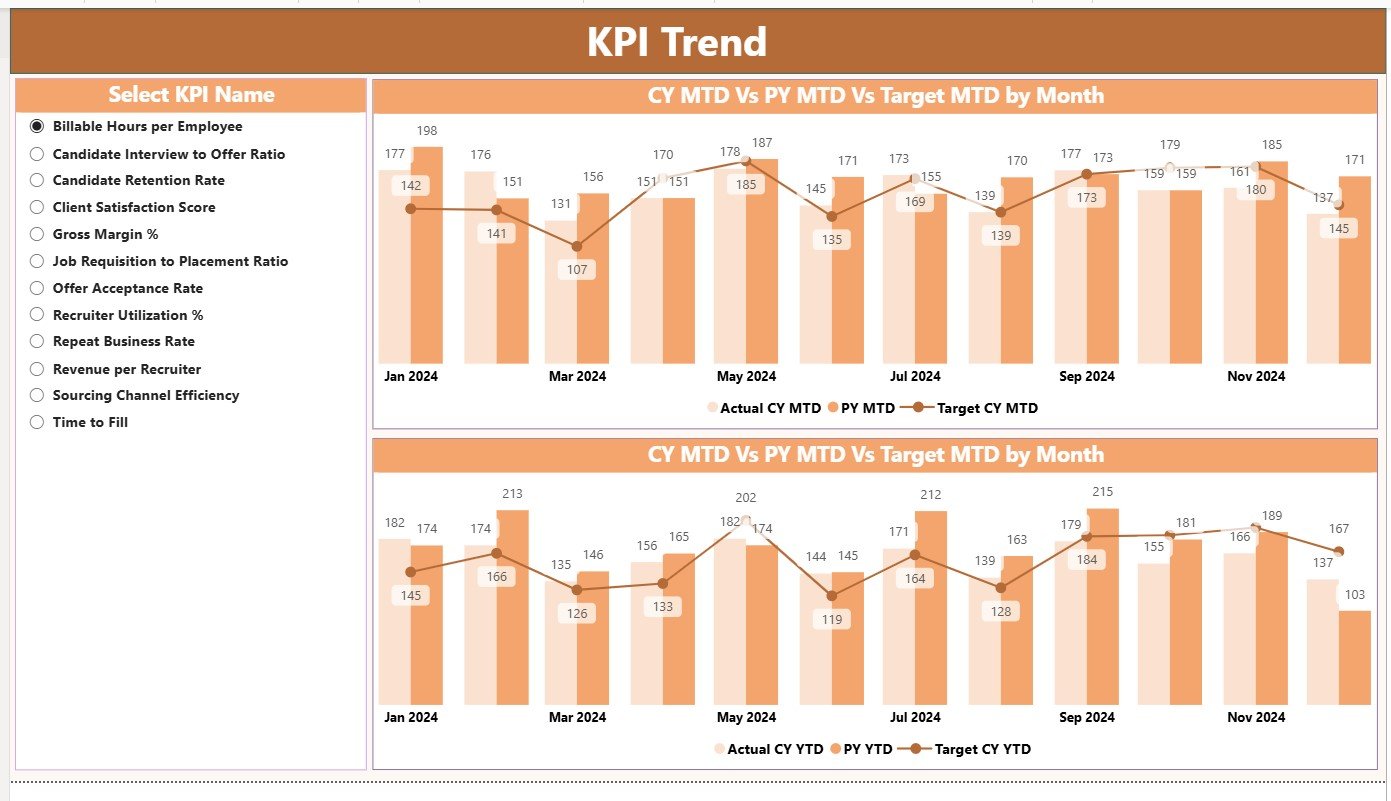
The KPI Trend Page provides a deep dive into performance trends across time. It uses combo charts to visualize Actual, Target, and Previous Year values for both MTD and YTD metrics.
Key Features:
-
Interactive KPI selector slicer on the left side to choose any KPI.
-
Dual combo charts showing trends and comparisons for quick analysis.
-
Ability to switch between MTD and YTD to assess short-term and long-term performance.
With this page, you can easily identify whether KPIs are improving, stagnating, or declining — helping managers take timely corrective actions.
Click to Purchases Executive Search & Staffing KPI Dashboard in Power BI
3️⃣ KPI Definition Page
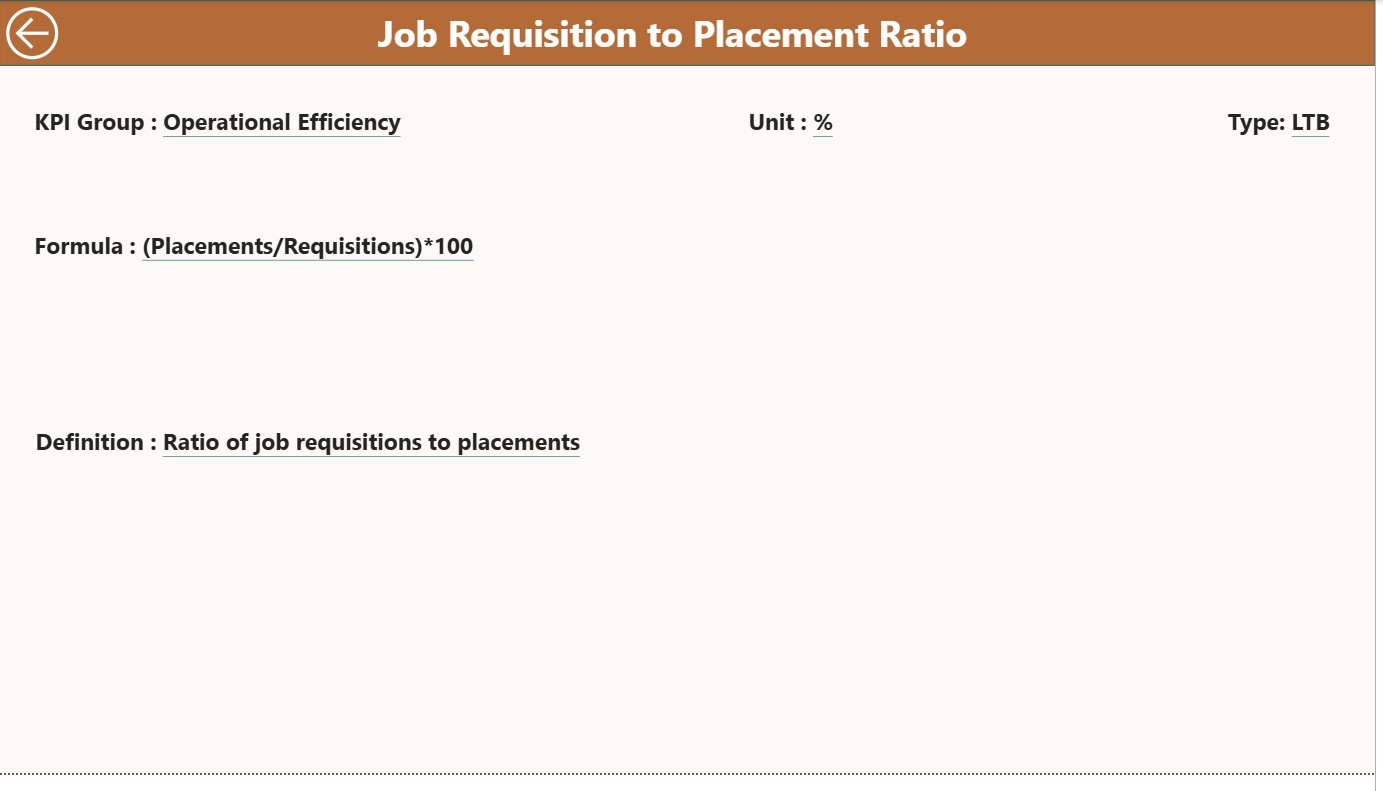
The KPI Definition Page serves as a reference guide for users who want to understand the logic behind each KPI.
This is a hidden drill-through page, accessible directly from the Summary Page. By right-clicking any KPI, users can view its detailed definition, formula, and calculation method.
Data Fields:
-
KPI Number
-
KPI Group
-
KPI Name
-
Unit
-
Formula
-
Definition
-
Type (LTB/UTB)
To navigate back to the main dashboard, simply click the Back button on the top-left corner. This design keeps the main interface clean while still offering detailed insights when needed.
Excel Data Source Structure
The dashboard uses an Excel file as its data source, ensuring easy updates and data management. The Excel file includes three sheets:
1️⃣ Input_Actual Sheet
This sheet contains the actual performance values for each KPI.
Columns include:
-
KPI Name
-
Month (first date of each month)
-
MTD Value
-
YTD Value
2️⃣ Input_Target Sheet
This sheet stores the target values for all KPIs, aligned by month.
Columns are similar to the actual sheet for consistency:
-
KPI Name
-
Month
-
MTD Target
-
YTD Target
3️⃣ KPI Definition Sheet
This sheet lists every KPI with its:
-
KPI Number
-
KPI Group
-
KPI Name
-
Unit
-
Formula
-
Definition
-
Type (LTB or UTB)
With this setup, the dashboard can automatically refresh from Excel, minimizing manual effort.
Why Use a KPI Dashboard for Executive Search & Staffing?
Recruitment is not just about filling roles — it’s about finding the right talent at the right time and cost. The Executive Search & Staffing KPI Dashboard in Power BI transforms recruitment operations by providing data-driven clarity and control.
Here’s why organizations use it:
-
To track recruiter productivity and identify top performers.
-
To monitor hiring timelines and reduce time-to-fill.
-
To measure client satisfaction and candidate experience.
-
To optimize hiring costs and improve return on recruitment investment.
-
To analyze performance trends for continuous improvement.
By visualizing these insights, HR leaders and staffing firms can align hiring outcomes with business goals more effectively.
Key KPIs to Monitor in the Dashboard
Every staffing and executive search firm should monitor a balanced set of KPIs. Here are some of the most essential ones to include in your Power BI dashboard:
Click to Purchases Executive Search & Staffing KPI Dashboard in Power BI
Recruitment Efficiency KPIs
-
Time to Fill (Days) – Measures how long it takes to fill an open position.
-
Time to Hire (Days) – Tracks the time between a candidate’s first contact and acceptance.
-
Offer Acceptance Rate (%) – Percentage of candidates who accept job offers.
-
Interview-to-Hire Ratio – Compares the number of interviews conducted to successful hires.
Candidate Quality KPIs
-
Qualified Candidates per Opening – Indicates the effectiveness of sourcing.
-
Candidate Conversion Rate (%) – Measures how many sourced candidates move through the funnel.
-
First-Year Retention Rate (%) – Shows the quality of hires through retention.
Recruiter Productivity KPIs
-
Number of Positions Filled per Recruiter
-
Submissions per Hire
-
Average Calls or Emails per Day
-
Candidate Pipeline Strength
Client Satisfaction KPIs
-
Client Feedback Score (1–10)
-
Repeat Business Rate (%)
-
Revenue per Client
Financial KPIs
-
Cost per Hire ($)
-
Recruitment ROI (%)
-
Billing Margin (%)
Tracking these KPIs ensures complete visibility across recruitment operations.
Click to Purchases Executive Search & Staffing KPI Dashboard in Power BI
Advantages of the Executive Search & Staffing KPI Dashboard in Power BI
The benefits of using this dashboard go far beyond visualization. Let’s explore its top advantages:
1. Real-Time Insights
The dashboard automatically updates with your Excel data, offering instant visibility into your recruitment performance.
2. Centralized View
Instead of juggling multiple spreadsheets, Power BI unifies all staffing KPIs in one interactive workspace.
3. Better Decision-Making
Managers can easily identify performance gaps, high-performing recruiters, and hiring bottlenecks.
4. Improved Accountability
Since every recruiter’s metrics are visible, performance accountability becomes transparent and fair.
5. Time Efficiency
Automated data updates save hours of manual reporting every month, allowing HR teams to focus on strategic tasks.
6. Enhanced Client Satisfaction
With clear insights into fulfillment rates, response times, and success ratios, client reporting becomes easier and more professional.
Opportunities for Improvement
While the dashboard is robust, you can make it even more powerful by:
-
Integrating with ATS/CRM tools like Bullhorn or Zoho Recruit for live data sync.
-
Adding real-time alerts for critical KPI deviations.
-
Including recruiter leaderboards to foster healthy competition.
-
Implementing Power BI mobile dashboards for access on the go.
-
Expanding KPI coverage to include diversity, equity, and inclusion (DEI) metrics.
These enhancements can elevate your analytics maturity and give you a competitive edge.
Click to Purchases Executive Search & Staffing KPI Dashboard in Power BI
Best Practices for Using the Executive Search & Staffing KPI Dashboard
To get the most from your dashboard, follow these best practices:
-
Define Clear KPI Ownership:
Assign responsibility for each KPI to a specific recruiter or team. -
Regularly Validate Data:
Ensure Excel or data source inputs are consistent and accurate. -
Use Visual Cues Intelligently:
Keep red-green icons and arrows simple for quick interpretation. -
Review MTD and YTD Trends Monthly:
Don’t rely on one metric; analyze both short-term and long-term trends. -
Update KPI Definitions Periodically:
As your business evolves, refresh KPI formulas and targets accordingly. -
Leverage Drill-Through Pages:
Encourage managers to explore detailed KPI definitions for deeper understanding. -
Automate Refresh Schedules:
Set Power BI’s data refresh frequency to daily or weekly, based on your needs. -
Create Dashboards for Different Roles:
Provide recruiter-level, manager-level, and executive-level views.
Following these practices ensures your dashboard remains actionable and business-ready.
How This Dashboard Supports Decision-Making
This dashboard acts as a strategic control center for HR and staffing leadership. It enables:
-
Quick identification of hiring delays.
-
Faster detection of underperforming KPIs.
-
Improved forecasting of hiring needs.
-
Accurate client performance reporting.
-
Data-driven goal setting and incentive planning.
By visualizing key insights, staffing companies can make decisions based on evidence, not assumptions — leading to better hiring quality and improved business outcomes.
Conclusion
The Executive Search & Staffing KPI Dashboard in Power BI is more than a reporting tool — it’s a strategic enabler for smarter hiring and business growth.
By combining structured data, automated visuals, and interactive filters, it empowers organizations to optimize recruiter performance, accelerate hiring cycles, and enhance client satisfaction. Whether you manage a recruitment agency or an in-house talent acquisition team, this dashboard provides the insights you need to scale efficiently.
When data drives every decision, Power BI transforms staffing analytics into a competitive advantage.
Click to Purchases Executive Search & Staffing KPI Dashboard in Power BI
Frequently Asked Questions (FAQs)
1. What is the main purpose of the Executive Search & Staffing KPI Dashboard?
The dashboard helps recruitment teams measure and visualize performance metrics such as time-to-fill, cost-per-hire, offer acceptance rate, and recruiter productivity — all within one Power BI workspace.
2. Can I connect this dashboard to live data sources?
Yes. You can connect it to Excel, SQL Server, or even your Applicant Tracking System (ATS) for automatic updates.
3. How often should I update the data?
It’s best to refresh data weekly or monthly, depending on your recruitment cycle and reporting requirements.
4. Can I customize the KPIs?
Absolutely. You can add, remove, or modify KPIs by updating the KPI Definition sheet in Excel. The Power BI file will automatically adapt once refreshed.
5. Is Power BI suitable for small staffing agencies?
Yes. Even small agencies benefit from Power BI dashboards because they provide professional, data-driven insights without high software costs.
6. Does this dashboard require coding skills?
Not at all. It uses pre-built visuals, Excel inputs, and simple Power BI connections. Anyone with basic Excel knowledge can manage it.
7. Can I share the dashboard with clients or management?
Yes. Power BI allows you to publish dashboards and share them securely with stakeholders for transparent performance reporting.
8. What’s the difference between MTD and YTD analysis in this dashboard?
MTD (Month-to-Date) shows short-term performance trends, while YTD (Year-to-Date) provides a broader view of yearly progress — helping leaders track both immediate and long-term goals.
9. Can I view historical comparisons?
Yes. The dashboard compares current metrics with previous year’s MTD and YTD numbers to highlight growth or decline patterns.
10. How does this dashboard help improve recruiter performance?
By clearly displaying targets and achievements, recruiters can identify their improvement areas and align efforts with business goals, boosting overall efficiency.
Click to Purchases Executive Search & Staffing KPI Dashboard in Power BI
Visit our YouTube channel to learn step-by-step video tutorials