Hotel and Hospitality Revenue Dashboard in Excel is a comprehensive, ready-to-use Excel template built for hotel managers, revenue analysts, and hospitality professionals who need a clear, data-driven view of their property’s financial performance. This dashboard includes 5 interactive pages — Overview, Revenue Breakdown, Guest Analysis, Property Performance, and Booking Trends — along with a structured Data Sheet and a Support Sheet containing pivot tables that power every chart. Whether you manage a single boutique hotel or oversee multiple properties, this dashboard gives you instant visibility into room revenue, F&B performance, guest satisfaction, booking channel effectiveness, and seasonal occupancy patterns.
👉 Click here to Purchase the Hotel and Hospitality Revenue Dashboard in Excel
With built-in Excel slicers for quick filtering and pivot-powered charts that auto-refresh when you update your data, the Hotel and Hospitality Revenue Dashboard in Excel eliminates the need for complex formulas or VBA macros. It is one of the most detailed hotel analytics templates available for Excel 2016 and later versions.
Key Features of Hotel and Hospitality Revenue Dashboard in Excel
- 5 Interactive Dashboard Pages — Overview, Revenue Breakdown, Guest Analysis, Property Performance, and Booking Trends provide a 360-degree view of hotel operations and revenue streams.
- 👉 Click here to Purchase the Hotel and Hospitality Revenue Dashboard in Excel
- KPI Summary Cards — Total Revenue, Total Room Revenue, Total Records, Total Nights, and Avg. Satisfaction are displayed prominently on the Overview page for instant performance checks.
- Dynamic Slicer Filters — Excel slicers let you filter by property, room type, booking channel, season, loyalty tier, and more across all dashboard pages with one click.
- Pivot-Powered Auto-Refresh — Every chart and metric is driven by pivot tables in the hidden Support sheet. Update your data, click Refresh All, and the entire dashboard updates instantly.
- Revenue Segmentation — Analyze revenue by room type, booking channel, guest type, and property to understand exactly where your income originates.
- Guest Satisfaction Tracking — Monitor average satisfaction scores across guest types, properties, booking channels, and loyalty tiers to identify service improvement opportunities.
- Booking Trend Analysis — Track check-outs vs cancellations by month, yearly revenue trends, and booking channel distribution to optimize pricing and marketing strategy.
- No VBA or Macros Required — Runs entirely on Excel formulas, pivot tables, and charts. Compatible with Microsoft Excel 2016 and later.
Dashboard Pages Explanation
1. Overview Page
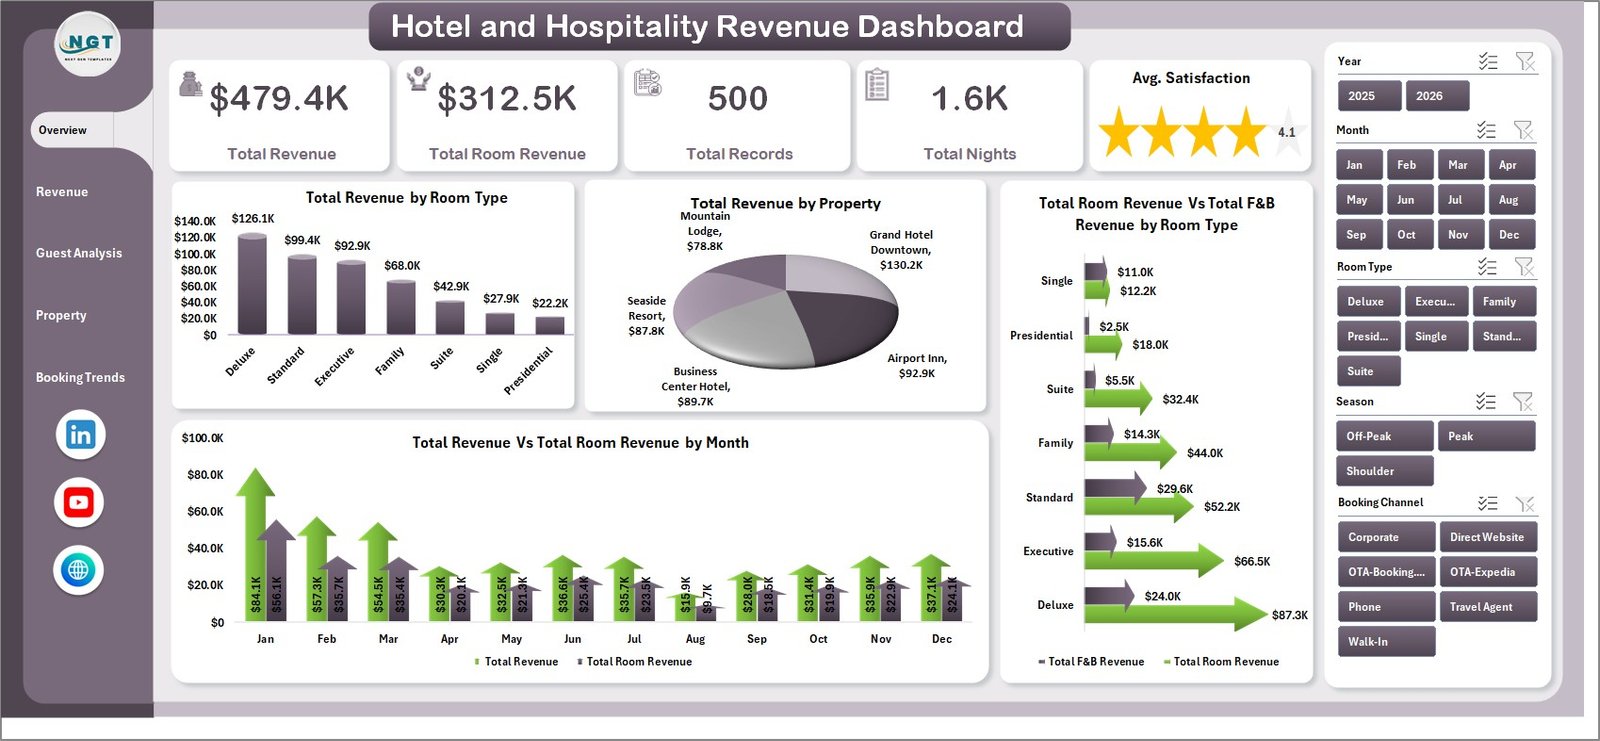
The Overview page serves as the main landing screen of the Hotel and Hospitality Revenue Dashboard. At the top, five KPI summary cards display Total Revenue, Total Room Revenue, Total Records, Total Nights, and Avg. Satisfaction — giving you an immediate snapshot of overall hotel performance. Below the cards, four interactive charts provide deeper analysis: Total Revenue by Room Type shows how different room categories contribute to your top line, Total Revenue by Property compares income across locations, Total Room Revenue Vs Total F&B Revenue by Room Type reveals the balance between accommodation and dining income, and Total Revenue Vs Total Room Revenue by Month highlights monthly trends and seasonality. Multiple slicers on this page allow you to filter the entire dashboard by any dimension instantly.
Hotel and Hospitality Revenue Dashboard in Excel
2. Revenue Breakdown Page
The Revenue Breakdown page dives deeper into how hotel revenue is distributed across different dimensions. Total Revenue by Booking Channel shows which channels — direct, OTA, corporate, or travel agent — generate the most income. Total Nights by Room Type reveals which room categories have the highest occupancy volume. Total Revenue Vs Total Records by Guest Type compares revenue contribution against booking volume for each guest segment. Avg. Rev/Night by Booking Channel calculates the average nightly revenue per channel, helping you identify your most profitable distribution partners.
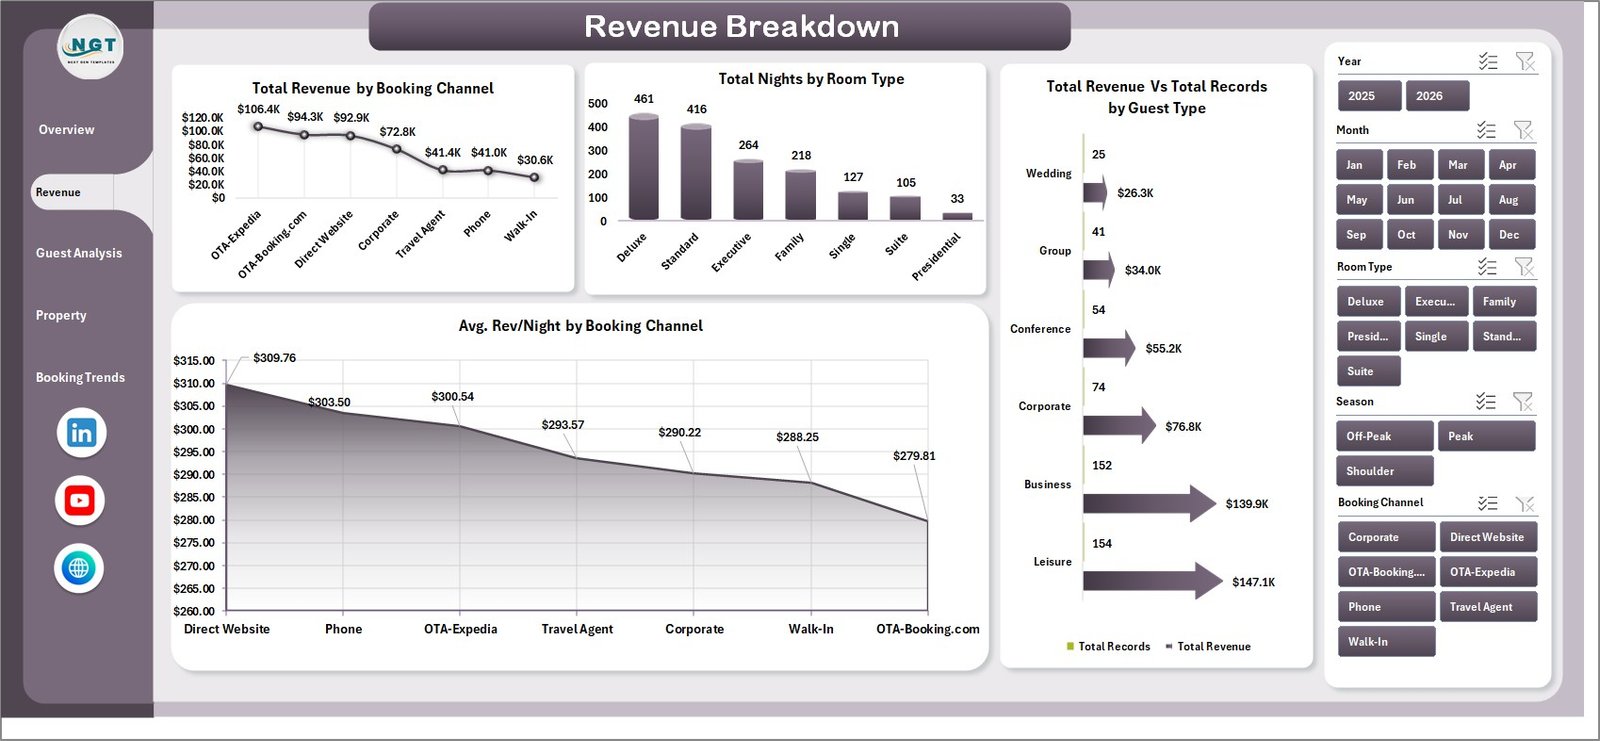
Revenue Breakdown
3. Guest Analysis Page
The Guest Analysis page focuses on understanding your guests and their spending patterns. Total Revenue by Loyalty Tier breaks down income by membership level, showing the financial impact of your loyalty program. Avg. Satisfaction by Guest Type compares satisfaction scores across business travelers, leisure guests, families, and other segments. Total Room Revenue Vs Total F&B Revenue by Property shows the revenue mix at each location. Total Nights by Loyalty Tier reveals which loyalty segments stay the longest, helping you tailor promotions and retention strategies.
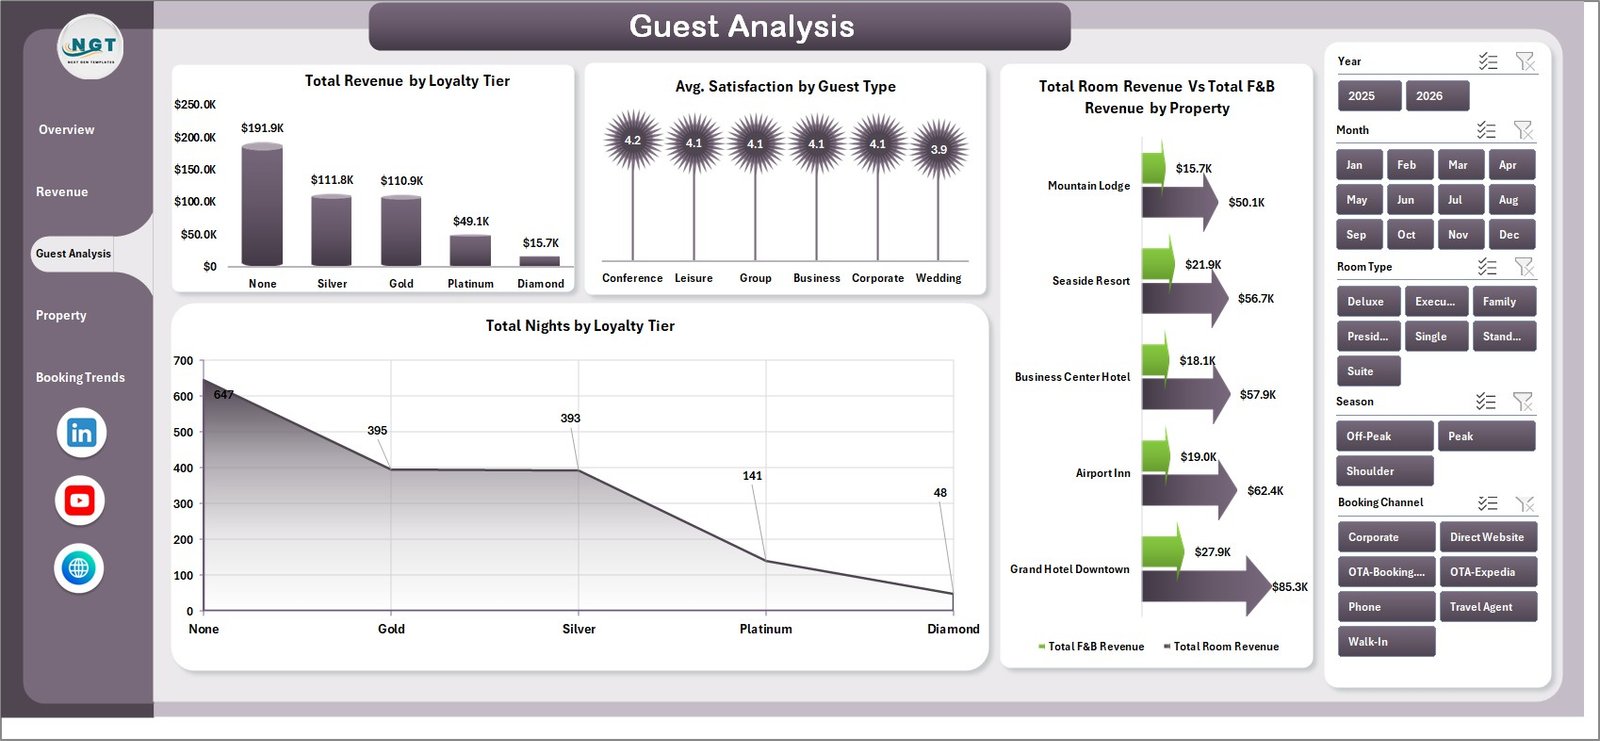
Guest Analysis
4. Property Performance Page
The Property Performance page enables multi-property benchmarking and comparison. Total Records by Property counts the booking volume at each location. Avg. Satisfaction by Property highlights which properties deliver the best guest experience. Total Revenue Vs Total Records by Season reveals seasonal performance patterns, helping you plan pricing and staffing. Occupancy % by Property is one of the most critical hospitality KPIs — this chart shows how effectively each property fills its available rooms.
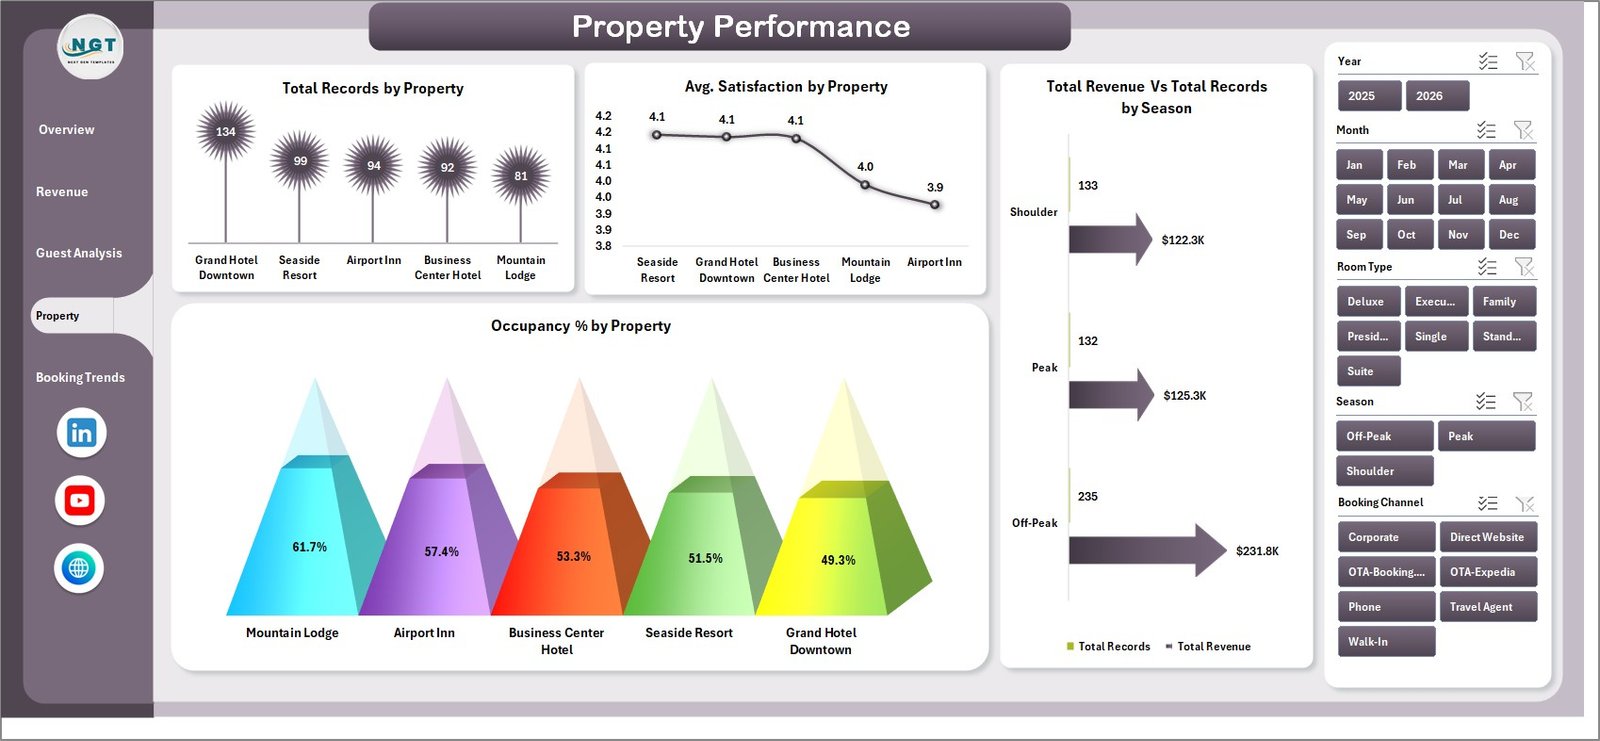
Property Performance
5. Booking Trends Page
The Booking Trends page tracks patterns over time to help with revenue management and forecasting. Total Check-Outs Vs Total Cancellations by Month shows the cancellation rate trend, which directly impacts revenue predictability. Total Revenue by Year provides a year-over-year comparison of overall income. Avg. Satisfaction by Booking Channel reveals whether certain channels attract more satisfied guests. Total Records by Booking Channel tracks booking volume distribution across channels, helping you decide where to invest your marketing budget.
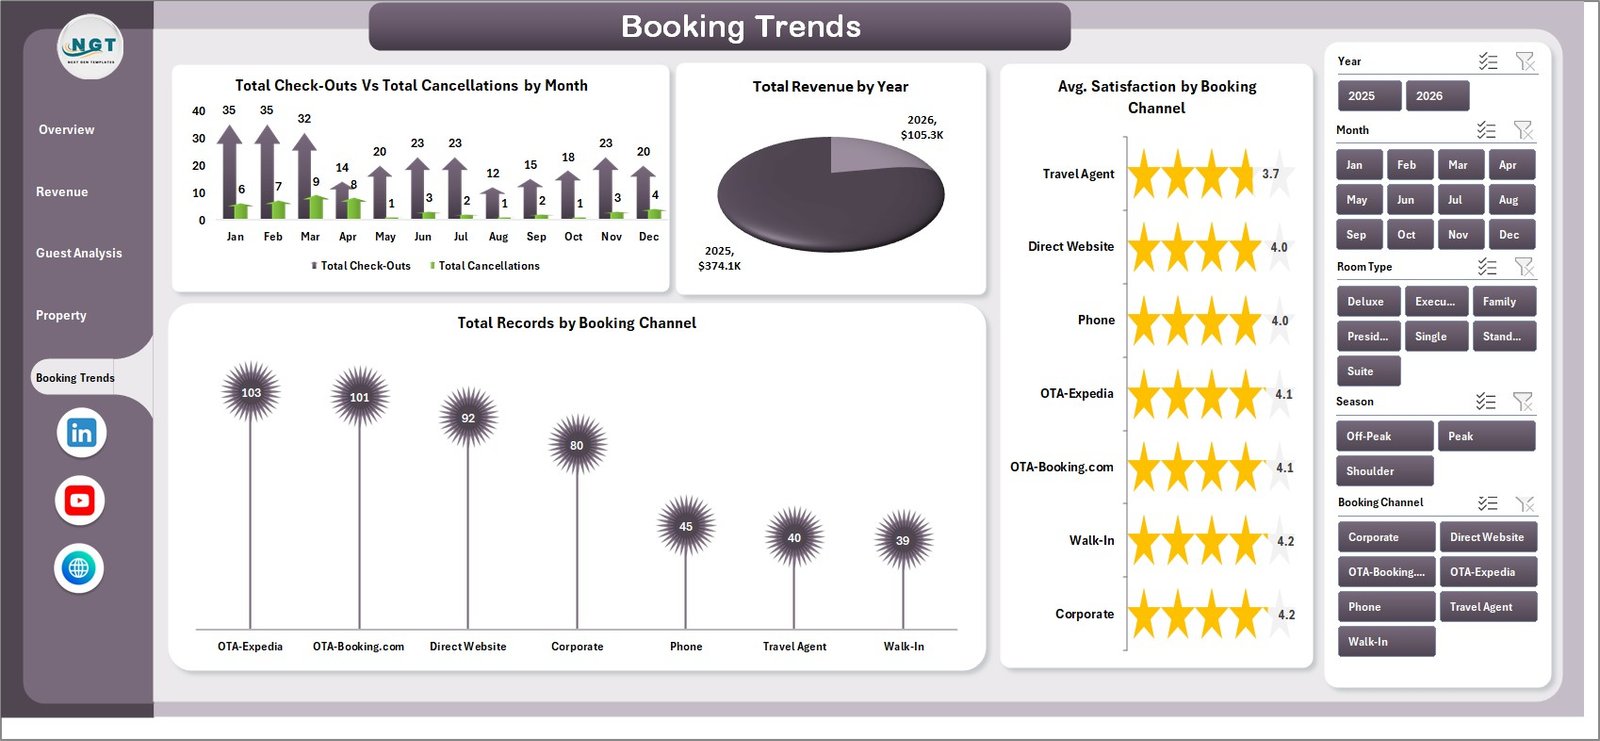
Booking Trends
6. Data Sheet Tab
The Data Sheet is where all raw hotel booking data is stored. Each row represents a single booking record with fields for property, room type, guest type, booking channel, check-in/check-out dates, revenue figures, satisfaction scores, loyalty tier, and more. To use the dashboard with your own data, simply replace the sample entries in this sheet while maintaining the same column structure. After updating, refresh the pivot tables and the entire dashboard will reflect your actual hotel performance.
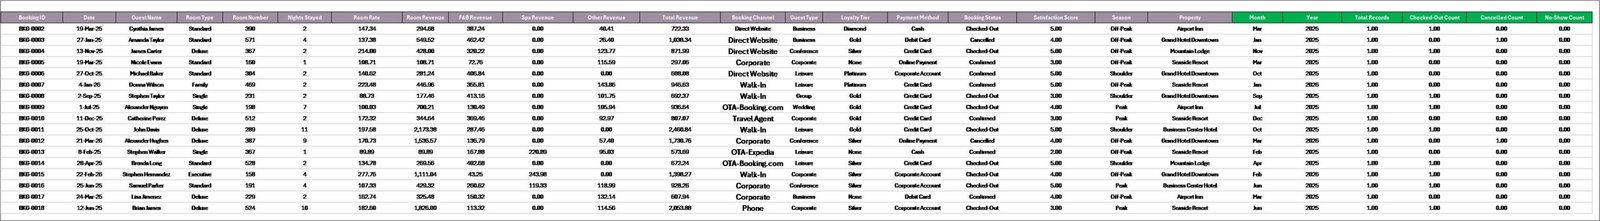
Data Sheet Tab
7. Support Sheet Tab
The Support Sheet contains all the pivot tables that power every chart and KPI card across the dashboard. This is the engine behind the automation — when you update data in the Data Sheet and click Refresh All from Excel’s Data tab, all pivots recalculate and every chart updates automatically. You can keep this sheet hidden during day-to-day use. Advanced users can modify pivot field settings here to customize the analysis further.
👉 Click here to Purchase the Hotel and Hospitality Revenue Dashboard in Excel
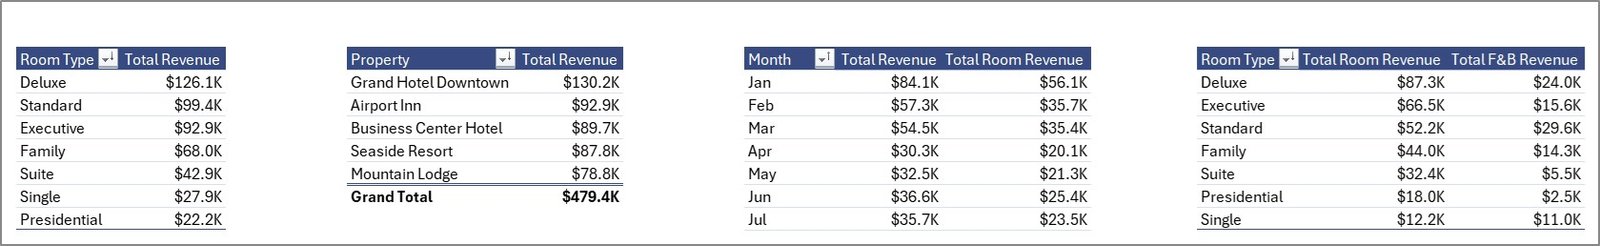
Support Sheet Tab
Advantages of Hotel and Hospitality Revenue Dashboard in Excel
- Instant Financial Visibility — Five KPI cards on the Overview page give you a real-time snapshot of Total Revenue, Room Revenue, Total Records, Total Nights, and Guest Satisfaction without digging through spreadsheets.
- Multi-Property Benchmarking — The Property Performance page lets hotel chains and management companies compare occupancy, satisfaction, and revenue across all locations side by side.
- Channel Optimization — Revenue Breakdown and Booking Trends pages reveal which booking channels deliver the best revenue per night, helping you allocate marketing spend more effectively.
- Guest Loyalty Insights — The Guest Analysis page shows how different loyalty tiers and guest types contribute to revenue and satisfaction, enabling targeted retention strategies.
- Zero Learning Curve — No VBA, no macros, no complex formulas to learn. Replace the sample data, click Refresh All, and your dashboard is ready.
- Fully Customizable — Built on standard Excel pivot tables and charts, so you can add new fields, change chart types, or modify slicers to match your specific reporting needs.
Opportunities for Improvement
👉 Click here to Purchase the Hotel and Hospitality Revenue Dashboard in Excel
- ADR and RevPAR Metrics — While the dashboard tracks total revenue and occupancy, adding Average Daily Rate (ADR) and Revenue Per Available Room (RevPAR) calculations would provide even more granular revenue management insights.
- Date-Based Filtering — Adding a date range slicer would make it easier to analyze specific time periods, such as peak season vs off-season performance.
- Forecast Integration — Incorporating a simple forecast or budget vs actual comparison would help revenue managers track performance against targets.
- Conditional Formatting Alerts — Adding color-coded alerts for KPIs that fall below target thresholds would help managers spot problems faster.
Best Practices for Using This Dashboard
- Update Data Weekly — For the most accurate insights, refresh your booking data at least once a week and click Refresh All to update all pivot tables and charts.
- Use Slicers Strategically — Combine multiple slicers to drill down into specific segments. For example, filter by a single property and a specific booking channel to analyze that combination’s performance.
- Hide the Support Sheet — Right-click the Support sheet tab and select Hide to keep the dashboard clean for daily users. Unhide it only when you need to modify pivot settings.
- Maintain Column Structure — When adding new data to the Data Sheet, always match the existing column headers exactly. Adding or removing columns can break pivot table references.
- Share as Read-Only — When distributing the dashboard to stakeholders, consider protecting sheets or sharing as a PDF to prevent accidental edits to formulas and pivots.
Explore Relevant Templates
If you’re looking for more hospitality and hotel analytics solutions, check out these related templates on NextGenTemplates:
- Boutique Hotels Dashboard in Excel — Tailored analytics for boutique hotel operations with guest experience and revenue tracking.
- Hotel Chains KPI Dashboard in Excel — Scorecard-style KPI tracking for multi-location hotel chains.
- Hospitality & Resorts KPI Dashboard in Excel — Comprehensive KPI dashboard for resorts and full-service hospitality businesses.
- Hospitality & Guest Booking Performance Dashboard in Google Sheets — A Google Sheets alternative for hospitality booking and guest performance analysis.
- Boutique Hotels Dashboard in Power BI — Advanced Power BI analytics for boutique hotel operations.
Browse all Excel Dashboard Templates on NextGenTemplates.
Also read related blog posts on PK — An Excel Expert:
- Boutique Hotels Dashboard in Excel
- Boutique Hotels Dashboard in Power BI
- Vacation Rentals KPI Dashboard in Excel
Frequently Asked Questions
What is the best Excel template for tracking hotel revenue and guest satisfaction?
The Hotel and Hospitality Revenue Dashboard in Excel is one of the best options available. It provides 5 interactive dashboard pages covering revenue breakdown, guest analysis, property performance, and booking trends. The template tracks Total Revenue, Total Room Revenue, Total Records, Total Nights, and Average Satisfaction with pivot-powered charts that auto-refresh with your data.
How do I update the data in the Hotel Revenue Dashboard?
👉 Click here to Purchase the Hotel and Hospitality Revenue Dashboard in Excel
Navigate to the Data Sheet tab and replace the sample booking records with your own hotel data, keeping the same column format. Then go to the Data tab in Excel’s ribbon and click Refresh All. All pivot tables and charts across all 5 dashboard pages will update automatically.
Can I use this Excel dashboard for multiple hotel properties?
Yes. The dashboard includes a dedicated Property Performance page that compares Total Records, Avg. Satisfaction, Total Revenue, and Occupancy Percentage across multiple properties. Include all property data in the Data Sheet and use the property slicer to filter or compare locations.
Does the Hotel and Hospitality Revenue Dashboard require VBA or macros?
No. The template runs entirely on Excel formulas, pivot tables, and standard charts. No VBA macros are used, so you do not need to enable macros when opening the file. It is compatible with Microsoft Excel 2016 and later versions.
What booking metrics does this hotel dashboard analyze?
The dashboard analyzes revenue by room type, property, booking channel, guest type, loyalty tier, and month. It also tracks total nights, occupancy percentage, cancellation trends, average revenue per night by channel, and guest satisfaction scores across multiple dimensions.
Is there a Google Sheets version of this hotel dashboard?
This specific template is designed for Microsoft Excel. However, NextGenTemplates offers the Hospitality & Guest Booking Performance Dashboard in Google Sheets as a cloud-based alternative for hospitality analytics.
Conclusion
The Hotel and Hospitality Revenue Dashboard in Excel is a powerful, no-code analytics solution for hospitality professionals who want data-driven insights without the complexity of BI tools. With 5 interactive pages, dynamic slicers, pivot-powered automation, and comprehensive coverage of revenue, guest satisfaction, property performance, and booking trends, this template delivers everything you need to make smarter hotel management decisions. Download it today and transform your raw booking data into actionable intelligence.
👉 Click here to Purchase the Hotel and Hospitality Revenue Dashboard in Excel
For step-by-step video tutorials and more Excel tips, visit our YouTube channel:
👉 Youtube.com/@PK-AnExcelExpert
Learn more about creating pivot tables in Excel from Microsoft Support.