Hotel and Hospitality Revenue Dashboard in Power BI is a comprehensive, ready-to-use Power BI template designed for hotel managers, revenue analysts, and hospitality professionals who need a complete, data-driven view of their property’s financial and operational performance. This dashboard includes 5 interactive pages — Overview, Revenue Breakdown, Guest Analysis, Property Performance, and Booking Trends — that track every critical metric from room revenue and F&B income to guest satisfaction, occupancy rates, and cancellation patterns. Whether you manage a single boutique hotel or a multi-property chain, this Hotel and Hospitality Revenue Dashboard in Power BI gives you the analytical power to make smarter revenue decisions.
Click here to Purchase Hotel and Hospitality Revenue Dashboard in Power BI
Key Features of Hotel and Hospitality Revenue Dashboard in Power BI
This Power BI dashboard template is built specifically for the hospitality industry and packs a powerful set of features into 5 focused dashboard pages:
- 5 Interactive Dashboard Pages — Each page targets a specific area of hotel revenue management: high-level overview, revenue segmentation, guest behavior, property benchmarking, and booking trend analysis.
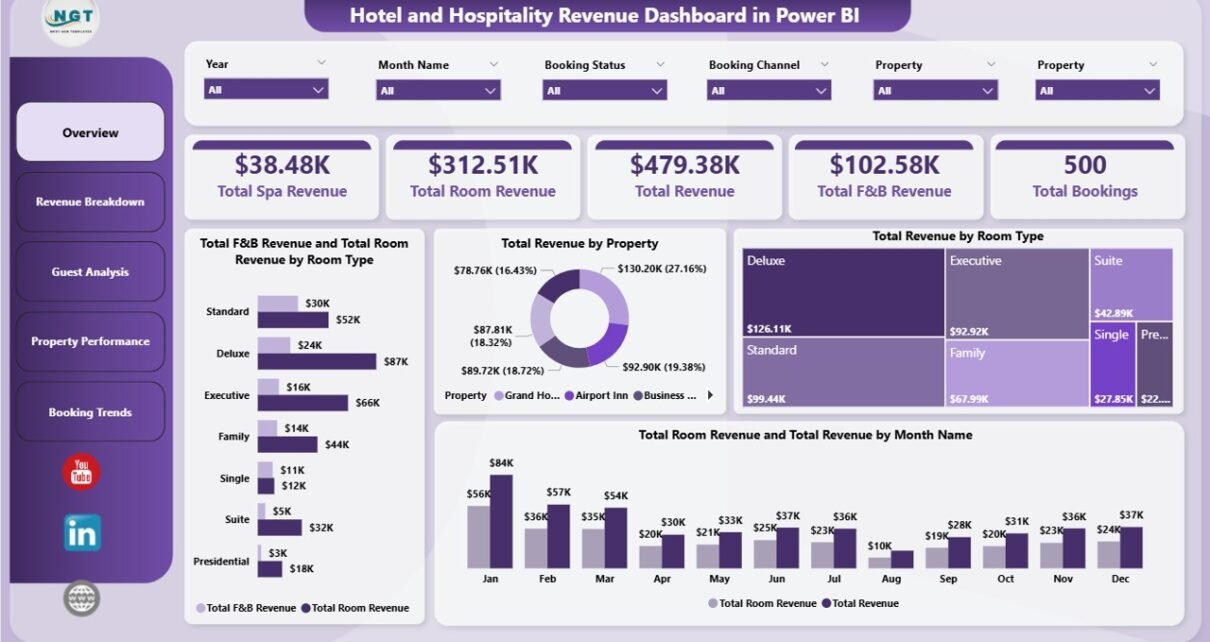
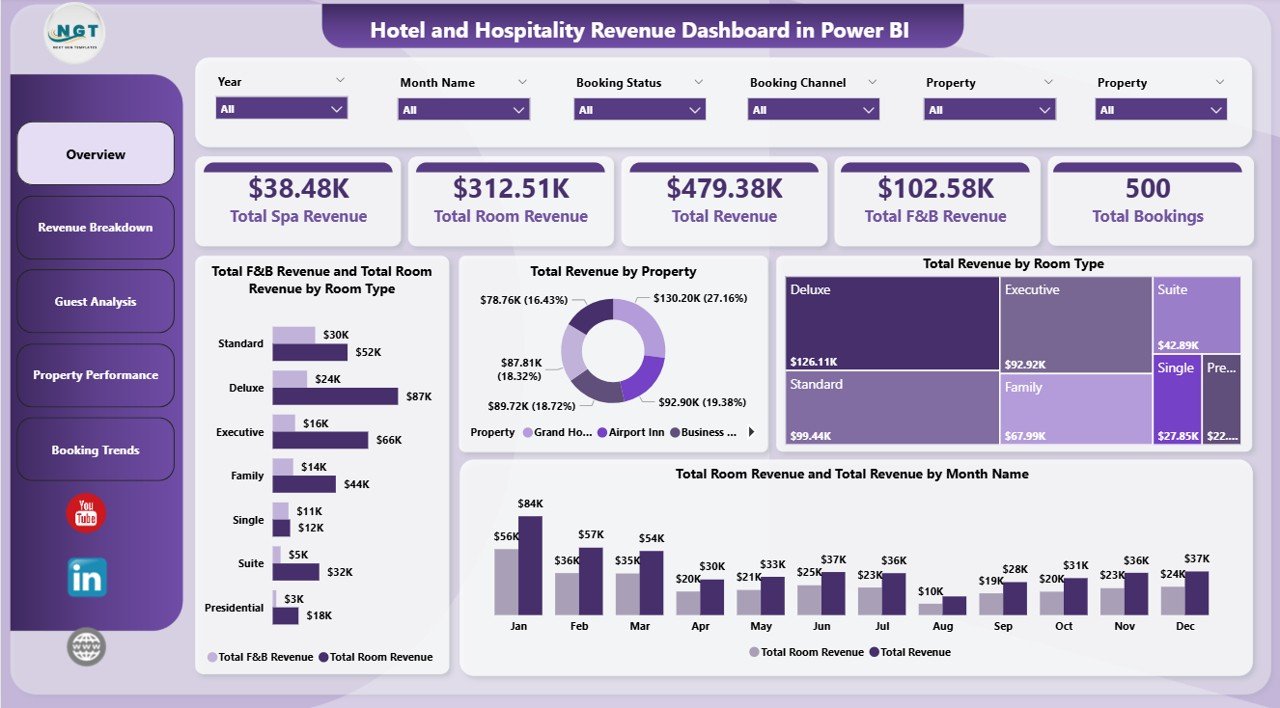
- KPI Summary Cards — The Overview page displays Total Spa Revenue, Total Room Revenue, Total Revenue, Total F&B Revenue, and Total Bookings as prominent KPI cards for instant performance visibility.
- Dynamic Slicers & Filters — Every page includes slicers that let you filter by property, room type, guest type, booking channel, date range, and more — so you can drill into exactly the data segment you need.
- Multi-Property Support — Compare performance across all your hotel locations with property-level breakdowns of revenue, occupancy, bookings, and guest satisfaction.
- DAX-Powered Calculations — All KPIs and measures are built with optimized DAX formulas, ensuring accurate and fast calculations even with large datasets.
- Plug-and-Play Design — Replace the sample data with your own hotel data (Excel, CSV, SQL, or any Power BI connector), refresh, and the entire dashboard updates automatically.
Dashboard Pages Explained
1. Overview Page
The Overview page serves as the command center for your hotel revenue analytics. At the top, you’ll find 5 KPI summary cards displaying Total Spa Revenue, Total Room Revenue, Total Revenue, Total F&B Revenue, and Total Bookings. Below the cards, the page features several powerful charts: Total F&B Revenue and Total Room Revenue by Room Type helps you compare how different room categories contribute to food and accommodation income. Total Revenue by Property gives you a property-wise comparison of overall earnings. Total Revenue by Room Type breaks down which room categories generate the most income. Total Room Revenue and Total Revenue by Month Name shows monthly trends so you can spot seasonal patterns. Multiple slicers on this page let you quickly filter all visuals simultaneously.
Click here to Purchase Hotel and Hospitality Revenue Dashboard in Power BI
Hotel and Hospitality Revenue Dashboard in Power BI
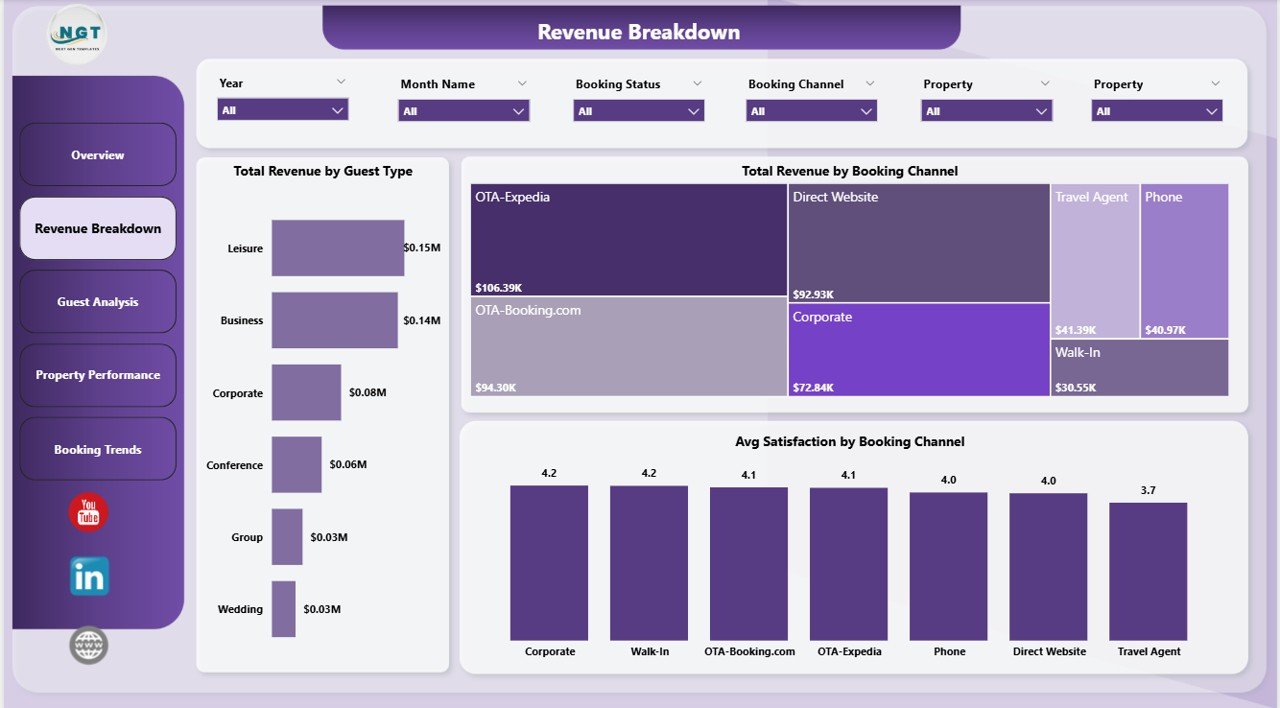
2. Revenue Breakdown
The Revenue Breakdown page dives deeper into where your hotel revenue actually comes from. Total Revenue by Guest Type reveals whether business travelers, leisure guests, or group bookings drive the most income. Total Revenue by Booking Channel shows performance across Direct, OTA, Corporate, Travel Agent, and other acquisition channels. Avg Satisfaction by Booking Channel adds a quality dimension — helping you understand whether high-revenue channels also deliver satisfied guests or if there’s a disconnect worth investigating.
Revenue Breakdown
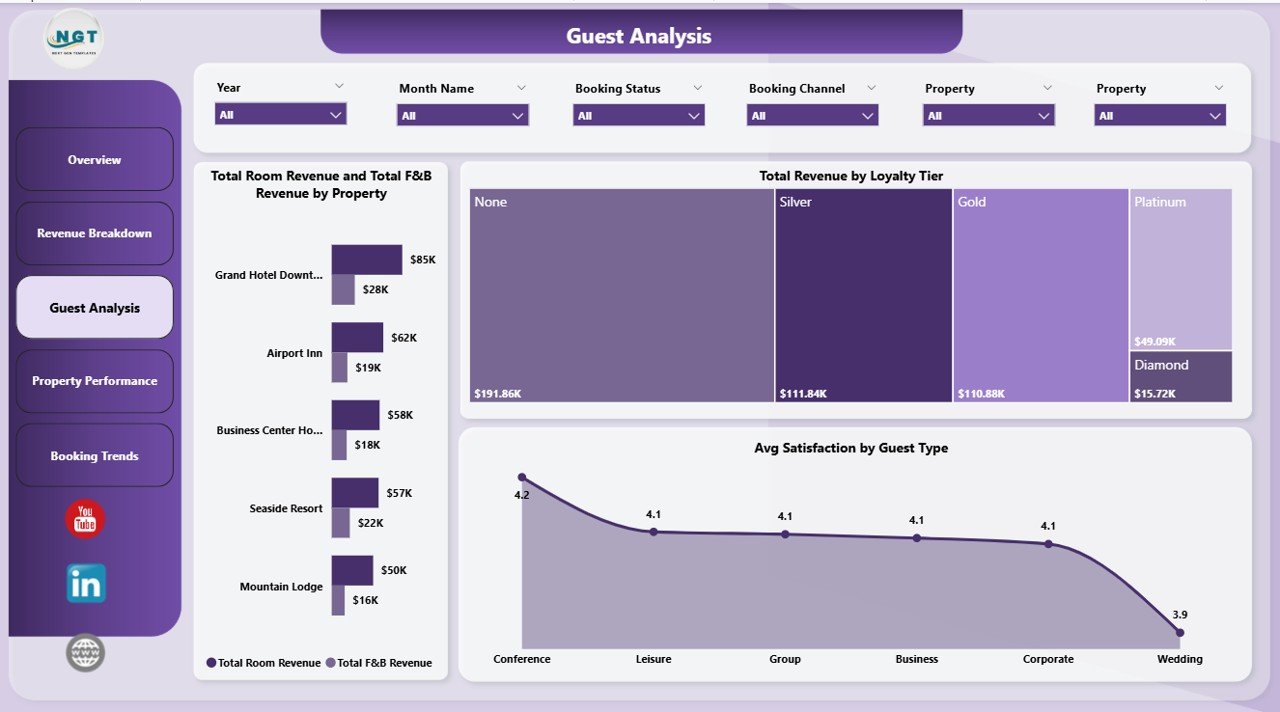
3. Guest Analysis
The Guest Analysis page focuses on understanding your guests’ revenue contribution and satisfaction levels. Total Room Revenue and Total F&B Revenue by Property shows how each location splits its income between rooms and food services. Total Revenue by Loyalty Tier helps you measure the financial impact of your loyalty program — are your top-tier members really generating more revenue? Avg Satisfaction by Guest Type reveals which guest segments are happiest, guiding your marketing and service strategy. This page is essential for any hotel revenue analytics workflow.
Guest Analysis
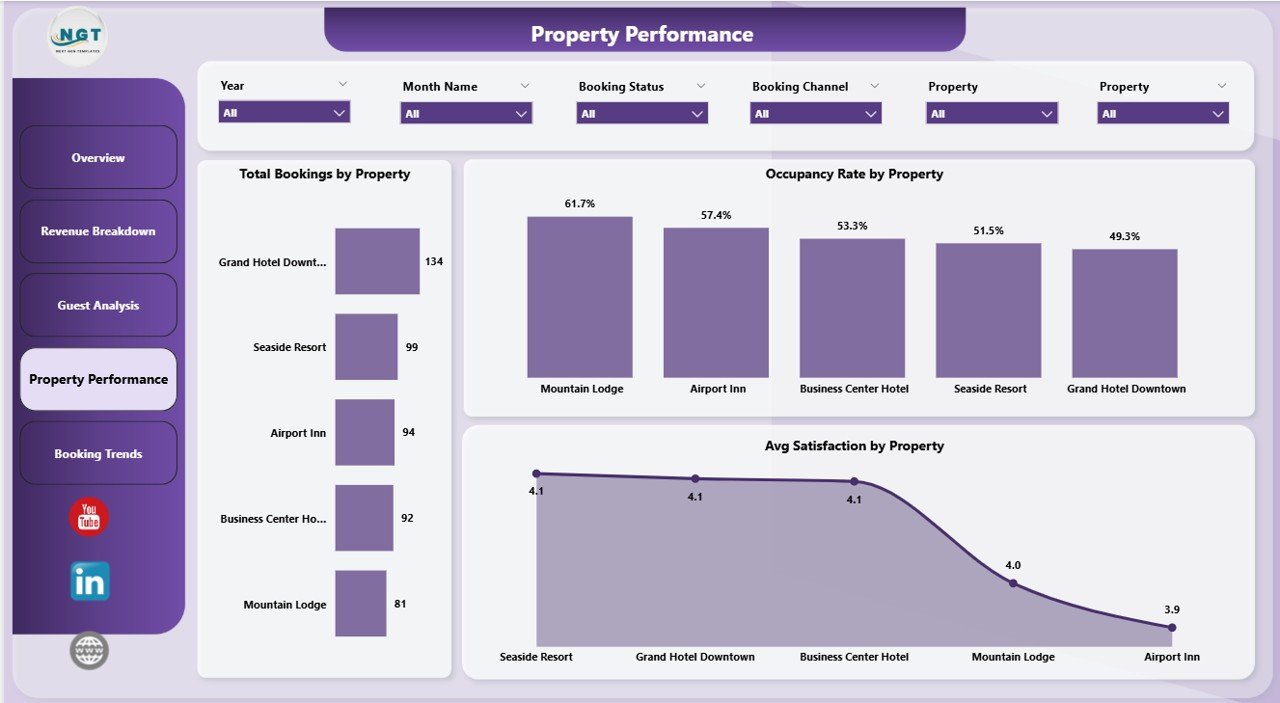
4. Property Performance
The Property Performance page is a must for multi-property hotel operators. Total Bookings by Property gives you a volume comparison across locations. Occupancy Rate by Property is one of the most important hospitality KPIs — it shows how effectively each property fills its rooms. Avg Satisfaction by Property helps identify locations with service quality issues that may be dragging down your brand. Together, these three charts create a comprehensive property benchmarking view, similar to what you’d find in the Boutique Hotels Dashboard in Power BI.
Property Performance
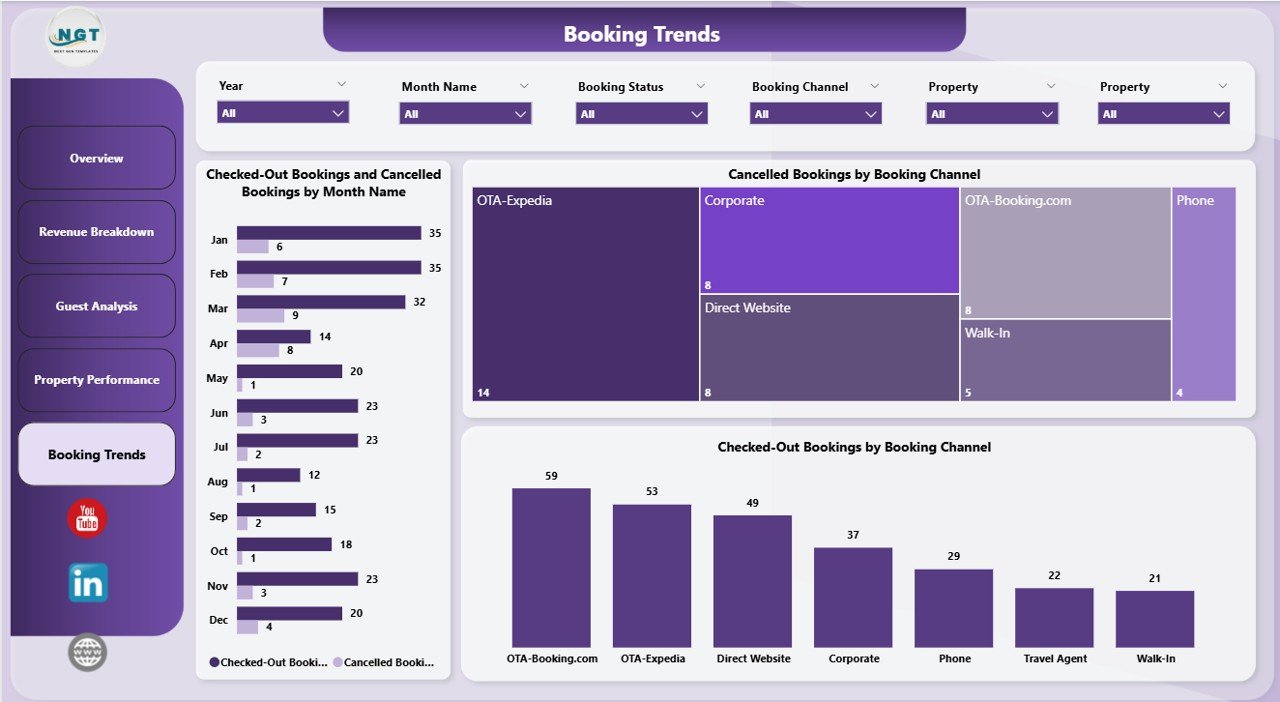
5. Booking Trends
The Booking Trends page helps you spot patterns and reduce lost revenue from cancellations. Checked-Out Bookings and Cancelled Bookings by Month Name shows seasonal trends in both completed stays and cancellations. Cancelled Bookings by Booking Channel pinpoints which acquisition channels have the highest cancellation rates — critical for optimizing your channel mix. Checked-Out Bookings by Booking Channel shows the flip side — which channels deliver the most actual completed stays. This data is invaluable for revenue management and distribution strategy, complementing insights from the Hotel Chains KPI Dashboard in Power BI.
Click here to Purchase Hotel and Hospitality Revenue Dashboard in Power BI
Booking Trends
Advantages of Hotel and Hospitality Revenue Dashboard in Power BI
This template delivers several clear advantages for hotel and hospitality professionals:
- Instant Revenue Visibility — See all revenue streams (room, F&B, spa) in one place instead of juggling multiple reports and spreadsheets.
- Multi-Property Benchmarking — Compare locations side-by-side on bookings, occupancy, revenue, and satisfaction to quickly identify winners and underperformers.
- Channel Optimization — Understand which booking channels drive revenue vs. cancellations, helping you allocate marketing budget more effectively.
- Guest Segmentation — Break down revenue by guest type and loyalty tier to tailor your marketing, pricing, and service strategies.
- Trend Detection — Monthly booking and cancellation trends help you forecast demand and adjust staffing, pricing, and promotions proactively.
- Time Savings — Instead of building a dashboard from scratch, start with a professionally designed template and focus on analysis rather than development.
Opportunities for Improvement
While this dashboard covers the core hospitality revenue metrics comprehensively, here are some areas where you could extend it further:
- RevPAR and ADR Metrics — Adding Revenue Per Available Room (RevPAR) and Average Daily Rate (ADR) calculations would provide industry-standard benchmarking metrics.
- Competitor Benchmarking — Integrating external market data (STR reports, competitive set data) would enable competitive positioning analysis.
- Forecasting Models — Adding Power BI’s built-in forecasting or Python/R scripts could provide predictive revenue projections.
- Cost & Profitability Layer — Incorporating cost data alongside revenue would enable profit margin analysis by property, room type, and channel.
Best Practices for Using This Dashboard
- Refresh Weekly — For most hotels, a weekly data refresh provides the right balance of freshness and stability. Daily refresh is recommended during peak seasons.
- Start with Overview — Use the Overview page for executive-level conversations, then drill into specific pages for operational decisions.
- Monitor Cancellation Trends Monthly — The Booking Trends page is most useful when reviewed monthly to catch emerging patterns before they impact revenue.
- Segment by Channel — Always analyze revenue alongside the booking channel. A high-revenue channel with high cancellations may net less than a lower-volume, stable channel.
- Publish to Power BI Service — Share the dashboard with your team via Power BI Service for real-time access from any device.
- Click here to Purchase Hotel and Hospitality Revenue Dashboard in Power BI
Explore Relevant Templates
If you’re building out your hospitality analytics toolkit, check out these related templates on NextGenTemplates.com:
- Boutique Hotels Dashboard in Power BI — A specialized Power BI template for boutique hotel operations and performance tracking.
- Hotel Chains KPI Dashboard in Power BI — Track KPIs across hotel chain locations with this dedicated Power BI template.
- Hospitality & Resorts KPI Dashboard in Power BI — A comprehensive KPI tracking template for the broader hospitality and resorts industry.
- Hotel and Hospitality Revenue Dashboard in Excel — Prefer Excel? Get the same revenue analytics in a familiar spreadsheet format.
- Click here to Purchase Hotel and Hospitality Revenue Dashboard in Power BI
Frequently Asked Questions
What is the best Power BI template for hotel revenue tracking?
The Hotel and Hospitality Revenue Dashboard in Power BI is one of the best templates for hotel revenue tracking. It includes 5 interactive pages covering room revenue, F&B revenue, spa revenue, guest analysis, property performance, and booking trends — all with dynamic slicers for instant filtering. It’s designed for both single-property and multi-property hotel operations.
How do I track hotel occupancy rate in Power BI?
This template includes an Occupancy Rate by Property chart on the Property Performance page. The occupancy rate is calculated automatically using DAX measures. Simply replace the sample data with your hotel’s actual booking and room inventory data, refresh, and the occupancy rate updates for each property.
Can I connect this Power BI dashboard to my hotel PMS data?
Yes. Power BI supports connections to virtually any data source — including Excel files, SQL databases, cloud services, and many hotel Property Management Systems (PMS) that offer API or database access. Replace the sample data connection with your own source and the dashboard adapts automatically.
What KPIs does this hospitality dashboard track?
The dashboard tracks Total Spa Revenue, Total Room Revenue, Total Revenue, Total F&B Revenue, Total Bookings, Occupancy Rate, and Avg Satisfaction. It also breaks down revenue by Room Type, Property, Guest Type, Booking Channel, Loyalty Tier, and Month — giving you over 15 analytical views across 5 dashboard pages.
Is this template suitable for a hotel chain with multiple locations?
Absolutely. The Property Performance page is specifically designed for multi-property analysis, letting you compare Total Bookings, Occupancy Rate, and Avg Satisfaction across all your hotel locations. Slicers on every page allow filtering by individual property.
Do I need Power BI Pro to use this template?
No. You can use this template with the free Power BI Desktop application. Power BI Pro is only needed if you want to publish and share the dashboard with others through Power BI Service. The template itself works fully in the free desktop version.
Conclusion
The Hotel and Hospitality Revenue Dashboard in Power BI is a powerful, plug-and-play analytics solution for any hotel or hospitality business looking to gain complete visibility into revenue streams, guest behavior, property performance, and booking trends. With 5 interactive pages, dynamic slicers, and DAX-powered KPIs, it transforms raw hotel data into actionable insights — without requiring any advanced Power BI skills. Download the template, connect your data, and start making data-driven revenue decisions today.
Click here to Purchase Hotel and Hospitality Revenue Dashboard in Power BI
Visit our YouTube channel for step-by-step video tutorials: Youtube.com/@PK-AnExcelExpert