Human Resource (HR) management is one of the most critical functions in any organization. Whether you’re managing recruitment, training, attendance, or employee engagement, accurate and timely HR data plays a vital role in decision-making. However, many organizations still rely on fragmented data sources and manual reporting methods that make it difficult to get a complete picture of their workforce.
That’s where an HR Report in Excel comes in. Excel is one of the most powerful tools available for HR professionals to analyze employee data, monitor trends, and present insights through visual dashboards. In this comprehensive guide, we will explore the structure, features, and benefits of an HR Report in Excel, and how you can use it to streamline your HR operations effectively.
Click to Purchases HR Report in Excel
What Is an HR Report in Excel?
An HR Report in Excel is a ready-to-use, structured, and interactive template designed to help HR departments collect, analyze, and visualize employee-related data. It enables organizations to monitor workforce metrics such as headcount, tenure, training hours, leaves, and employee distribution across departments or roles.
Instead of managing multiple spreadsheets or manual reports, this Excel-based HR report consolidates everything into one integrated file. It includes charts, cards, slicers, and summary metrics that help HR managers track trends and make data-driven decisions in real-time.
Structure of the HR Report in Excel
This template is built with a clean structure that makes navigation and reporting easier. The HR Report consists of three main pages and one support sheet that together provide a complete analytical view of HR data.
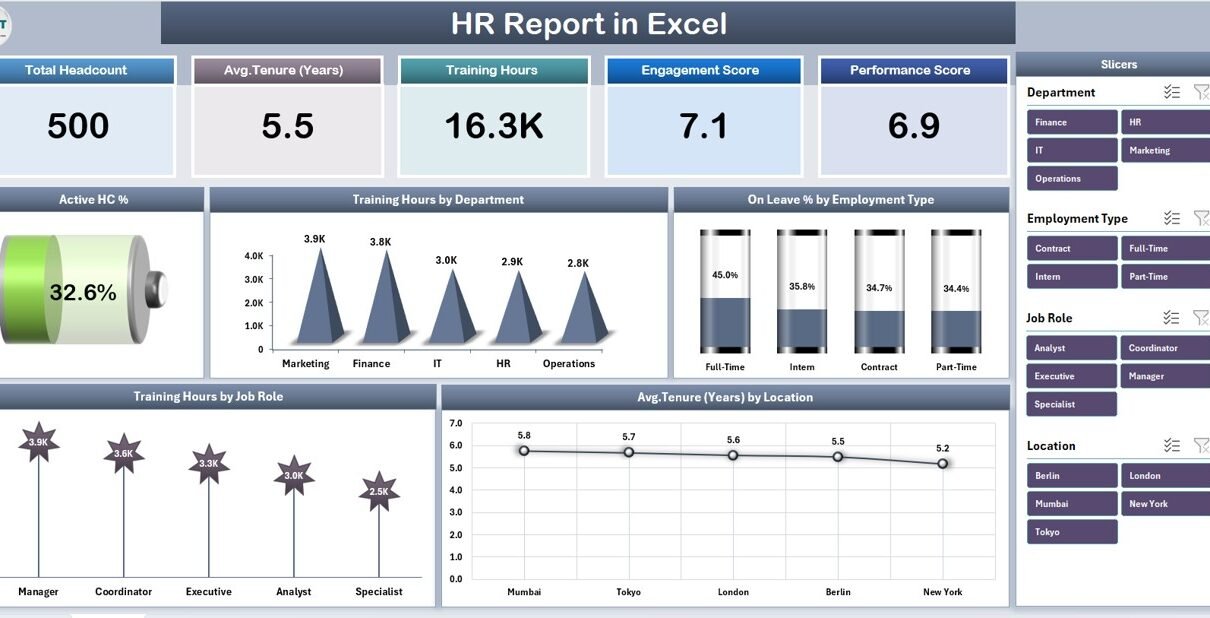
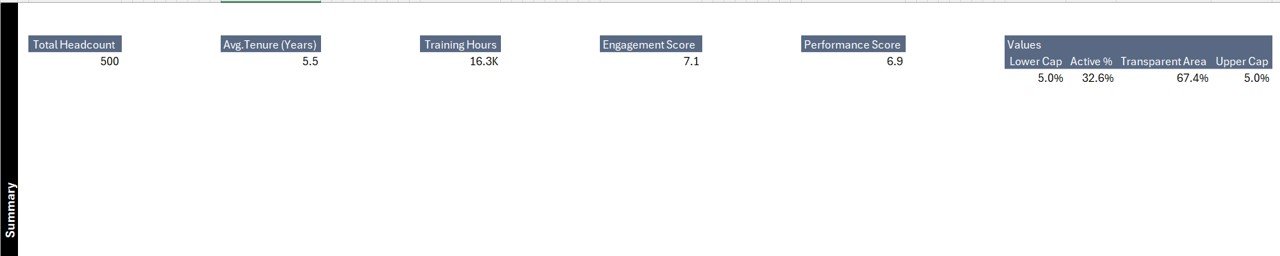
1. Summary Page – The Central HR Dashboard
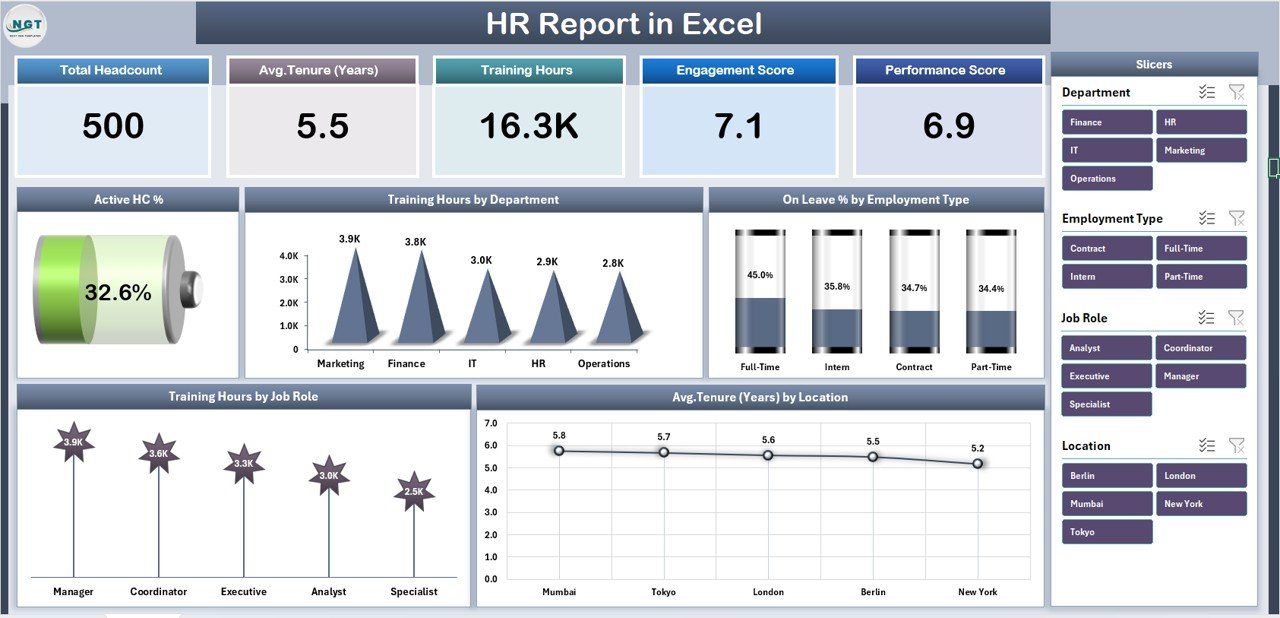
The Summary Page serves as the main visual dashboard where users can quickly review key HR performance indicators (KPIs). It combines charts, summary cards, and slicers to create a snapshot of the organization’s human resource health.
Key Features of the Summary Page:
Five Performance Cards at the Top
These cards display the most important HR metrics such as:
- Active Headcount Percentage (Active HC %)
- Total Employees
- Average Tenure (Years)
- Training Hours
- On-Leave Percentage
-
Right-Side Slicers for Interactivity
Slicers allow users to filter data by Department, Location, or Employee Type. With a single click, users can adjust the entire report view dynamically.
Interactive Charts for Quick Analysis:
The Summary Page includes five essential charts:
- Active HC % Chart – Shows active employee distribution.
- Training Hours by Department – Helps HR understand training resource allocation across departments.
- On Leave % by Employee Type – Highlights absence trends among permanent, contract, or part-time employees.
- Training Hours by Job Role – Tracks training participation for different job roles.
- Average Tenure (Years) by Location – Provides insight into employee retention rates across locations.
This page serves as the executive summary of your HR data. Decision-makers can monitor key performance indicators instantly without digging into detailed tables.
2. Report Page – Detailed HR Data Insights
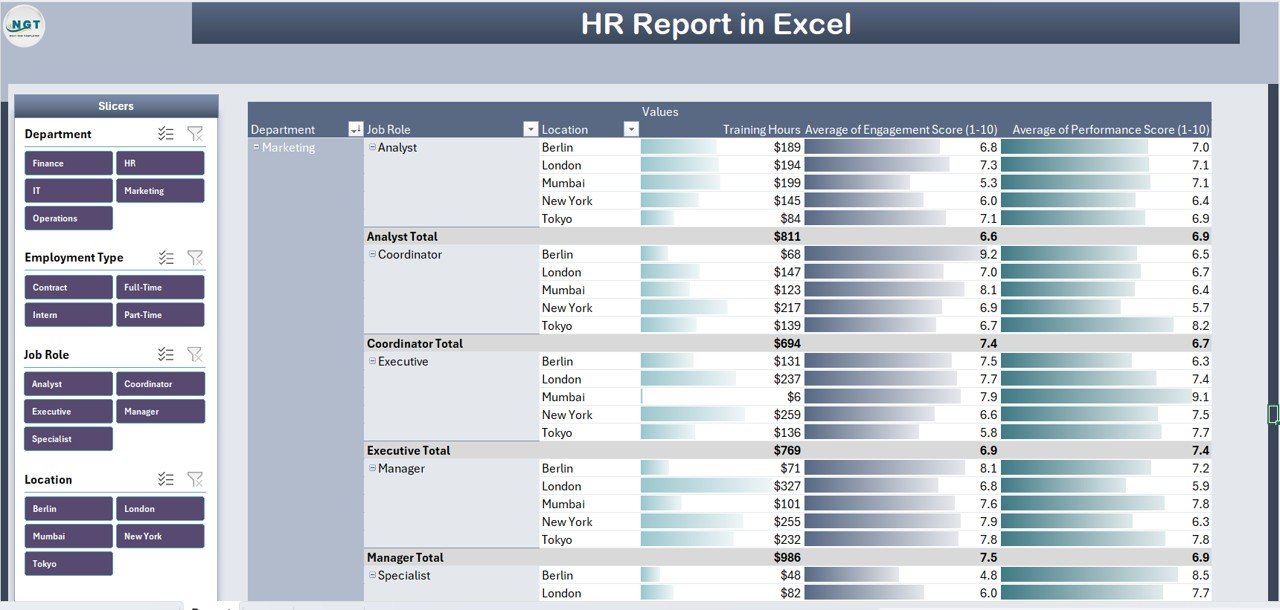
The Report Page complements the Summary Dashboard by providing a detailed view of all HR metrics in tabular format. It helps HR analysts review individual employee data and run specific queries.
Key Features of the Report Page:
-
Left-Side Slicers:
These slicers allow filtering by Department, Designation, or Employee Type. This makes it easy to analyze specific groups such as “Sales Executives in Mumbai” or “IT Staff with 3+ years of tenure.”
Information Table:
The core of the Report Page is an organized data table that displays all HR details in a clean format. Typical columns include:
Click to Purchases HR Report in Excel
- Employee ID
- Employee Name
- Department
- Job Role
- Employment Type
- Join Date
- Tenure
- Training Hours
- Leave Days
- Location
The table dynamically updates based on slicer selections, enabling focused analysis.
3. Data Sheet – The Core Database
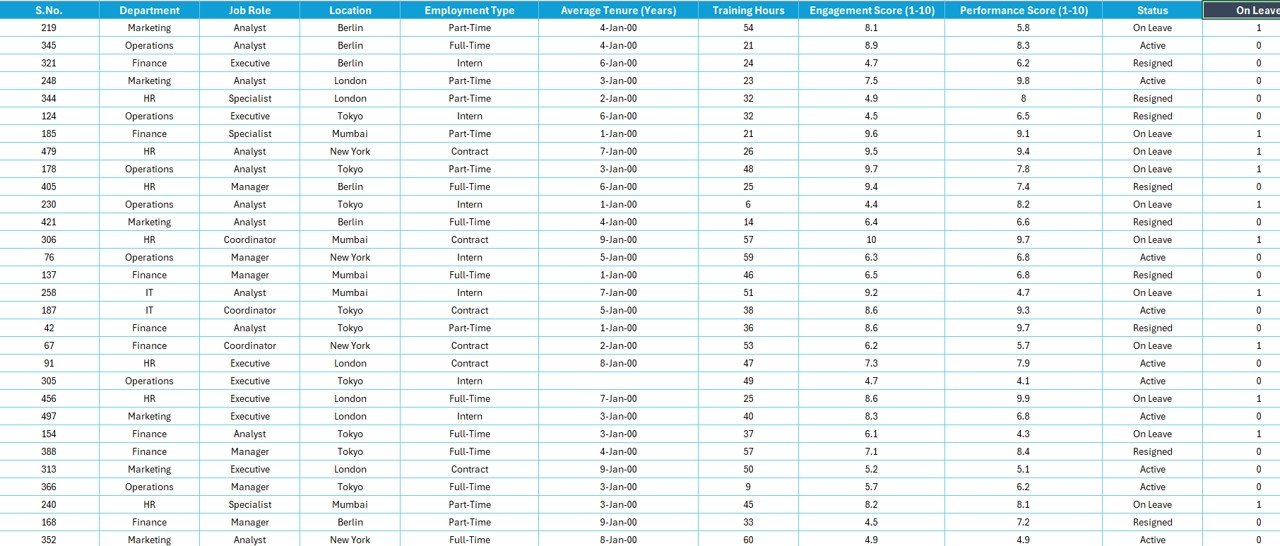
The Data Sheet acts as the backbone of the HR Report. It stores all employee-related raw data that feeds into charts and tables.
Structure of the Data Sheet:
Columns in the data sheet include:
-
Employee ID
-
Name
-
Gender
-
Age
-
Department
-
Designation
-
Location
-
Employment Type
-
Joining Date
-
Training Hours
-
Leave Days
-
Tenure (Years)
-
Status (Active/On Leave/Resigned)
Every chart or KPI in the report derives its data from this sheet. You can easily update it monthly or quarterly to keep reports up to date. Excel formulas like AVERAGEIF, COUNTIF, and SUMIFS help calculate insights automatically.
4. Support Sheet – Behind-the-Scenes Logic
The Support Sheet is used for backend calculations, data validation lists, and dropdowns. It ensures smooth functioning of slicers, pivot tables, and conditional formatting across the file.
For instance:
-
Dropdown options for Departments and Job Roles are stored here.
-
Lookup tables for Employee Type Codes or Location Regions are maintained.
-
Helper tables for KPI formulas are placed here for reference.
This structure separates the operational logic from the visual dashboard, keeping the main pages clean and user-friendly.
Why Should You Use an HR Report in Excel?
Building an HR Report in Excel provides several operational and strategic benefits. Let’s explore why it’s a must-have for every HR department.
1. Centralized Data Management
Instead of maintaining multiple spreadsheets for attendance, training, and leave, the HR Report combines all this information into one central system. This reduces errors and duplication while improving accessibility.
2. Real-Time Visibility
The dashboard provides instant visual insights into workforce distribution, active headcount, and training efforts. HR managers can view trends and take immediate action when something looks off.
3. Improved Decision-Making
With charts like “Training Hours by Department” or “On Leave % by Employee Type,” HR leaders can identify bottlenecks and make informed decisions. For instance, if one department shows low training hours, HR can schedule additional training sessions.
4. Easy Customization and Scalability
Excel offers full flexibility. You can easily add new KPIs such as attrition rate, recruitment cost, or diversity ratio without rebuilding the entire file. This adaptability makes it suitable for organizations of all sizes.
5. Data Accuracy and Transparency
Since the report uses formula-driven calculations and structured tables, there’s little chance of manual mistakes. Managers can trace each metric back to its source data.
Advantages of HR Report in Excel
An HR Report in Excel goes beyond traditional reporting. It offers practical advantages that improve productivity and HR efficiency.
-
✅ Quick Setup: Ready-to-use templates reduce setup time.
-
📊 Interactive Analytics: Slicers and charts provide a 360° view of HR data.
-
🧩 Comprehensive Coverage: Monitors multiple HR aspects—attendance, training, and retention.
-
🔄 Automatic Updates: Change the data once; dashboards update automatically.
-
💼 Professional Presentation: Ideal for HR meetings, audits, and performance reviews.
-
📈 Cost-Effective: Excel eliminates the need for expensive HR analytics software.
-
🔍 Trend Identification: Easily spot trends in employee engagement or absenteeism.
Opportunities for Improvement in HR Reporting
Click to Purchases HR Report in Excel
Even the best HR reports can evolve. Here are some areas to improve continuously:
-
Automate Data Imports: Use Power Query or macros to pull data directly from HR systems.
-
Add Predictive Insights: Incorporate trend lines or forecasting models to predict future turnover or training needs.
-
Integrate Power BI: For more advanced visualizations, link the Excel data to Power BI dashboards.
-
Include Employee Engagement Metrics: Go beyond attendance and training to analyze satisfaction scores.
-
Enhance Mobile Accessibility: Create a web-friendly version or Google Sheets link for remote access.
Best Practices for the HR Report in Excel
Creating an effective HR Report requires both design and analytical thinking. Follow these best practices for professional-quality reports:
1. Keep Data Clean and Consistent
Ensure data validation in every input field. Maintain consistent formats for dates, employee IDs, and job roles. Clean data ensures accurate calculations.
2. Use Pivot Tables and Charts
Pivot tables are the foundation of your analysis. Use them to summarize data dynamically, and link charts for visualization.
3. Apply Conditional Formatting
Highlight underperforming metrics like low training hours or high leave rates using red, amber, or green indicators.
4. Add Slicers for Easy Filtering
Use slicers for Department, Location, or Employee Type. They make navigation intuitive and reports interactive.
5. Protect Formula Areas
Lock formula cells to prevent accidental edits. Keep raw data and dashboards in separate sheets.
6. Schedule Regular Updates
Update the data sheet monthly to keep the dashboard relevant. Outdated data can mislead decision-makers.
7. Include Summary KPIs
Display key figures like Active Headcount %, Avg. Tenure, and Training Hours prominently on the top.
How to Create Your Own HR Report in Excel
If you want to design your own report, follow these steps:
-
Collect Data: Gather employee details, attendance, and training logs.
-
Design Data Sheet: Structure it with all relevant columns.
-
Create Pivot Tables: Summarize data by department, job role, and employee type.
-
Insert Charts: Add bar, line, and donut charts to visualize trends.
-
Build Summary Page: Display KPIs and use slicers for interactivity.
-
Test and Review: Verify formulas and data filters before using the report in meetings.
Conclusion
An HR Report in Excel is a powerful, cost-effective, and flexible solution for managing human resource data. It helps organizations track employee performance, training efficiency, and workforce distribution while promoting transparency and accountability.
Whether you are a small business or a large enterprise, this Excel-based HR report simplifies data analysis and enhances decision-making. With its interactive charts, KPI summaries, and easy customization options, it’s the perfect reporting tool for any HR team.
Frequently Asked Questions (FAQs)
1. What is an HR Report in Excel used for?
An HR Report in Excel helps organizations monitor and analyze workforce metrics such as headcount, tenure, training, and leave data. It consolidates information into one file for easy access and reporting.
2. How can I customize the HR Report?
You can add or modify KPIs, change chart types, or update slicers based on your organizational needs. Excel’s flexibility allows complete customization.
3. Can I automate the data updates?
Yes, you can use Power Query or VBA macros to automate importing and refreshing HR data from other systems.
4. Is the HR Report suitable for small businesses?
Absolutely. Even small HR teams can benefit from this report as it requires no expensive software and runs entirely in Excel.
5. How often should I update the report?
Ideally, update it monthly or quarterly. Regular updates keep your insights accurate and relevant.
6. Can I use the same HR Report template for multiple locations?
Yes. By using slicers and filters, you can analyze data for specific locations or departments within the same file.
Visit our YouTube channel to learn step-by-step video tutorials


