Keeping track of performance is essential for success, especially in Human Resources product development. But how can HR teams efficiently monitor metrics without spending hours on manual tracking? The answer lies in a well-structured Human Resources Product Development KPI Dashboard in Excel.
This article explores everything you need to know about building and using this Excel dashboard. We will break down its features, explain its advantages, and provide best practices to get the most out of your HR KPI tracking system.
Click to Purchases Human Resources Product Development KPI Dashboard in Excel
What is a Human Resources Product Development KPI Dashboard?
A KPI (Key Performance Indicator) Dashboard is a visual representation of important metrics that help teams monitor progress and make data-driven decisions. Specifically, an HR Product Development KPI Dashboard focuses on tracking the efficiency and performance of HR teams involved in creating and improving internal or external HR products like onboarding programs, training tools, and policy frameworks.
Excel is one of the most accessible tools for creating KPI dashboards. It offers automation, flexibility, and compatibility with other HR systems, making it a perfect choice.
Key Features of the Human Resources Product Development KPI Dashboard in Excel
This Excel-based dashboard includes seven powerful worksheets, each designed to streamline your tracking process and bring clarity to performance trends:
1. Home Sheet

This is your command center. The Home sheet provides quick navigation with six intuitive buttons that jump directly to relevant worksheets.
2. Dashboard Sheet Tab

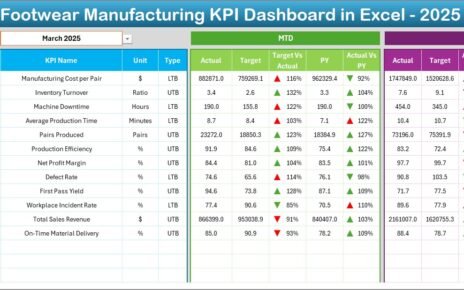
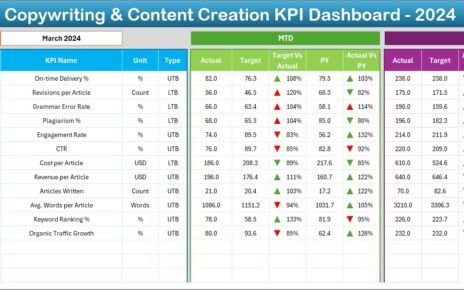
The Dashboard tab is the visual highlight. It displays:
- Monthly (MTD) and Year-to-Date (YTD) data for Actuals, Targets, and Previous Year values.
- Comparison with conditional formatting, using up/down arrows for instant performance insights.
- Dynamic updates based on the month selected in cell D3.
3. KPI Trend Sheet Tab

This sheet provides:
- Drop-down selection for KPIs (cell C3).
- Details like KPI Group, Unit, Formula, and Type (Upper the Better or Lower the Better).
- Trend charts for both MTD and YTD—visually comparing Actuals, Targets, and Previous Year values.
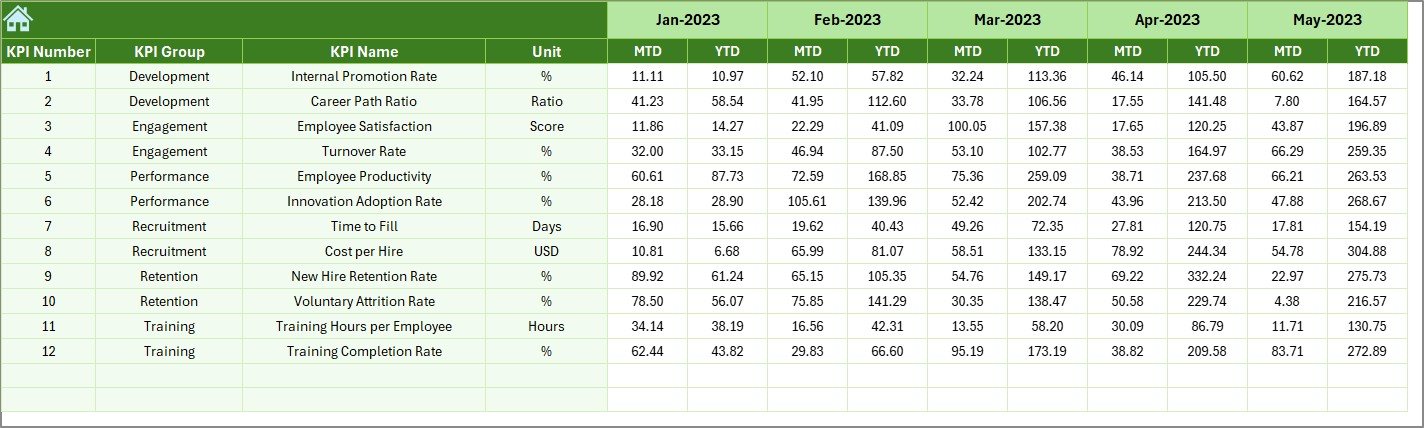
4. Actual Numbers Input Sheet

- Enter monthly MTD and YTD values manually.
- Set the first month of the year using cell E1 for automated column generation.
Click to Purchases Human Resources Product Development KPI Dashboard in Excel
5. Target Sheet Tab

- Input MTD and YTD Target values for each KPI.
- Aligns with the month structure for easy comparisons.
6. Previous Year Number Sheet Tab
- Enter data for the same KPIs for the previous year.
- Helps to track growth or identify performance dips.
7. KPI Definition Sheet Tab

This sheet includes:
- KPI Name
- KPI Group
- Unit of measurement
- Formula used
- Short definition
Why Use This Dashboard?
Tracking HR product development KPIs can be tricky. With multiple teams and moving parts, you need a dashboard that does more than show numbers. Here’s why this dashboard stands out:
- Automates data updates.
- Provides monthly and yearly tracking.
- Compares actual vs. target vs. previous year in one view.
- Offers visual alerts for quick decision-making.
Advantages of Using an HR Product Development KPI Dashboard
✅ Real-Time Monitoring
You don’t have to wait for end-of-month reports. Track your KPIs as they happen.
✅ Data-Driven Decisions
Visual indicators help you focus on what matters most. You can act fast if a KPI dips below the target.
✅ Improves Team Accountability
Assign KPIs to departments or individuals and review progress transparently.
✅ Saves Time and Effort
Automated formulas and dropdowns mean less manual work and fewer errors.
✅ Enhances Strategic Planning
YTD and PY comparisons help identify long-term patterns and drive strategy changes.
Most Common KPIs to Track in HR Product Development
Here are some examples you can include:
- Time-to-Launch New HR Product (Lower is Better)
- Employee Adoption Rate (Upper is Better)
- Training Module Completion Rate (Upper is Better)
- Feedback Score from Users (Upper is Better)
- Revision Cycles per Product (Lower is Better)
- Bug Fix Turnaround Time (Lower is Better)
Each of these can be categorized and measured in your KPI Definition sheet and tracked monthly.
Best Practices for the Human Resources Product Development KPI Dashboard
To get the most out of your dashboard, follow these simple best practices:
1. Define KPIs Clearly
Don’t guess. Ensure each KPI has a clear definition, unit of measure, and expected outcome.
2. Use Conditional Formatting Wisely
Use arrows or color codes to highlight good and poor performance. Keep it clean and not too flashy.
3. Update Data Consistently
Assign a team member to update the “Actual Numbers” sheet monthly. Regular input ensures your dashboard remains relevant.
4. Review Monthly
Pick a fixed day each month to sit with your HR team and review KPI performance.
5. Align with Business Goals
Ensure your KPIs align with broader organizational goals and HR strategies.
How to Get Started with the Template
If you’re wondering how to start, follow these steps:
- Download the template.
- Go to the KPI Definition sheet and customize KPI names and formulas.
- Enter targets and previous year data in their respective tabs.
- Begin updating actual numbers from your current month.
- Use the Dashboard tab to visualize and analyze performance.
That’s it! You’re now ready to manage your KPIs efficiently.
Conclusion
Tracking performance in HR product development is no longer a manual, messy process. With this Human Resources Product Development KPI Dashboard in Excel, you can automate, analyze, and act faster. It brings together all critical data in one place and helps HR leaders and teams stay aligned with strategic goals.
Don’t let performance gaps surprise you—track them, manage them, and close them with confidence!
Frequently Asked Questions (FAQs)
Q1. What is a KPI Dashboard in Excel?
A KPI Dashboard in Excel is a structured template used to track and visualize key performance indicators over time.
Q2. Why should HR teams use a KPI Dashboard?
It helps HR teams measure the effectiveness of their product development, track progress monthly, and improve decision-making.
Q3. Can I customize the KPI names and formulas?
Yes. The KPI Definition sheet allows you to change names, formulas, and KPI types easily.
Q4. Is this dashboard beginner-friendly?
Absolutely. With dropdowns, formulas, and clear sections, anyone with basic Excel skills can use it effectively.
Q5. Can I track both monthly and yearly data?
Yes. The dashboard is designed to show both MTD and YTD values side-by-side.
Click to Purchases Human Resources Product Development KPI Dashboard in Excel
Visit our YouTube channel to learn step-by-step video tutorials