In today’s competitive business world, Human Resources (HR) plays a crucial role in developing and nurturing talent. However, without proper tracking, training programs can lose effectiveness and investments may go unnoticed. That’s where an HR Training and Development KPI Dashboard in Excel comes in!
It helps HR teams measure, track, and improve the impact of their training initiatives, ensuring organizations stay on the path to growth and excellence.
In this article, we’ll explore everything you need to know about creating and using a Human Resources Training and Development KPI Dashboard in Excel — from key features to best practices, and advantages to frequently asked questions. Let’s dive right in!
Click to Purchases Human Resources Training and Development KPI Dashboard in Excel
What is a Human Resources Training and Development KPI Dashboard?
An HR Training and Development KPI Dashboard is a simple yet powerful Excel tool that tracks key performance indicators (KPIs) related to employee learning and development.
It provides a clear visual summary of how training programs perform over time — highlighting successes, gaps, and areas that need improvement.
Instead of drowning in spreadsheets and endless reports, you get a one-glance snapshot of your entire training strategy.
Key Features of the Human Resources Training and Development KPI Dashboard in Excel
We have created a ready-to-use Excel template that makes managing HR KPIs a breeze. Here’s a breakdown of what’s included:
Home Sheet
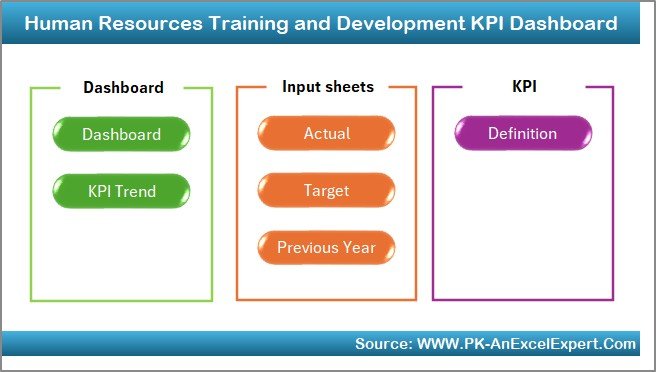
- Index Page with 6 navigation buttons.
- Instantly jump to any major section of the dashboard with a single click.
Dashboard Sheet Tab
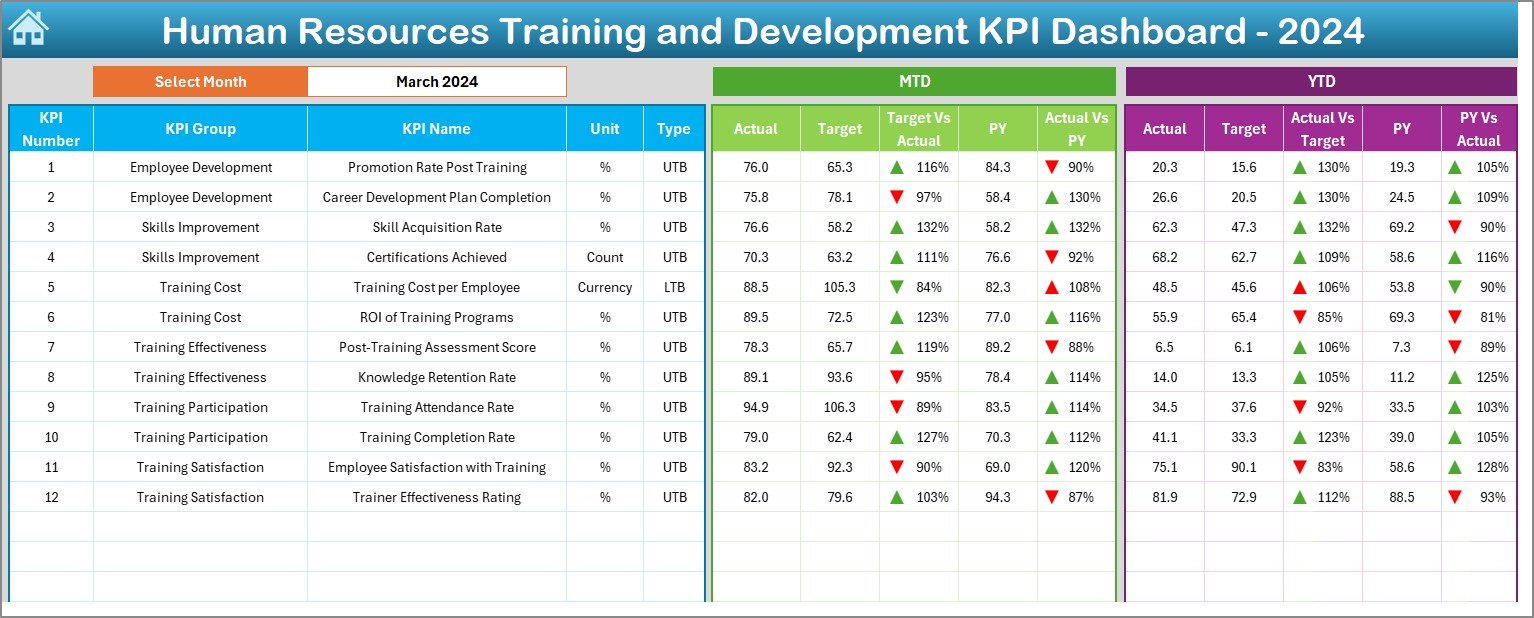
- Main Dashboard where all KPI insights are displayed.
- Select the desired month from a drop-down at Cell D3.
- Dynamic numbers that update automatically for the selected month.
- Visual indicators for:
- Month-to-Date (MTD) Actual, Target, Previous Year numbers
- Target vs Actual and Previous Year vs Actual comparisons
- Conditional formatting with up and down arrows for better insights.
KPI Trend Sheet Tab
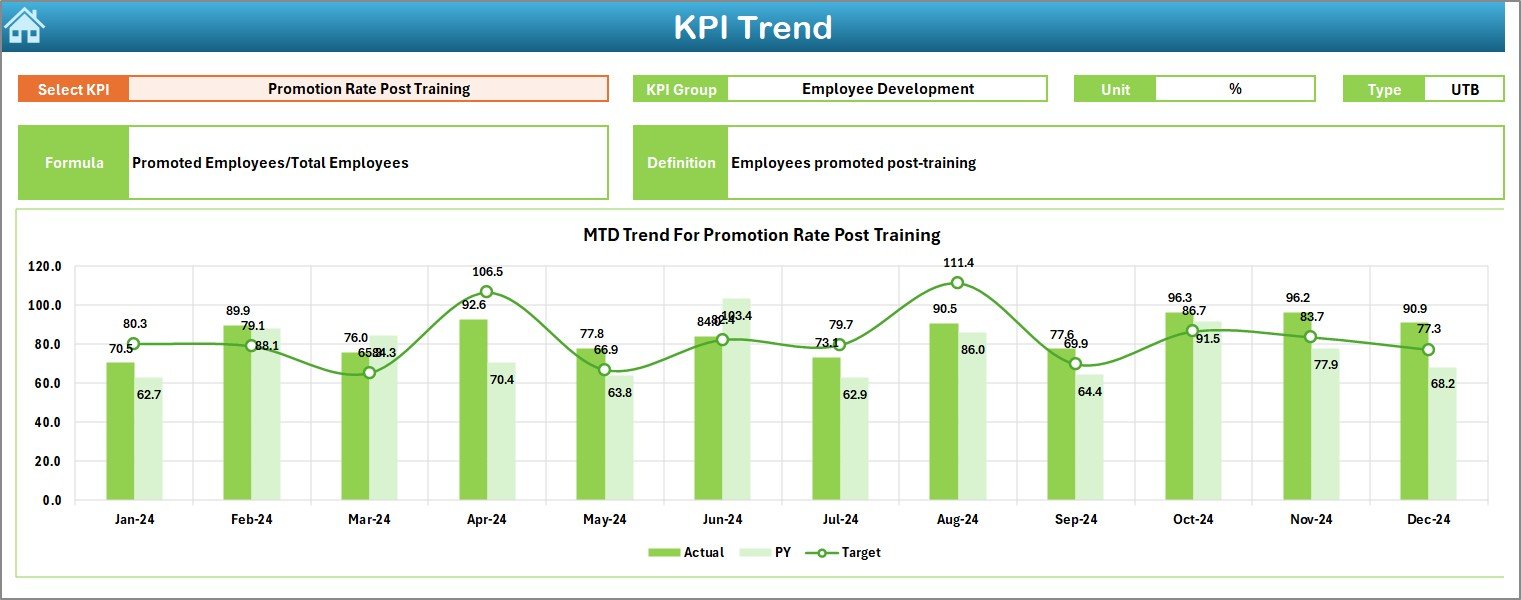
- Select any KPI from a drop-down menu at Cell C3.
- See detailed info: KPI Group, Unit, Type (UTB or LTB), Formula, and Definition.
- View MTD and YTD trend charts for:
- Actual performance
- Target values
- Previous Year data
Actual Numbers Input Sheet
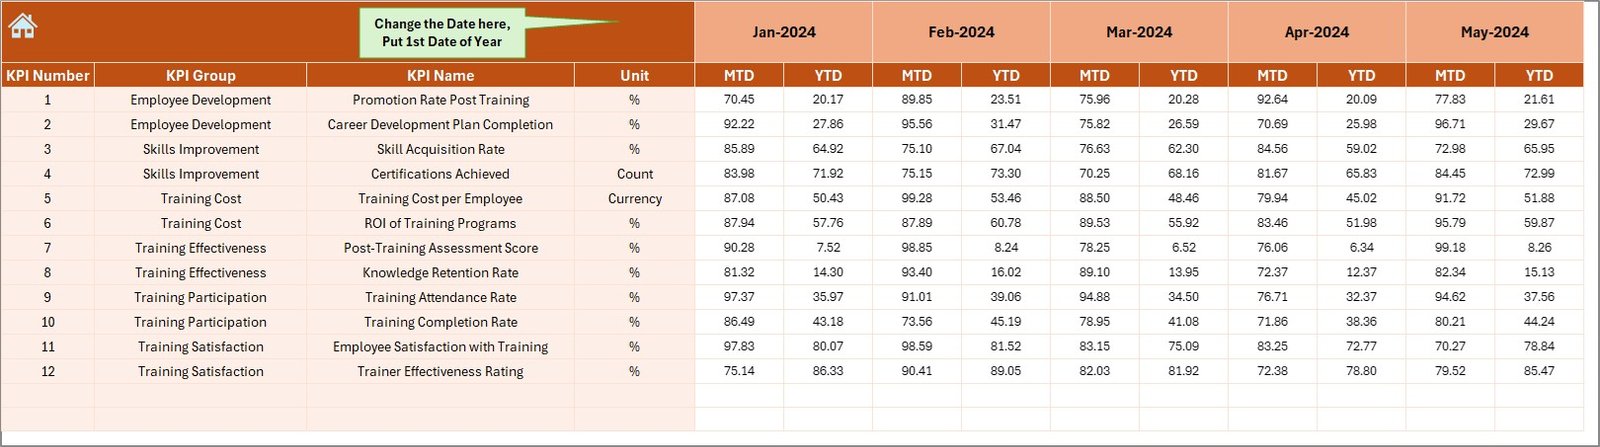
- Enter Actual MTD and YTD numbers for each month.
- Set the starting month in Cell E1 to automatically adjust calculations.
Click to Purchases Human Resources Training and Development KPI Dashboard in Excel
Target Sheet Tab
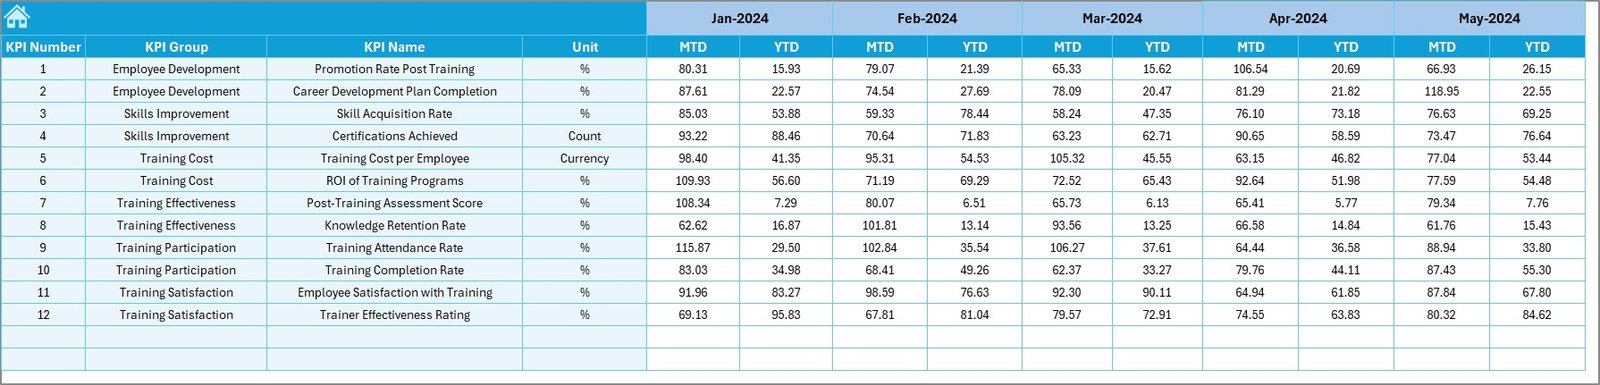
- Input Target MTD and YTD numbers for each KPI.
Previous Year Number Sheet Tab
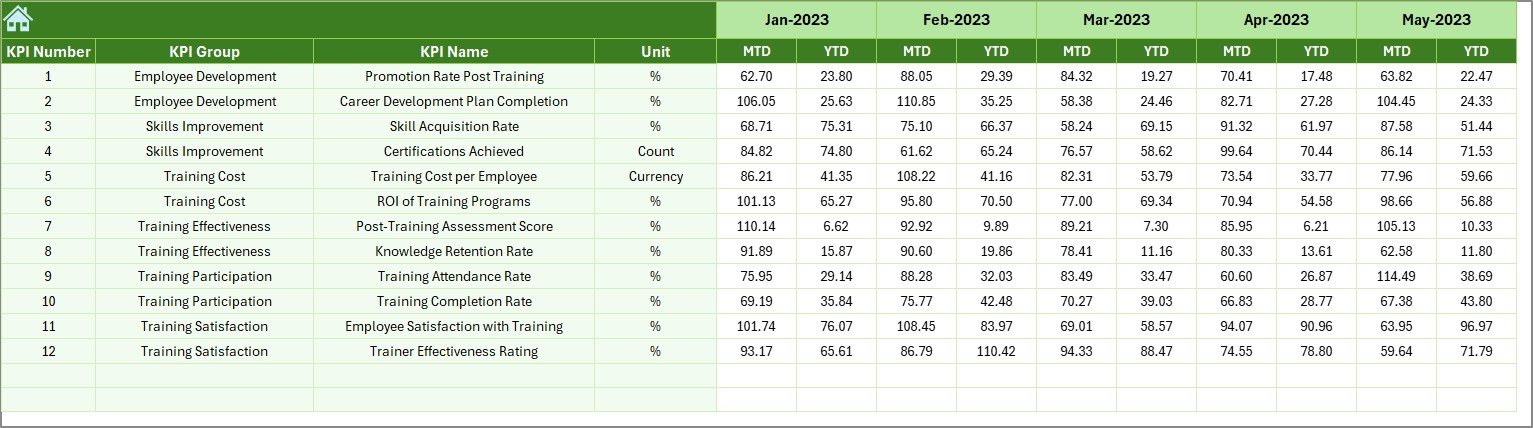
- Record Previous Year’s MTD and YTD numbers to allow year-over-year comparisons.
- KPI Definition Sheet Tab
- Capture essential KPI details:
- KPI Name
- KPI Group
- Unit of Measure
- Formula
- Definition
This structured setup ensures everything stays organized and easy to update throughout the year.
Why Should You Use a Training and Development KPI Dashboard?
Still wondering why you need it?
Here are some compelling reasons:
- 📊 Visual Clarity: See trends and performance at a glance.
- 🔥 Quick Decision-Making: Identify training gaps fast.
- 🎯 Goal Tracking: Measure how well training targets are being met.
- 📈 Performance Improvement: Improve programs based on real data.
- 💡 Employee Growth Monitoring: Spot high performers and those needing extra support.
Advantages of Using a Human Resources Training and Development KPI Dashboard
Let’s dig deeper into the benefits you’ll enjoy:
Increased Training ROI
By constantly tracking KPIs, HR can focus only on high-impact programs, reducing wasted time and money.
Better Employee Engagement
Training programs that adapt based on real data naturally lead to happier, more engaged employees.
Enhanced Strategic Planning
With trend analysis, HR leaders can forecast future training needs and proactively plan budgets and resources.
Easy Reporting to Management
Say goodbye to manual reporting headaches. This dashboard provides clean, impressive visuals that management loves.
Continuous Improvement
Regularly analyzing KPIs leads to smarter decisions and more successful learning and development initiatives over time.
How to Use the HR Training and Development KPI Dashboard Effectively?
Here’s a simple 5-step guide:
Input Actual Numbers: Enter monthly MTD and YTD figures for all KPIs.
Set Monthly Targets: Define clear training targets for each KPI.
Update Previous Year Data: Maintain an accurate historical baseline.
Review Trends: Regularly check the KPI Trend Sheet to spot patterns.
Take Action: Adjust training programs based on insights gained.
Following these steps ensures that your dashboard becomes a living, breathing tool — not just a static report.
Best Practices for Managing HR Training and Development KPI Dashboards
To get the most out of your dashboard, always remember these best practices:
Keep KPIs Relevant
Focus only on KPIs that truly reflect training and development success. Avoid cluttering the dashboard with vanity metrics.
Update Data Monthly
Regular updates keep your dashboard meaningful. Missing months reduce the accuracy of trend analysis.
Review KPI Definitions
Make sure all team members understand what each KPI means. Consistency ensures everyone is on the same page.
Use Visuals Wisely
Charts, graphs, and arrows should make data easier to understand — not more confusing. Keep it clean and simple.
Encourage Data-Driven Decisions
Use the insights from your dashboard to drive real conversations about improving learning and development programs.
Common KPIs to Track in HR Training and Development
Here are some example KPIs you might want to include in your dashboard:
- Training Attendance Rate (%)
- Training Completion Rate (%)
- Average Training Hours per Employee
- Certification Pass Rate (%)
- Training Satisfaction Score
- Employee Performance Post-Training (%)
- Training Cost per Employee
- Training Effectiveness Score
- Learning Transfer Rate
- New Skill Acquisition Rate (%)
Choosing the right KPIs ensures your dashboard paints a true picture of your training success.
How Does the KPI Dashboard Work Behind the Scenes?
If you’re curious, here’s a quick peek at how it functions:
- Drop-down selections make the dashboard dynamic.
- Formulas calculate the percentage differences between Actual, Target, and Previous Year.
- Conditional formatting automatically shows green up arrows or red down arrows based on performance.
- Charts in the KPI Trend sheet visualize trends over time.
- Linked data sheets ensure that updates automatically reflect across the dashboard without any extra work.
It’s all about making complex calculations easy and visually appealing!
Conclusion: Take Control of Your HR Training Strategy Today!
A Human Resources Training and Development KPI Dashboard in Excel is not just a fancy tool — it’s a game-changer for any HR department serious about training success.
When you start tracking the right KPIs, you can spot opportunities, fix gaps, and celebrate wins faster than ever before.
Don’t leave your training results to guesswork. Start using a structured KPI dashboard, and watch your organization grow stronger, smarter, and more successful!
Frequently Asked Questions (FAQs)
What is the purpose of an HR Training and Development KPI Dashboard?
The purpose is to track, measure, and visualize the success of HR training initiatives. It helps HR teams make data-driven decisions to improve employee development and organizational performance.
How often should I update the dashboard?
Ideally, update your dashboard monthly. This keeps the data fresh and ensures you spot trends early.
What KPIs are most important for HR training?
Important KPIs include Training Attendance Rate, Completion Rate, Certification Pass Rate, Average Training Hours per Employee, and Training Effectiveness Score.
Can I customize the KPI Dashboard template?
Yes, absolutely! You can easily modify the KPI names, units, targets, and visuals to fit your organization’s unique needs.
Click to Purchases Human Resources Training and Development KPI Dashboard in Excel
Visit our YouTube channel to learn step-by-step video tutorials