Hydropower projects play a critical role in sustainable energy generation across the world. Governments, private developers, and energy companies invest heavily in hydropower plants to produce clean electricity while reducing dependence on fossil fuels. However, managing hydropower projects involves complex operations, strict timelines, safety requirements, environmental compliance, and financial monitoring.
Therefore, organizations must track performance continuously using structured Key Performance Indicators (KPIs). Yet many project teams still rely on scattered spreadsheets, manual reports, or disconnected systems. As a result, decision-making becomes slow, performance issues remain hidden, and project efficiency declines.
So, how can hydropower organizations monitor performance clearly and efficiently?
Click to Purchases Hydropower Projects KPI Dashboard in Excel
The answer lies in using a Hydropower Projects KPI Dashboard in Excel — a powerful, ready-to-use performance management system that centralizes all hydropower KPIs in one interactive dashboard.
In this comprehensive guide, you will learn:
-
What a Hydropower Projects KPI Dashboard is
-
Why hydropower companies need KPI tracking
-
Dashboard structure and worksheets explained
-
Important KPIs for hydropower projects
-
Advantages of using the dashboard
-
Best practices for implementation
-
Practical usage tips and FAQs
Let’s begin by understanding the basics.
What Is a Hydropower Projects KPI Dashboard in Excel?
A Hydropower Projects KPI Dashboard in Excel is a structured performance monitoring tool designed to track operational, financial, environmental, and project execution metrics in hydropower plants.
Instead of analyzing multiple reports separately, project managers can monitor all KPIs from one centralized dashboard.
The dashboard allows users to:
-
Compare Actual vs Target performance
-
Analyze Month-to-Date (MTD) and Year-to-Date (YTD) results
-
Compare performance with the Previous Year (PY)
-
Identify performance gaps quickly
-
Make faster operational decisions
Because the dashboard works inside Microsoft Excel, organizations can implement it immediately without purchasing expensive software.
Why Do Hydropower Projects Need KPI Dashboards?
Hydropower projects involve engineering, environmental monitoring, financial planning, and operational control. Therefore, teams must measure performance regularly.
However, traditional reporting creates several challenges.
Common Problems Without KPI Tracking
-
Data scattered across departments
-
Manual reporting errors
-
Delayed performance visibility
-
Difficulty comparing targets and results
-
Poor trend analysis
-
Slow management decisions
Consequently, organizations struggle to maintain efficiency.
A KPI dashboard solves these problems by converting raw data into visual insights.
What Makes Excel Ideal for Hydropower KPI Monitoring?
Many organizations ask:
Why Use Excel Instead of Complex Software?
Excel provides several practical advantages:
-
Easy adoption across teams
-
No additional licensing cost
-
Flexible customization
-
Quick data entry and updates
-
Powerful calculations and charts
-
Offline accessibility
Moreover, Excel dashboards allow engineers, project managers, and executives to collaborate easily.
Overview of Hydropower Projects KPI Dashboard Structure
This ready-to-use template contains 7 structured worksheets, each designed for a specific purpose. Together, they create a complete KPI management system.
1. Home Sheet – Central Navigation Hub
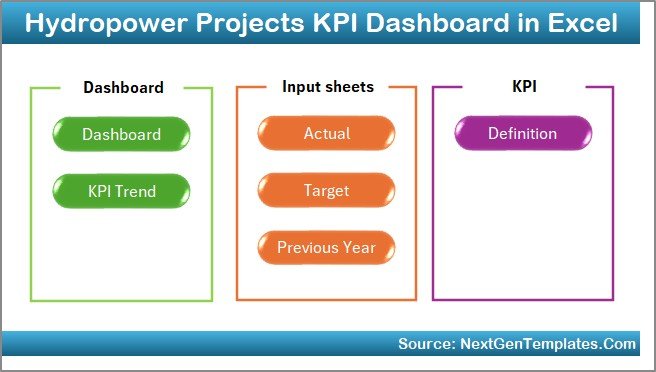
The Home sheet acts as an index page for the entire dashboard.
Key Features
-
Six navigation buttons
-
Quick access to all sheets
-
User-friendly interface
-
Smooth workflow navigation
Instead of searching through multiple tabs, users can jump directly to required sections.
As a result, productivity improves and users save time.
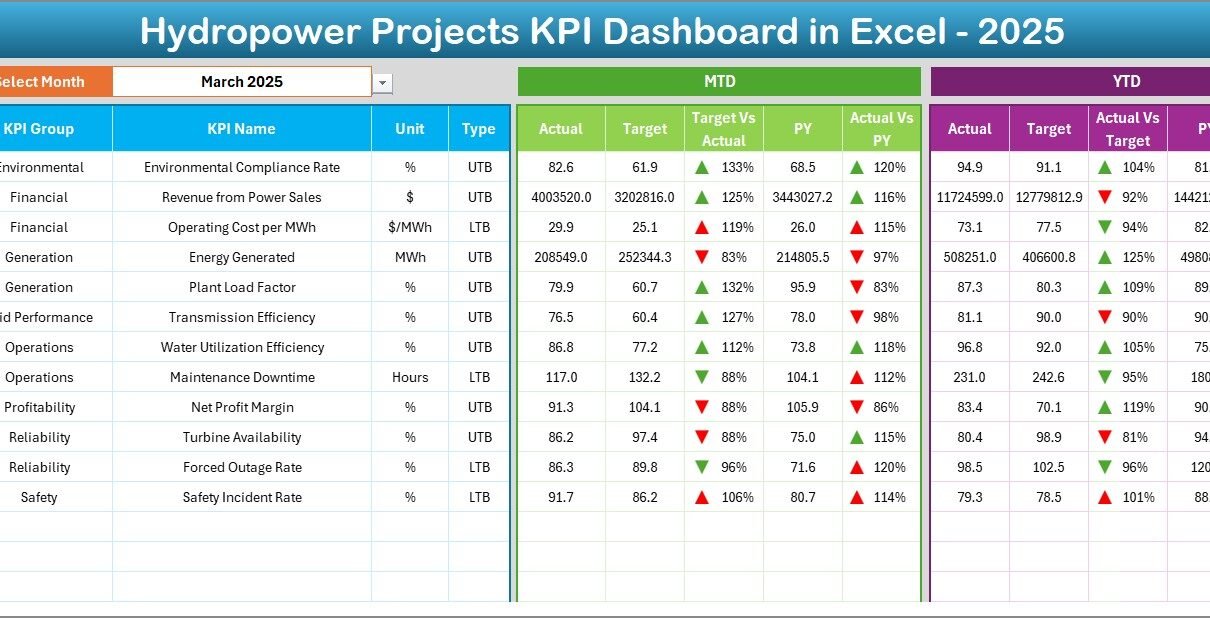
2. Dashboard Sheet – Main Performance View
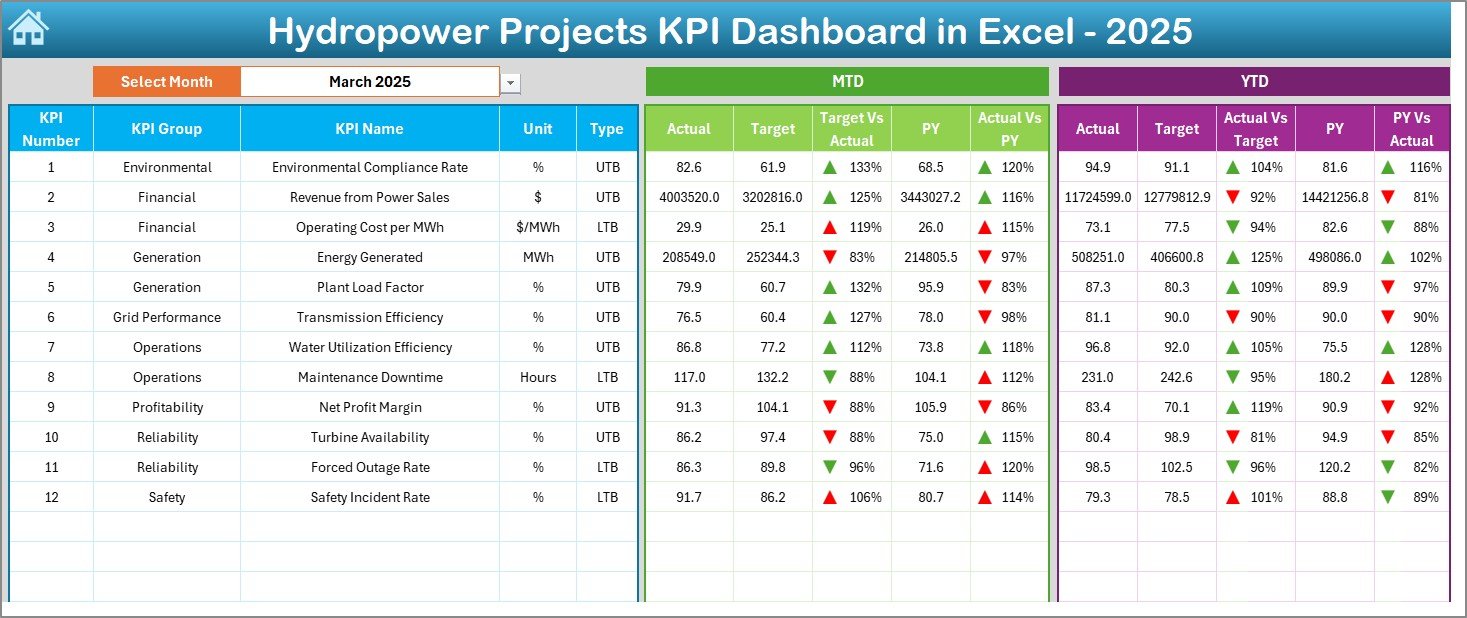
The Dashboard sheet serves as the heart of the KPI system.
Here, users view overall hydropower project performance in a single screen.
Click to Purchases Hydropower Projects KPI Dashboard in Excel
Interactive Month Selection
-
Select the month from the dropdown in cell D3
-
Entire dashboard updates automatically
Therefore, users can analyze performance instantly for any month.
KPI Metrics Displayed
The dashboard shows:
MTD Performance
-
MTD Actual
-
MTD Target
-
Previous Year Data
-
Target vs Actual comparison
-
PY vs Actual comparison
-
Conditional formatting arrows (up/down indicators)
YTD Performance
-
YTD Actual
-
YTD Target
-
Previous Year comparison
-
Visual performance indicators
Because visual arrows highlight performance trends, managers quickly identify improvement areas.
3. KPI Trend Sheet – Performance Analysis Over Time
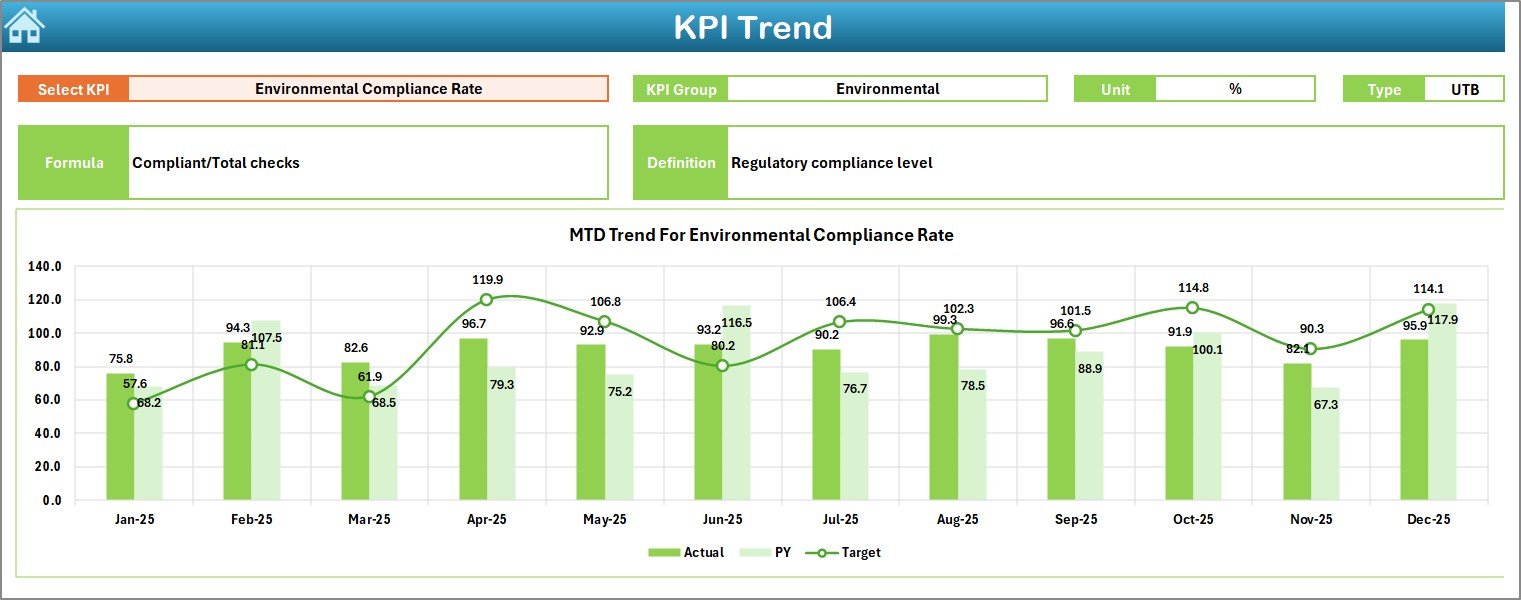
The KPI Trend sheet helps users analyze KPI movement across months.
What Can You Do Here?
Users select a KPI from dropdown cell C3, and the dashboard displays:
-
KPI Group
-
Unit of Measurement
-
KPI Type (Lower is Better / Upper is Better)
-
KPI Formula
-
KPI Definition
Additionally, the sheet shows:
-
MTD trend charts
-
YTD trend charts
-
Actual vs Target vs Previous Year comparisons
Therefore, decision-makers can understand whether performance improves or declines over time.
4. Actual Numbers Input Sheet – Data Entry Area
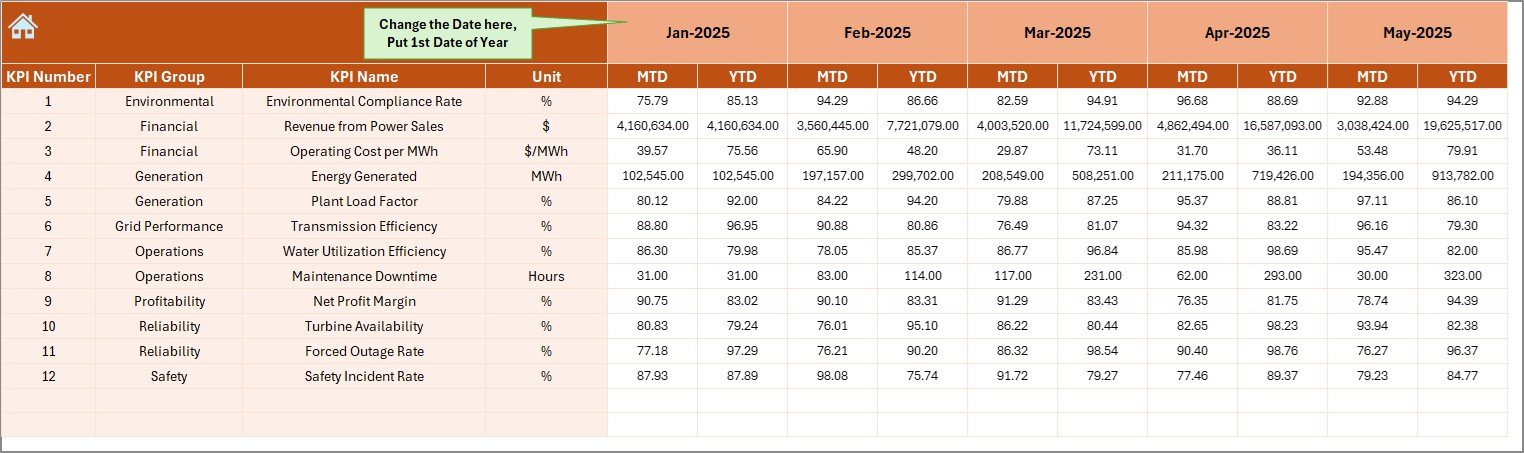
This sheet captures real operational data.
How It Works
-
Enter actual KPI values monthly
-
Change first month of the year in cell E1
-
Dashboard updates automatically
Because data entry remains centralized, users maintain data accuracy and consistency.
Click to Purchases Hydropower Projects KPI Dashboard in Excel
5. Target Sheet – Performance Planning
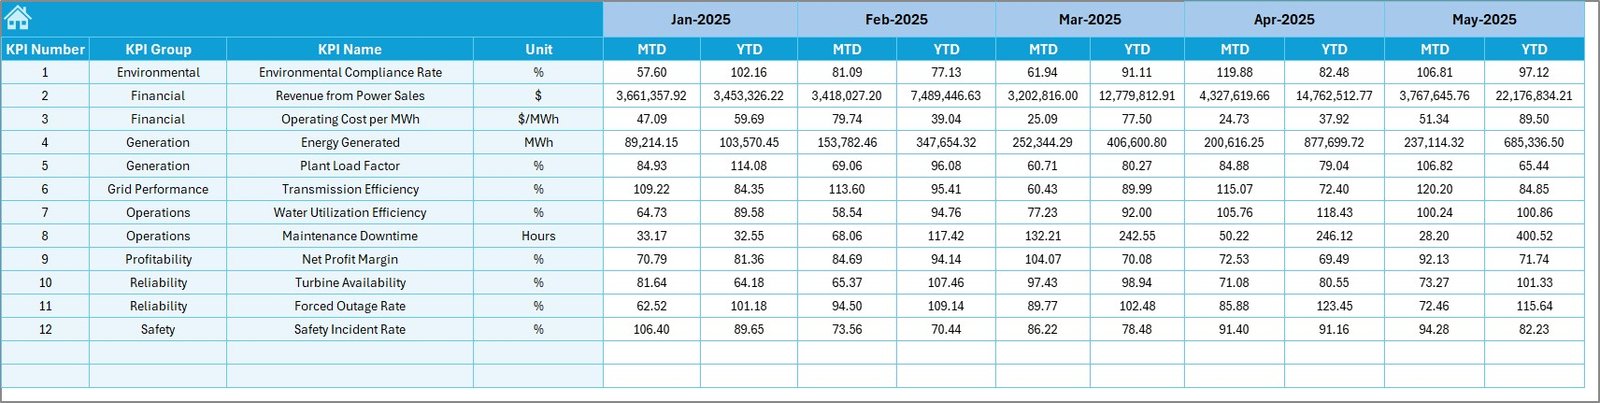
The Target Sheet stores planned KPI values.
Users enter:
-
Monthly MTD targets
-
Year-to-date targets
Consequently, management can measure progress against predefined goals.
6. Previous Year Numbers Sheet – Historical Comparison
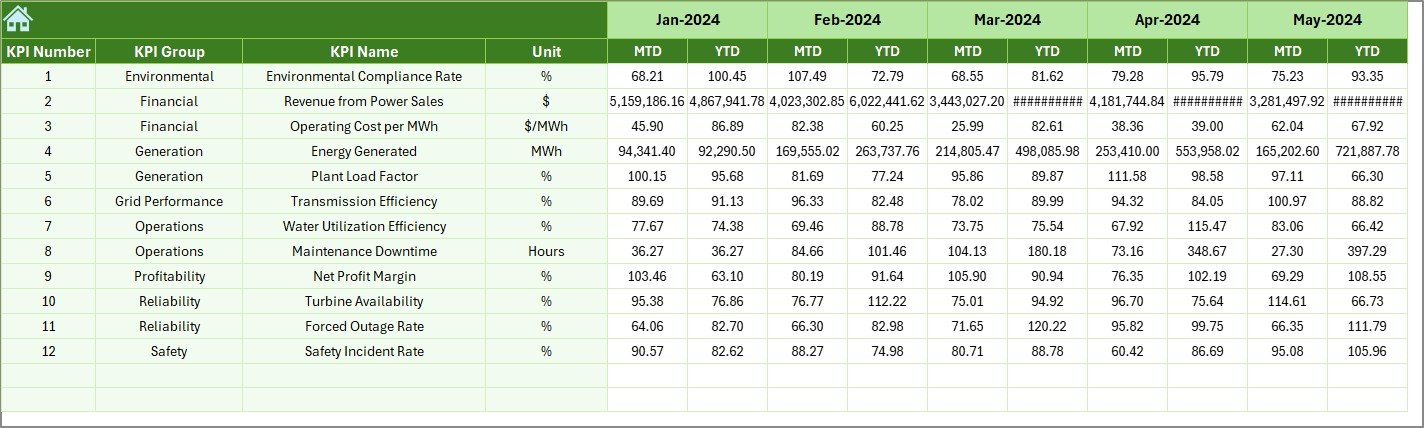
Historical performance plays an important role in project evaluation.
This sheet allows users to input previous year values similar to current year data.
Why This Matters
-
Enables year-over-year comparison
-
Helps identify growth patterns
-
Supports strategic forecasting
Therefore, managers gain deeper performance insights.
7. KPI Definition Sheet – KPI Documentation Center
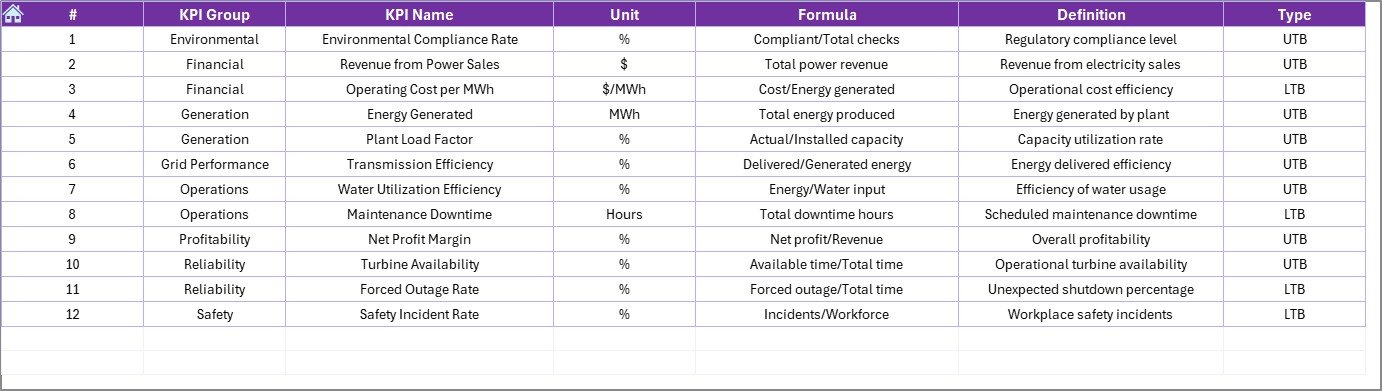
The KPI Definition sheet standardizes KPI understanding across teams.
Users enter:
-
KPI Name
-
KPI Group
-
Unit
-
Formula
-
KPI Definition
Because everyone references the same definitions, confusion disappears and reporting consistency improves.
Which KPIs Should Hydropower Projects Track?
A well-designed dashboard includes operational, financial, and environmental KPIs.
Operational KPIs
-
Plant Availability (%)
-
Turbine Efficiency
-
Energy Generation (MWh)
-
Forced Outage Rate
-
Maintenance Compliance
Financial KPIs
-
Cost per MWh
-
Revenue Generated
-
Budget Variance
-
Operating Cost Ratio
Environmental KPIs
-
Water Usage Efficiency
-
Environmental Compliance Rate
-
Carbon Reduction Contribution
Project Execution KPIs
-
Construction Progress %
-
Schedule Variance
-
Safety Incident Rate
-
Resource Utilization
Tracking these KPIs ensures balanced project management.
Advantages of Hydropower Projects KPI Dashboard in Excel
Click to Purchases Hydropower Projects KPI Dashboard in Excel
Using a structured dashboard delivers significant benefits.
✅ Centralized Performance Monitoring
All KPIs appear in one place, which simplifies analysis.
✅ Faster Decision Making
Managers instantly identify performance gaps.
✅ Improved Data Accuracy
Standardized input sheets reduce errors.
✅ Visual Performance Indicators
Conditional formatting highlights trends clearly.
✅ Historical Comparison
Year-over-year analysis supports planning.
✅ Cost-Effective Solution
Organizations avoid expensive BI tools.
✅ Easy Customization
Teams modify KPIs based on project needs.
How Does the Dashboard Improve Project Management?
The dashboard transforms raw data into actionable insights.
For example:
-
Engineers track equipment efficiency trends.
-
Finance teams monitor cost performance.
-
Executives evaluate overall project health.
-
Environmental teams verify compliance metrics.
Therefore, every department works with the same performance view.
How to Use the Hydropower KPI Dashboard Step-by-Step?
Follow these simple steps:
Step 1: Define KPIs
Enter KPI details in the KPI Definition sheet.
Step 2: Enter Targets
Add monthly targets in the Target sheet.
Step 3: Add Previous Year Data
Input historical numbers for comparison.
Step 4: Input Actual Data
Update monthly performance values.
Step 5: Select Month
Choose a month from the dashboard dropdown.
Step 6: Analyze Trends
Review charts and performance arrows.
As a result, users gain instant performance visibility.
Best Practices for the Hydropower Projects KPI Dashboard in Excel
Click to Purchases Hydropower Projects KPI Dashboard in Excel
To maximize dashboard effectiveness, follow these best practices.
✔ Define Clear KPI Ownership
Assign responsibility for each KPI.
✔ Update Data Regularly
Maintain weekly or monthly updates.
✔ Keep KPIs Relevant
Track only metrics aligned with project goals.
✔ Validate Data Before Entry
Ensure data accuracy to avoid misleading insights.
✔ Use Trend Analysis
Focus on patterns instead of single values.
✔ Review Dashboard Frequently
Conduct monthly performance reviews.
✔ Train Team Members
Ensure everyone understands dashboard usage.
Common Mistakes to Avoid While Using KPI Dashboards
Even powerful dashboards fail without proper usage.
Avoid these mistakes:
-
Tracking too many KPIs
-
Ignoring historical comparisons
-
Updating data irregularly
-
Using unclear KPI definitions
-
Overcomplicating metrics
Instead, keep monitoring simple and consistent.
Who Can Benefit from This Dashboard?
Many stakeholders gain value from this solution.
Project Managers
Monitor schedule and operational performance.
Plant Operators
Track efficiency and downtime.
Finance Teams
Analyze cost and revenue performance.
Energy Companies
Improve renewable energy management.
Government Agencies
Monitor project compliance and sustainability.
Why Hydropower Projects Need Data-Driven Decisions Today?
Energy demand continues to rise globally. At the same time, sustainability requirements grow stricter. Therefore, hydropower operators must optimize efficiency continuously.
Data-driven dashboards enable organizations to:
-
Reduce operational risks
-
Improve asset utilization
-
Increase energy output
-
Control project costs
-
Achieve environmental goals
Consequently, KPI dashboards become essential management tools rather than optional reports.
Future of Hydropower KPI Monitoring
Technology continues evolving rapidly.
In the future, organizations will integrate:
-
IoT sensor data
-
Automated reporting
-
Predictive analytics
-
AI-based maintenance planning
However, Excel dashboards remain the starting point for structured performance tracking because they provide flexibility and accessibility.
Conclusion
Hydropower projects require precise monitoring, strategic planning, and continuous performance evaluation. Without structured KPI tracking, organizations struggle to identify inefficiencies and make timely decisions.
The Hydropower Projects KPI Dashboard in Excel provides a practical and powerful solution by combining operational data, targets, historical comparison, and visual analytics into one centralized system.
Because the dashboard includes structured worksheets, automated calculations, and trend analysis features, teams can monitor performance efficiently while improving project outcomes.
Ultimately, organizations that adopt KPI dashboards gain better visibility, stronger control, and improved operational success.
Frequently Asked Questions (FAQs)
1. What is a Hydropower KPI Dashboard?
A Hydropower KPI Dashboard tracks project and operational performance using measurable indicators such as generation efficiency, cost metrics, and availability rates.
2. Can beginners use this Excel dashboard?
Yes. The template uses simple data entry sheets and dropdown selections, so beginners can use it easily.
3. How often should users update KPI data?
Teams should update data monthly or weekly depending on project monitoring requirements.
4. Can organizations customize KPIs?
Yes. Users can add, modify, or remove KPIs according to project needs.
5. Does the dashboard support historical comparison?
Yes. The Previous Year sheet enables year-over-year performance analysis.
6. Do I need advanced Excel skills to use it?
No. Basic Excel knowledge works perfectly because formulas and structure already exist.
7. Why should hydropower companies track KPIs?
KPI tracking improves efficiency, reduces risk, enhances decision-making, and supports sustainable energy management.
Visit our YouTube channel to learn step-by-step video tutorials