Industrial automation drives modern manufacturing. However, many companies still struggle to track machine efficiency, downtime, production output, and maintenance costs in one structured system. As a result, managers rely on scattered reports. Consequently, they miss performance gaps. Moreover, decision-makers fail to identify trends early.
So, how can you monitor MTD and YTD performance, compare actual vs target, and analyze previous year data in one interactive dashboard?
The answer is simple.
You need an Industrial Automation Equipment KPI Dashboard in Excel.
Click to Purchases Industrial Automation Equipment KPI Dashboard in Excel
In this comprehensive guide, you will learn:
-
What an Industrial Automation Equipment KPI Dashboard is
-
Why automation manufacturers need it
-
Detailed explanation of all 7 worksheet tabs
-
Important KPIs for industrial automation equipment
-
Advantages of this KPI dashboard
-
Best practices for implementation
-
Frequently Asked Questions with answers
Let us explore everything step by step.
What Is an Industrial Automation Equipment KPI Dashboard in Excel?
An Industrial Automation Equipment KPI Dashboard in Excel is a ready-to-use performance tracking tool that helps manufacturers monitor automation systems efficiently.
Instead of switching between multiple spreadsheets, you can view all KPIs in one place. Furthermore, you can compare:
-
MTD (Month-to-Date) Actual vs Target
-
YTD (Year-to-Date) Actual vs Target
-
Previous Year (PY) comparisons
-
Trend charts for deeper analysis
Because the dashboard uses Excel, you do not need advanced software. You simply enter your numbers, and the dashboard updates automatically.
Why Do Industrial Automation Companies Need a KPI Dashboard?
Industrial automation involves robotics, PLC systems, conveyors, sensors, CNC machines, and control panels. Therefore, performance tracking becomes critical.
Without structured tracking:
-
Downtime increases unnoticed
-
Maintenance costs rise
-
Equipment efficiency drops
-
Production targets fail
-
Quality issues multiply
However, when you use a KPI dashboard:
-
You identify weak machines quickly
-
You compare performance month by month
-
You make faster production decisions
-
You improve overall equipment effectiveness
Therefore, this dashboard becomes a strategic management tool rather than just a reporting file.
What Are the 7 Worksheets Inside This KPI Dashboard?
This Industrial Automation Equipment KPI Dashboard in Excel contains 7 structured worksheets. Each sheet serves a specific purpose. Let us understand them clearly.
1️⃣ Home Sheet – Your Navigation Center
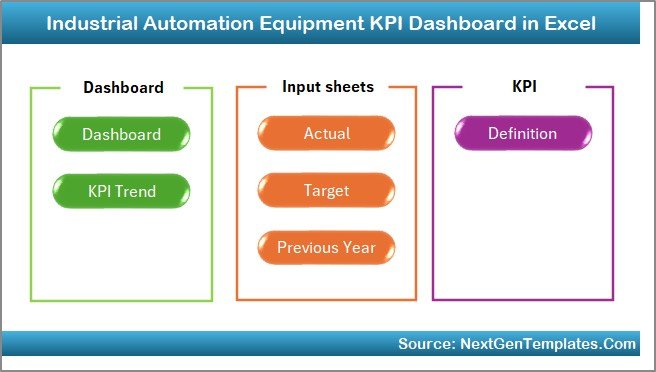
The Home sheet acts as an index page.
Here, you get 6 interactive buttons that help you jump directly to:
-
Dashboard
-
KPI Trend
-
Actual Input
-
Target Sheet
-
Previous Year Sheet
-
KPI Definition
Because of this structure, users save time. Moreover, managers can access reports quickly during meetings.
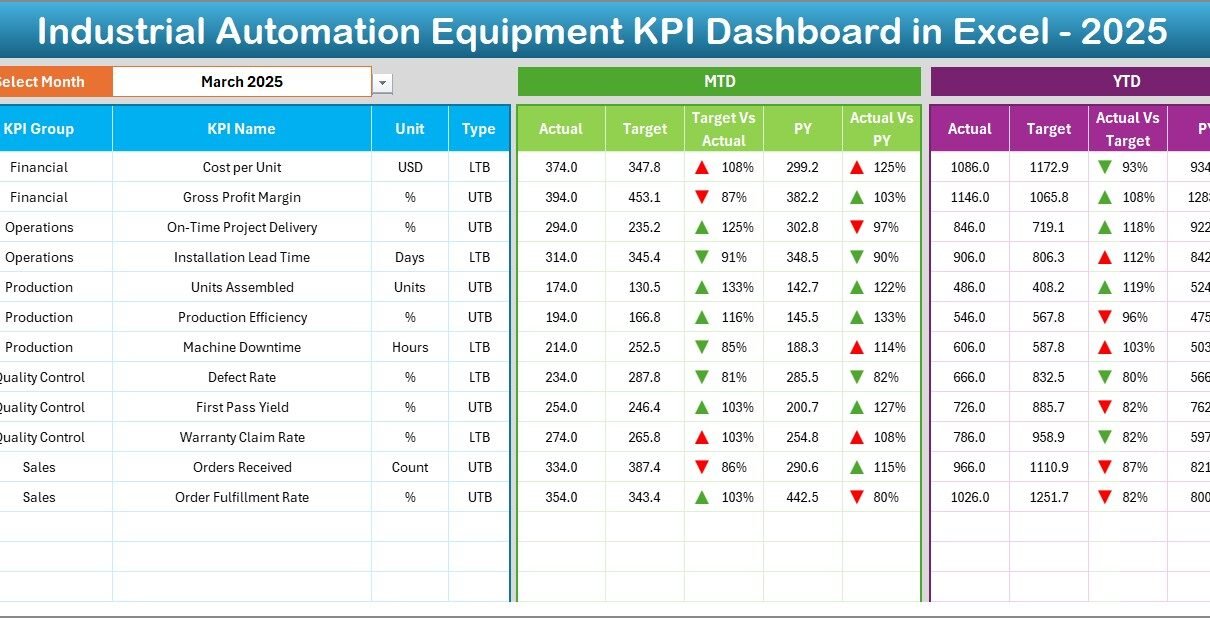
2️⃣ Dashboard Sheet – The Main Performance Overview
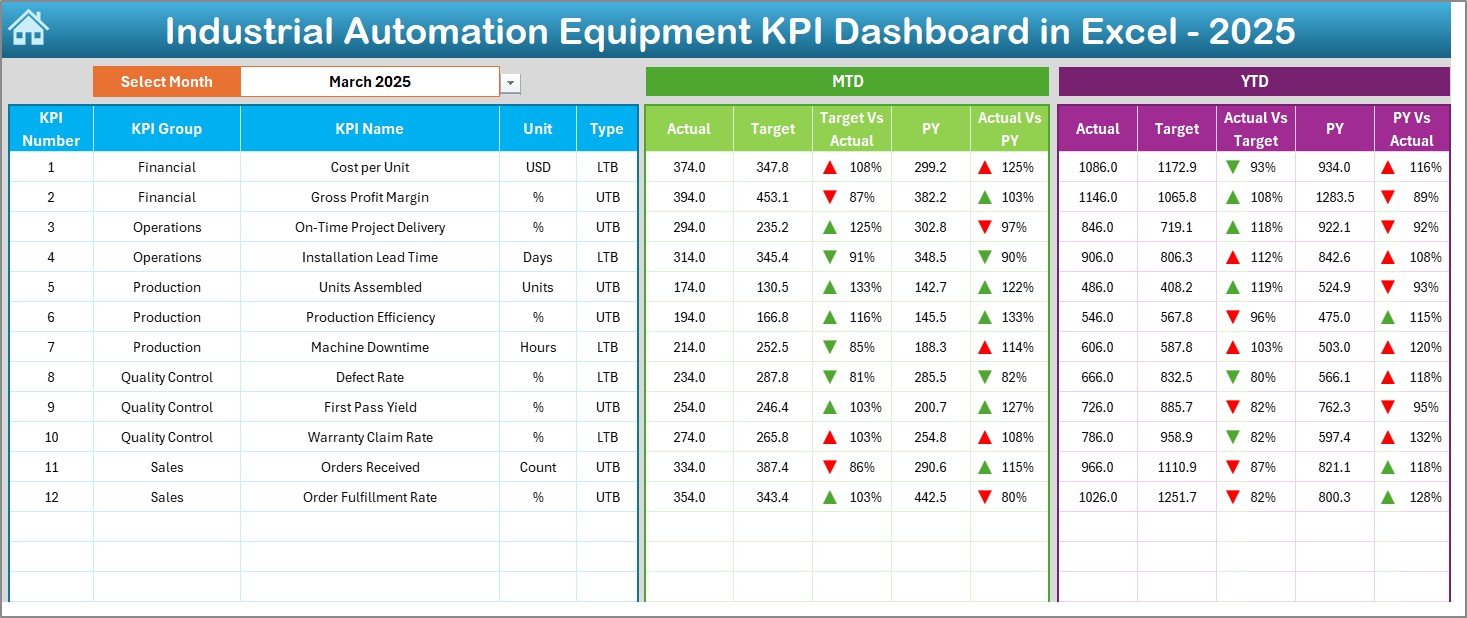
This sheet works as the heart of the entire system.
On cell D3, you can select the Month from a drop-down menu. Once you select the month, the entire dashboard updates automatically.
What Does the Dashboard Display?
-
MTD Actual
-
MTD Target
-
MTD Previous Year
-
Target vs Actual comparison
-
Previous Year vs Actual comparison
-
YTD Actual
-
YTD Target
-
YTD Previous Year
Furthermore, the dashboard uses conditional formatting with up and down arrows. Therefore, you can instantly identify whether performance improved or declined.
Because of this visual clarity, decision-makers can analyze results within seconds.
3️⃣ KPI Trend Sheet – Deep Performance Analysis
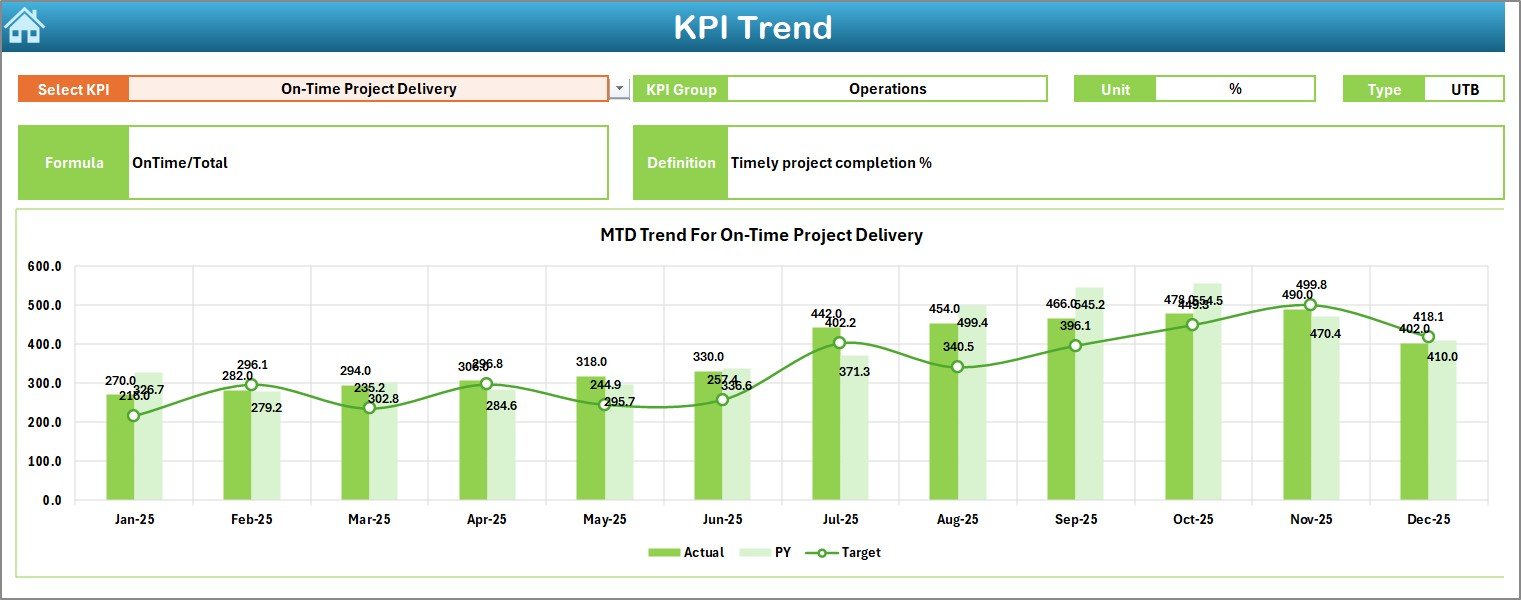
This sheet allows detailed KPI-level analysis.
On cell C3, you can select any KPI from a drop-down list.
Once selected, the sheet displays:
-
KPI Group
-
Unit of KPI
-
KPI Type (Lower the Better or Upper the Better)
-
Formula
-
Definition
Additionally, it shows:
-
MTD trend chart (Actual vs Target vs PY)
-
YTD trend chart (Actual vs Target vs PY)
Therefore, managers can evaluate patterns across months instead of reviewing only a single month.
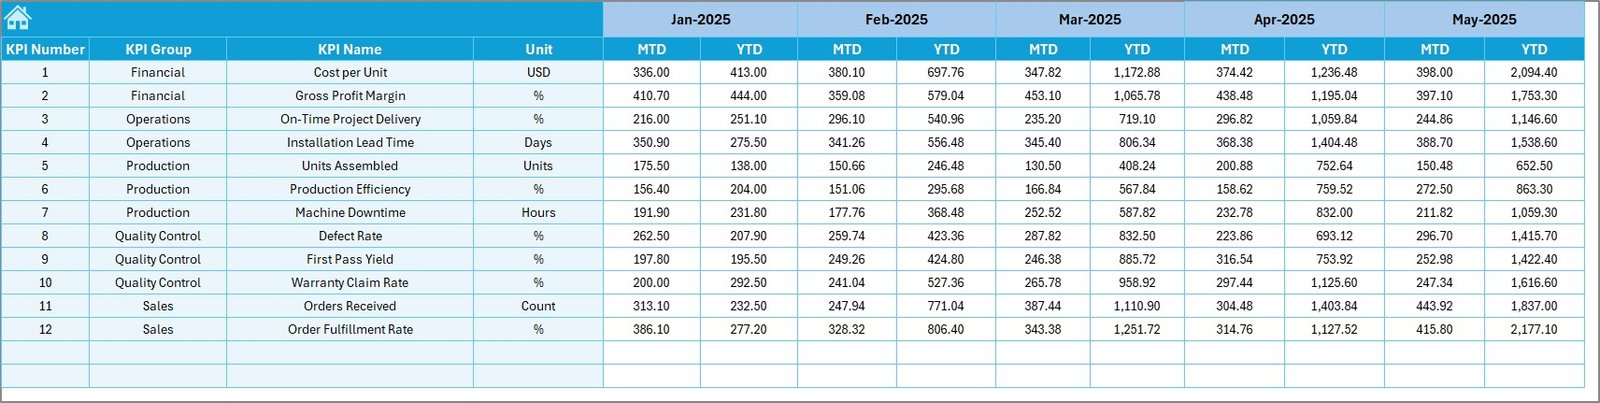
4️⃣ Actual Numbers Input Sheet – Enter Current Performance
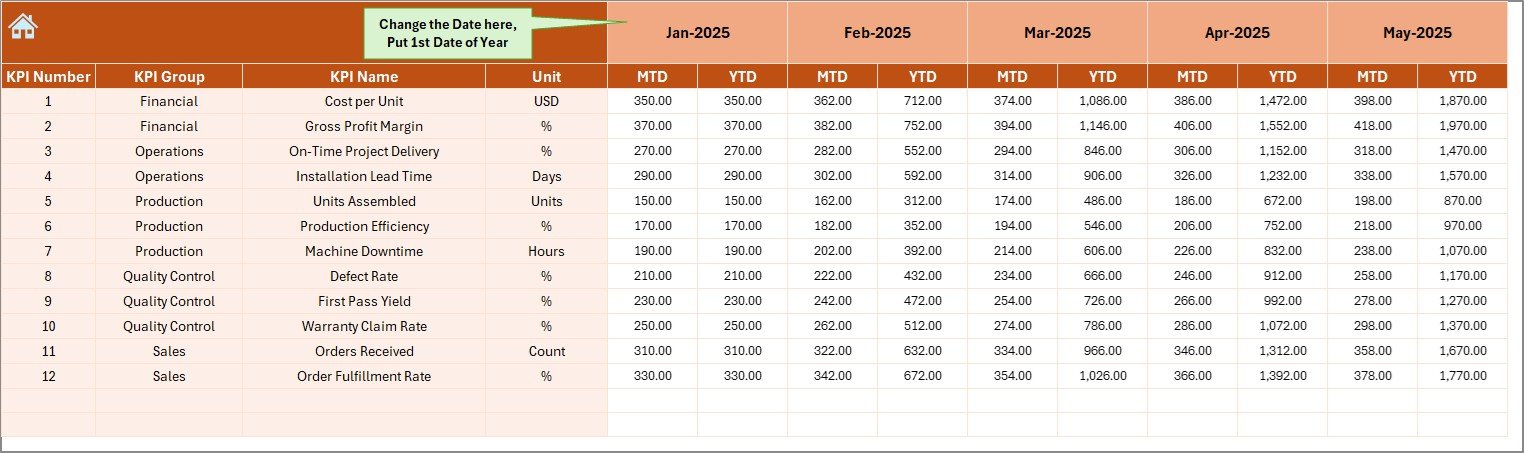
This sheet allows you to enter actual values.
On cell E1, you define the first month of the financial year. After that, you simply enter:
-
MTD actual values
-
YTD actual values
Because of structured data entry, the dashboard updates automatically. Moreover, you can avoid formula errors.
5️⃣ Target Sheet – Define Performance Goals
Here, you enter:
-
MTD target numbers
-
YTD target numbers
Setting clear targets improves accountability. Furthermore, when you compare actual vs target, you identify performance gaps instantly.
6️⃣ Previous Year Numbers Sheet – Historical Comparison
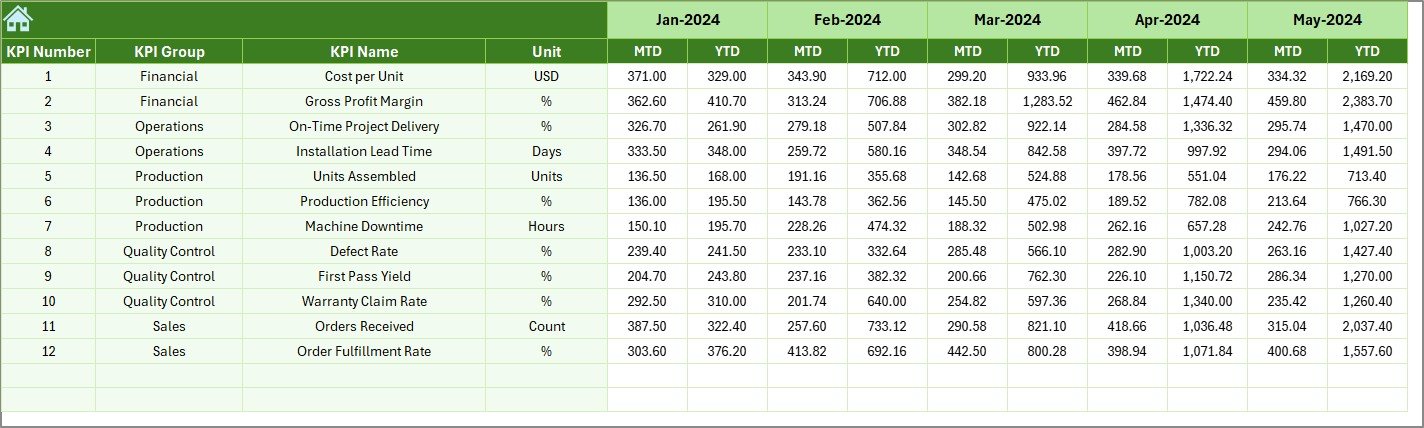
You enter previous year data in this sheet.
By comparing current performance with previous year numbers, you can:
-
Measure growth
-
Identify decline
-
Evaluate improvement initiatives
Therefore, long-term trend tracking becomes easy.
7️⃣ KPI Definition Sheet – Standardized KPI Structure
Click to Purchases Industrial Automation Equipment KPI Dashboard in Excel
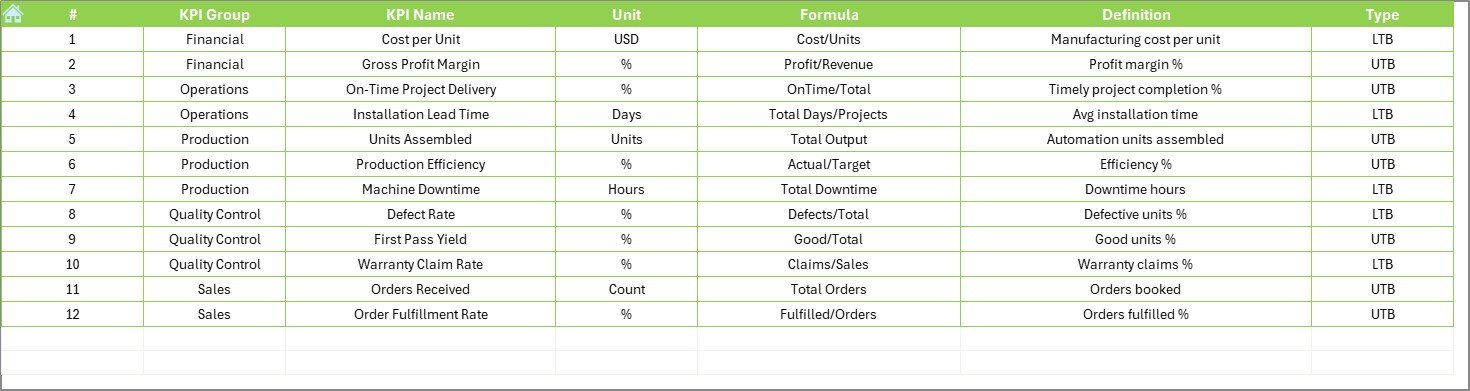
This sheet stores:
-
KPI Name
-
KPI Group
-
Unit
-
Formula
-
KPI Definition
Because every KPI has a clear definition, confusion reduces. Moreover, teams follow the same calculation method.
Which KPIs Should You Track in Industrial Automation Equipment?
Choosing the right KPIs matters. Therefore, you should track operational, maintenance, and financial metrics.
Here are some important KPIs:
Production KPIs
-
Overall Equipment Effectiveness (OEE)
-
Production Output Rate
-
Cycle Time
-
Machine Utilization Rate
-
Production Downtime
Maintenance KPIs
-
Mean Time Between Failures (MTBF)
-
Mean Time To Repair (MTTR)
-
Preventive Maintenance Compliance
-
Maintenance Cost per Machine
Quality KPIs
-
Defect Rate
-
First Pass Yield
-
Rework Percentage
Financial KPIs
-
Cost per Unit
-
Energy Cost per Machine
-
Spare Parts Cost
When you track these KPIs consistently, you improve machine reliability and reduce waste.
How Does This Dashboard Improve Decision Making?
First, it centralizes all data. Second, it provides instant visual comparison. Third, it supports trend analysis.
Because of these features:
-
Production managers adjust schedules faster
-
Maintenance teams act before breakdowns
-
Finance teams control operating costs
-
Senior management monitors plant efficiency
Therefore, you reduce reactive decisions and move toward proactive planning.
Advantages of Industrial Automation Equipment KPI Dashboard in Excel
Now, let us discuss the major advantages.
✔️ 1. Real-Time Performance Monitoring
You update numbers monthly, and the dashboard refreshes instantly. Therefore, you always work with current data.
✔️ 2. Clear Visual Comparison
Conditional arrows and comparisons highlight performance changes quickly.
✔️ 3. Simple Excel Interface
You do not need Power BI or advanced tools. Excel works smoothly for most organizations.
✔️ 4. Structured KPI Definitions
Standardized KPI definitions avoid confusion across departments.
✔️ 5. Easy Month Selection
The drop-down month selector in cell D3 updates the entire dashboard.
✔️ 6. Historical Analysis
Previous year data allows year-over-year performance comparison.
✔️ 7. Time Saving
Navigation buttons reduce manual searching.
Therefore, this dashboard not only tracks KPIs but also improves overall plant control.
Best Practices for the Industrial Automation Equipment KPI Dashboard
To get maximum benefit, follow these best practices.
🔹 1. Update Data Consistently
Enter data on a fixed schedule, such as monthly or weekly.
🔹 2. Define KPIs Clearly
Use simple definitions in the KPI Definition sheet.
🔹 3. Avoid Manual Formula Changes
Do not modify formulas unless required.
🔹 4. Review Trends Monthly
Always analyze trend charts, not just current month numbers.
🔹 5. Set Realistic Targets
Targets should challenge teams but remain achievable.
🔹 6. Conduct Monthly Review Meetings
Use the dashboard during production meetings for discussion.
🔹 7. Train Users
Train team members to enter accurate data.
When you follow these steps, you ensure reliable reporting and better decisions.
Click to Purchases Industrial Automation Equipment KPI Dashboard in Excel
How to Implement This KPI Dashboard in Your Organization?
Follow these simple steps:
-
Identify your key KPIs
-
Define KPI formulas clearly
-
Enter previous year historical data
-
Set monthly targets
-
Start entering actual data
-
Review dashboard every month
Because the dashboard uses Excel, implementation remains quick and cost-effective.
Conclusion
Industrial automation equipment demands precision, efficiency, and reliability. However, without structured tracking, performance gaps remain hidden. Therefore, organizations need a centralized system.
The Industrial Automation Equipment KPI Dashboard in Excel offers:
-
Clear MTD and YTD comparisons
-
Target vs Actual tracking
-
Previous year analysis
-
Trend visualization
-
Structured KPI definitions
Moreover, it simplifies reporting while improving decision-making.
If you want better production control, lower downtime, and improved efficiency, this dashboard provides a practical solution.
Frequently Asked Questions (FAQs)
❓ What is MTD and YTD in KPI tracking?
MTD refers to Month-to-Date performance. YTD refers to Year-to-Date cumulative performance.
❓ Can I customize KPIs in this dashboard?
Yes. You can modify KPI names and definitions in the KPI Definition sheet.
❓ Do I need advanced Excel knowledge?
No. Basic Excel knowledge is sufficient to use this dashboard.
❓ Can I use this for multiple plants?
Yes. You can create separate files for each plant or expand the data sheet.
❓ How often should I update the dashboard?
You should update it monthly. However, you can update it weekly if required.
❓ Does this dashboard support previous year comparison?
Yes. The Previous Year sheet allows full year-over-year comparison.
Visit our YouTube channel to learn step-by-step video tutorials
Click to Purchases Industrial Automation Equipment KPI Dashboard in Excel