In today’s highly competitive manufacturing environment, companies that produce industrial tools and fasteners must continuously monitor performance to remain profitable and efficient. Manufacturers face increasing pressure to improve productivity, control costs, reduce defects, and deliver products on time. However, many organizations still rely on scattered spreadsheets and manual reporting systems. As a result, decision-making becomes slow and performance visibility remains limited.
Therefore, businesses now prefer structured KPI dashboards that transform raw operational data into meaningful insights. One powerful solution is the Industrial Tools and Fasteners KPI Dashboard in Excel — a ready-to-use performance monitoring system designed to track manufacturing KPIs clearly and efficiently.
In this comprehensive guide, you will learn everything about this dashboard, including its structure, features, benefits, implementation steps, best practices, and frequently asked questions.
Click to buy Industrial Tools and Fasteners KPI Dashboard in Excel
What Is an Industrial Tools and Fasteners KPI Dashboard in Excel?
An Industrial Tools and Fasteners KPI Dashboard in Excel is an interactive performance monitoring tool that helps manufacturing companies measure operational success using Key Performance Indicators (KPIs).
Instead of reviewing multiple reports separately, managers can analyze production, quality, delivery, and efficiency metrics from a single dashboard. Moreover, Excel automation allows users to update numbers quickly while visual elements update automatically.
This dashboard enables organizations to:
- Track production efficiency in real time
- Compare actual vs target performance
- Monitor monthly and yearly trends
- Identify performance gaps instantly
- Support data-driven decision-making
Consequently, leadership teams gain clarity and respond faster to operational challenges.
Why Do Industrial Tools and Fasteners Manufacturers Need KPI Tracking?
Industrial tools and fasteners manufacturing involves multiple processes such as forging, machining, threading, heat treatment, coating, packaging, and logistics. Because each stage impacts product quality and cost, performance tracking becomes essential.
Without structured KPI monitoring:
- Production delays increase
- Quality defects remain unnoticed
- Costs rise unexpectedly
- Delivery commitments suffer
- Decision-making slows down
However, when companies implement a KPI dashboard, they gain visibility across operations. Therefore, managers can quickly identify bottlenecks and improve performance continuously.
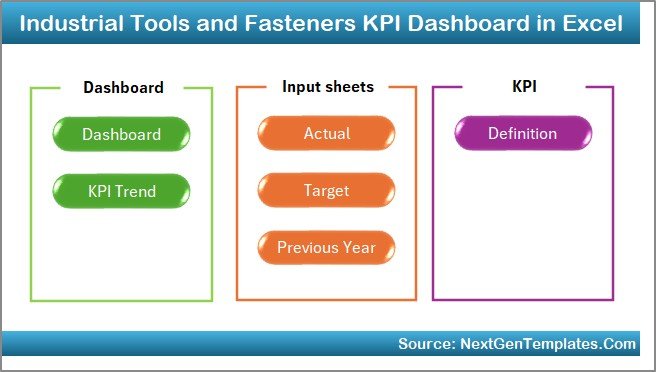
Key Features of the Industrial Tools and Fasteners KPI Dashboard in Excel
This dashboard includes seven structured worksheets, each designed to perform a specific function. Together, they create a complete KPI management system.
Summary Page – Central Navigation Hub
The Summary Page acts as an index sheet that simplifies navigation.
Key highlights include:
- Six navigation buttons for quick access
- User-friendly layout
- Central control interface
- Smooth movement between sheets
Because users can jump instantly to any section, workflow becomes faster and more efficient.
Click to buy Industrial Tools and Fasteners KPI Dashboard in Excel
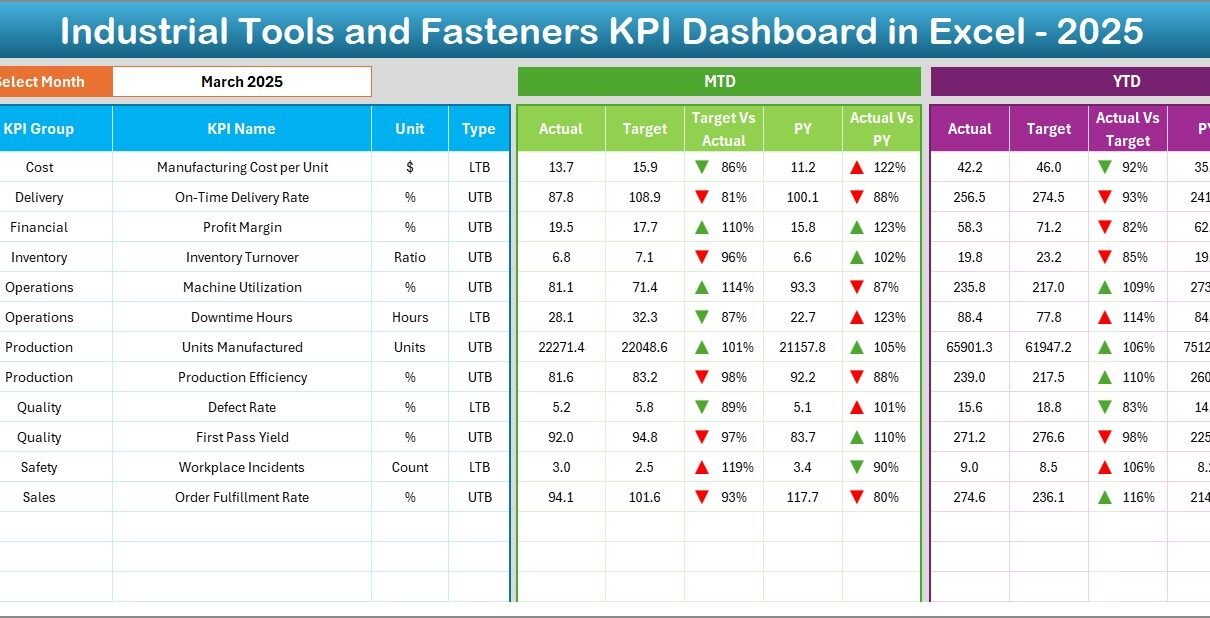
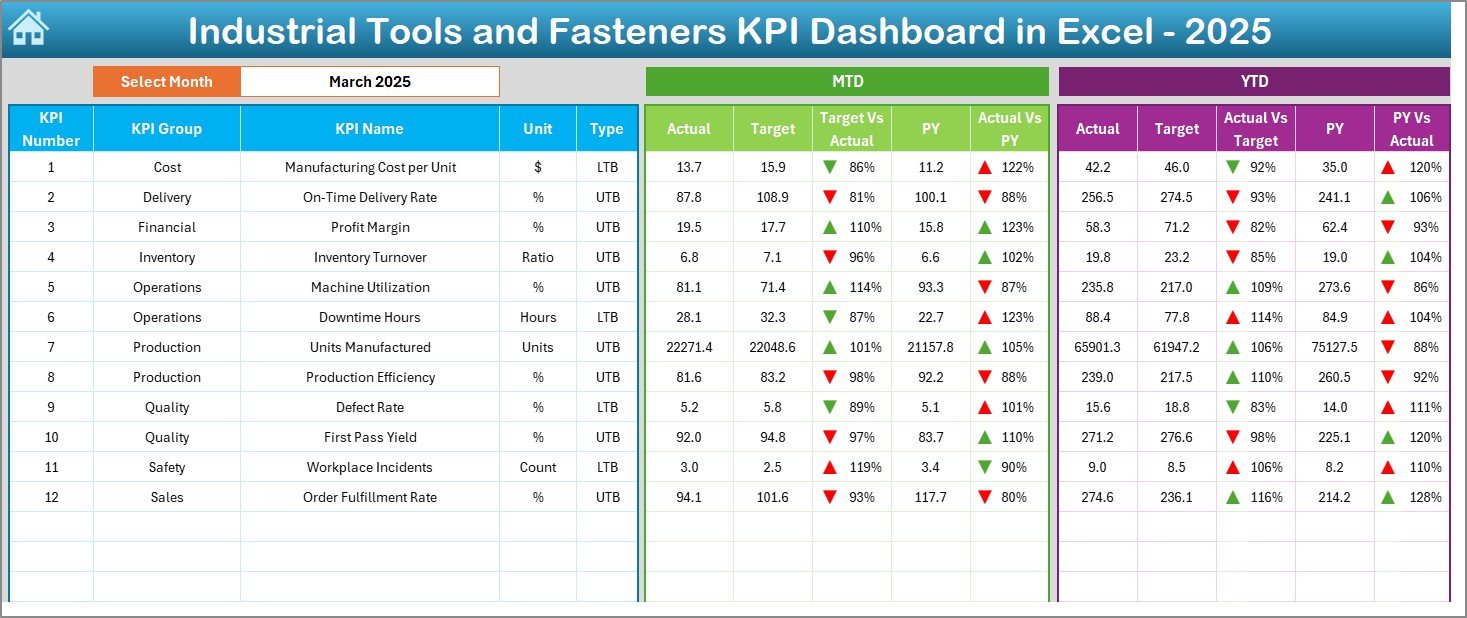
Dashboard Sheet – Main Performance Overview
The Dashboard sheet serves as the core of the system. Here, users can view all KPI performance metrics in one place.
Main Functionalities
- Month selection dropdown at cell D3
- Automatic dashboard updates based on selected month
- MTD (Month-To-Date) analysis
- YTD (Year-To-Date) analysis
- Previous Year comparison
KPI Metrics Displayed
- MTD Actual vs Target
- MTD Actual vs Previous Year
- YTD Actual vs Target
- YTD Actual vs Previous Year
Additionally, conditional formatting arrows instantly show performance direction:
- Improvement
- Decline
Therefore, managers can understand performance within seconds without reviewing detailed numbers.
Click to buy Industrial Tools and Fasteners KPI Dashboard in Excel
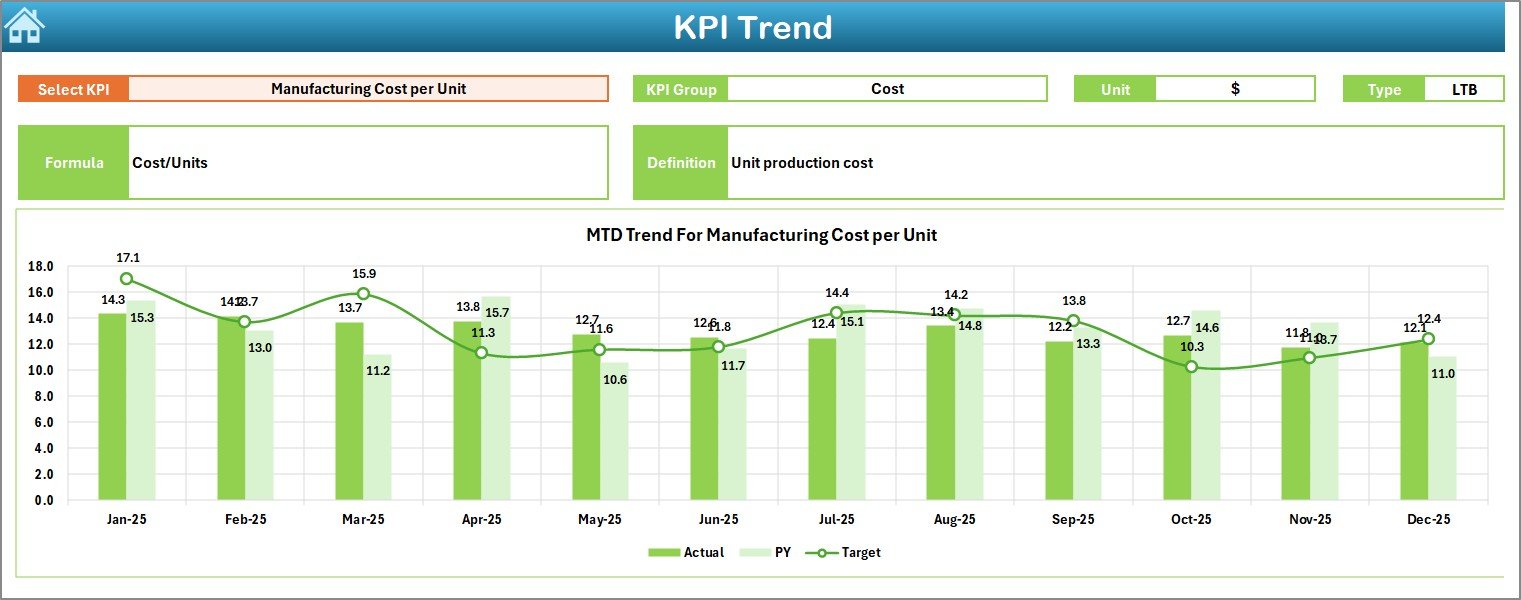
Trend Sheet – KPI Performance Analysis
The Trend Sheet provides deeper KPI insights through historical analysis.
Users can select a KPI using a dropdown at cell C3. Once selected, the dashboard displays:
- KPI Group
- KPI Unit
- KPI Type (Lower the Better / Upper the Better)
- KPI Formula
- KPI Definition
Moreover, dynamic charts display:
- MTD trends
- YTD trends
- Actual vs Target vs Previous Year comparisons
As a result, organizations can identify patterns and forecast performance more accurately.
Click to buy Industrial Tools and Fasteners KPI Dashboard in Excel
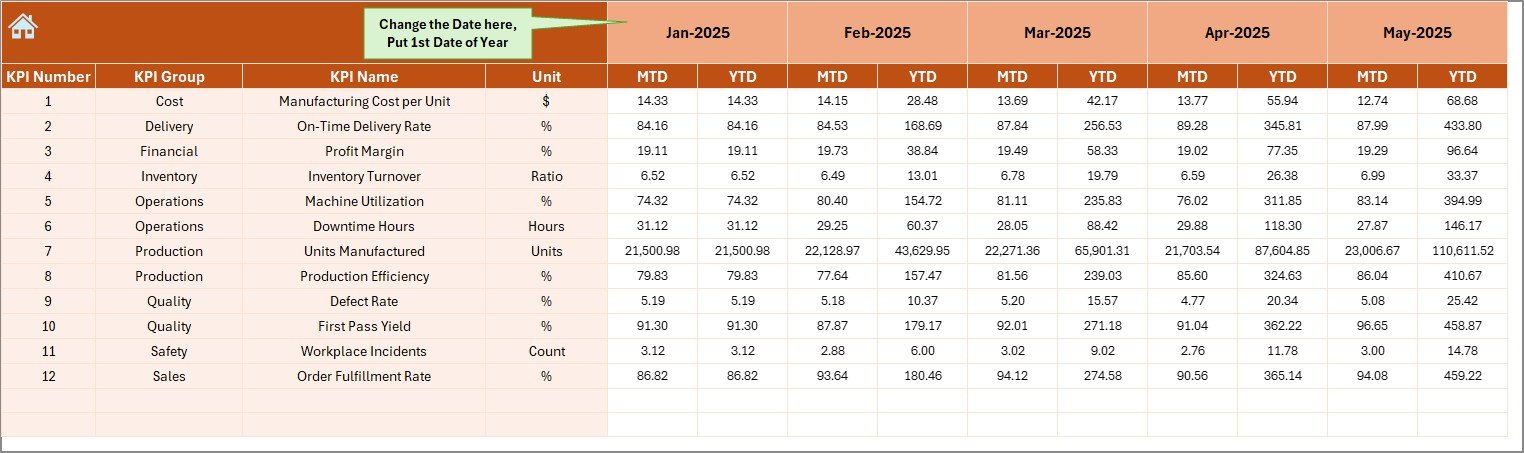
Actual Numbers Input Sheet – Data Entry Area
This worksheet allows users to enter actual performance data.
Key Features:
- Monthly data input system
- YTD and MTD value entry
- Adjustable starting month (Cell E1)
Once users enter data, the entire dashboard updates automatically. Therefore, reporting becomes faster and error-free.
Click to buy Industrial Tools and Fasteners KPI Dashboard in Excel
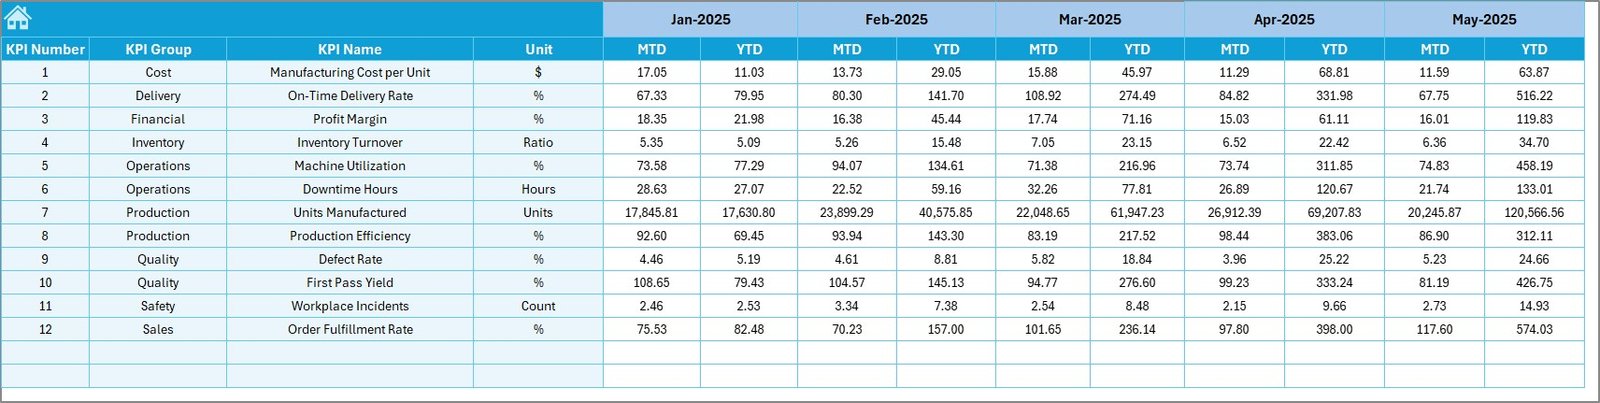
Target Sheet – Goal Management
The Target Sheet stores performance expectations.
Users enter:
- Monthly targets
- MTD targets
- YTD targets
Because targets remain centralized, performance comparisons become consistent and reliable.
Click to buy Industrial Tools and Fasteners KPI Dashboard in Excel
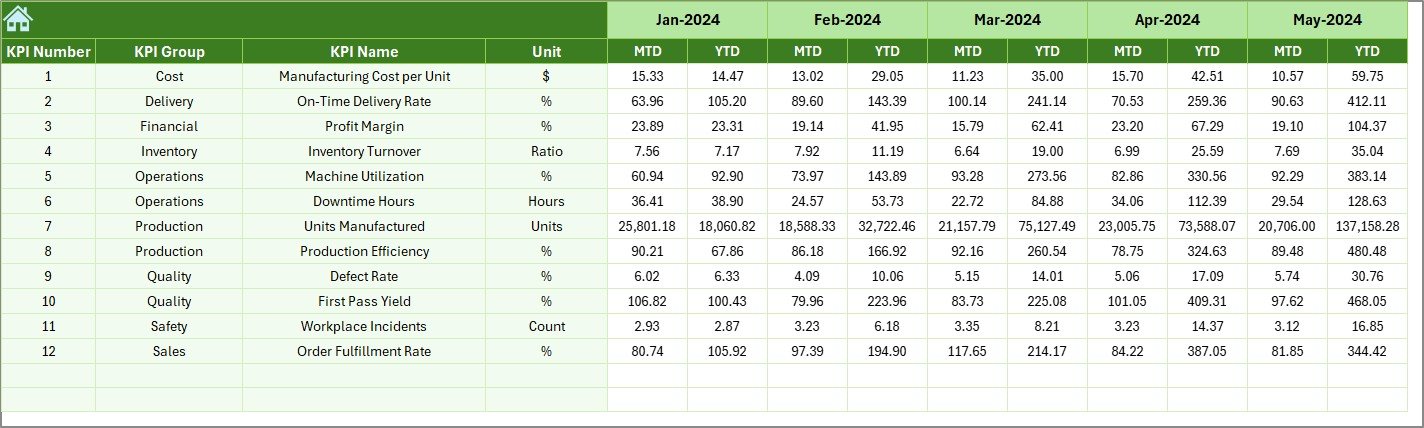
Previous Year Numbers Sheet – Historical Benchmarking
This sheet stores last year’s performance data.
Benefits include:
- Year-over-year comparison
- Performance benchmarking
- Growth measurement
Consequently, organizations understand whether improvements truly occur.
Click to buy Industrial Tools and Fasteners KPI Dashboard in Excel
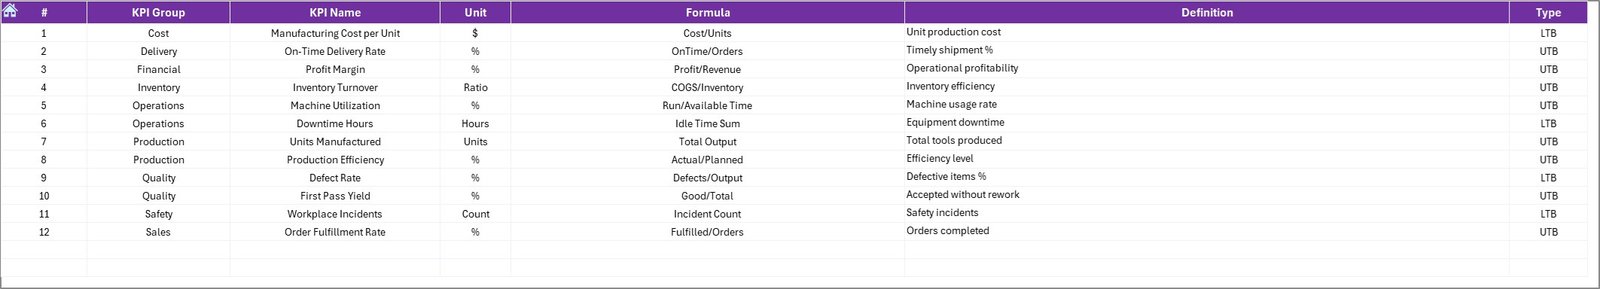
KPI Definition Sheet – KPI Documentation
The KPI Definition Sheet acts as a knowledge base.
Users define:
- KPI Name
- KPI Group
- Unit of Measurement
- Formula
- KPI Definition
This structure ensures clarity across departments and eliminates confusion about KPI calculations.
Click to buy Industrial Tools and Fasteners KPI Dashboard in Excel
What KPIs Can Be Tracked in Industrial Tools and Fasteners Manufacturing?
A well-designed KPI dashboard can monitor multiple operational areas.
Production KPIs
- Production Output
- Machine Utilization
- Cycle Time
- Overall Equipment Effectiveness (OEE)
Quality KPIs
- Defect Rate
- Rejection Percentage
- Rework Ratio
Delivery KPIs
- On-Time Delivery Rate
- Order Fulfillment Time
Cost KPIs
- Manufacturing Cost per Unit
- Material Waste Percentage
Safety KPIs
- Incident Frequency Rate
- Safety Compliance Score
Because these KPIs connect directly to operational performance, managers can improve efficiency continuously.
Advantages of Industrial Tools and Fasteners KPI Dashboard in Excel
Implementing this dashboard provides several operational benefits.
Centralized Performance Monitoring
- View all KPIs in one place
- Reduce dependency on multiple reports
- Improve visibility instantly
Faster Decision Making
- Real-time comparisons
- Visual indicators simplify analysis
- Quick identification of problem areas
Improved Productivity
- Automated calculations reduce manual work
- Teams focus on improvement rather than reporting
Better Strategic Planning
- Historical comparisons guide planning
- Trends support forecasting
Easy Implementation
- Built entirely in Excel
- No advanced software required
- Minimal training needed
How Does the Dashboard Improve Operational Efficiency?
The dashboard enhances efficiency through structured data flow.
First, teams input monthly numbers. Next, Excel formulas calculate KPIs automatically. Then, charts and indicators visualize results instantly.
Because of this workflow:
- Reporting time decreases
- Errors reduce significantly
- Management gains immediate insights
Therefore, operational performance improves consistently.
How to Implement the Industrial Tools and Fasteners KPI Dashboard?
Step 1: Define KPIs
Select KPIs aligned with production goals.
Step 2: Populate KPI Definition Sheet
Enter formulas and KPI descriptions.
Step 3: Input Targets
Add monthly targets in the Target Sheet.
Step 4: Enter Actual Data
Update actual numbers monthly.
Step 5: Add Previous Year Data
Input historical numbers for comparison.
Step 6: Analyze Dashboard
Select month and review performance visuals.
Following these steps ensures successful implementation.
Best Practices for the Industrial Tools and Fasteners KPI Dashboard
To maximize dashboard value, organizations should follow best practices.
Define Clear KPIs
Choose measurable and relevant metrics.
Update Data Regularly
Maintain monthly updates for accurate reporting.
Standardize Data Entry
Use consistent units and formats.
Review Trends Frequently
Analyze trends instead of only monthly values.
Train Team Members
Ensure users understand KPI meanings.
Focus on Actionable Insights
Use dashboard results to drive improvement actions.
When teams follow these practices, dashboard effectiveness increases significantly.
Common Challenges and How to Overcome Them
Challenge 1: Incorrect Data Entry
Solution: Use validation rules and structured templates.
Challenge 2: Too Many KPIs
Solution: Focus on critical performance indicators.
Challenge 3: Lack of KPI Understanding
Solution: Maintain clear KPI definitions.
Challenge 4: Irregular Updates
Solution: Assign dashboard ownership.
By addressing these issues early, organizations maintain reliable reporting systems.
Why Excel Remains a Powerful KPI Dashboard Tool
Although many BI tools exist, Excel continues to dominate business analytics.
Reasons include:
- Familiar interface
- Flexible customization
- Low implementation cost
- Easy sharing
- Strong formula capabilities
Additionally, Excel dashboards work well for small and medium manufacturing companies that need affordable analytics solutions.
Who Can Benefit from This Dashboard?
This KPI dashboard serves multiple roles:
- Production Managers
- Plant Supervisors
- Quality Engineers
- Operations Heads
- Supply Chain Managers
- Business Owners
Because each stakeholder views the same data, collaboration improves across departments.
Future Scope of KPI Dashboards in Manufacturing
Manufacturing analytics continues evolving rapidly. Companies increasingly integrate dashboards with automation systems and ERP platforms.
Future enhancements may include:
- Real-time IoT integration
- Predictive analytics
- Automated alerts
- AI-based performance forecasting
Therefore, adopting KPI dashboards today prepares organizations for data-driven manufacturing tomorrow.
Conclusion
The Industrial Tools and Fasteners KPI Dashboard in Excel provides a structured and practical solution for monitoring manufacturing performance. Instead of managing disconnected spreadsheets, organizations can centralize KPIs, analyze trends, and compare targets efficiently.
Moreover, the dashboard simplifies reporting while improving decision-making speed. Because it combines automation, visualization, and structured KPI management, it helps manufacturing teams improve productivity, quality, and profitability.
Ultimately, organizations that adopt KPI dashboards gain stronger operational control and achieve continuous improvement.
Frequently Asked Questions (FAQs)
- What is a KPI dashboard in manufacturing?
A KPI dashboard tracks key performance indicators using charts and metrics to monitor operational performance and support decision-making.
- Why use Excel for KPI dashboards?
Excel offers flexibility, affordability, and ease of use while supporting automation and visualization features.
- Can beginners use this dashboard?
Yes. The dashboard uses structured sheets and dropdown selections, making it beginner-friendly.
- How often should KPI data be updated?
Organizations should update KPI data monthly or weekly depending on operational needs.
- What type of KPIs work best for fastener manufacturing?
Production efficiency, defect rate, delivery performance, cost control, and machine utilization KPIs work best.
- Does the dashboard support yearly comparisons?
Yes. It includes previous year data comparison for performance benchmarking.
- Can the dashboard be customized?
Absolutely. Users can add or modify KPIs based on business requirements.
Visit our YouTube channel to learn step-by-step video tutorials
Watch the step-by-step video tutorial:
Click to buy Industrial Tools and Fasteners KPI Dashboard in Excel