Managing a product development team in the fast-moving tech world requires more than just coding sprints and coffee-fueled brainstorms. You need clear performance visibility across all development stages—and that’s exactly where a KPI Dashboard becomes a game-changer.
In this article, you’ll learn everything about the IT and Tech Product Development KPI Dashboard in Excel, from its core structure to best practices, advantages, and answers to the most asked questions.
Click to Purchases IT and Tech Product Development KPI Dashboard in Excel
What Is an IT and Tech Product Development KPI Dashboard?
An IT and Tech Product Development KPI Dashboard is a visual, interactive reporting tool built in Excel to track key performance indicators across your product development lifecycle.
Whether you’re building a mobile app, rolling out SaaS features, or maintaining legacy systems, this dashboard helps you stay aligned with your goals. It provides real-time insights into metrics like release velocity, on-time delivery, budget adherence, bug fix cycles, and more.
Structure of the KPI Dashboard: A Quick Overview
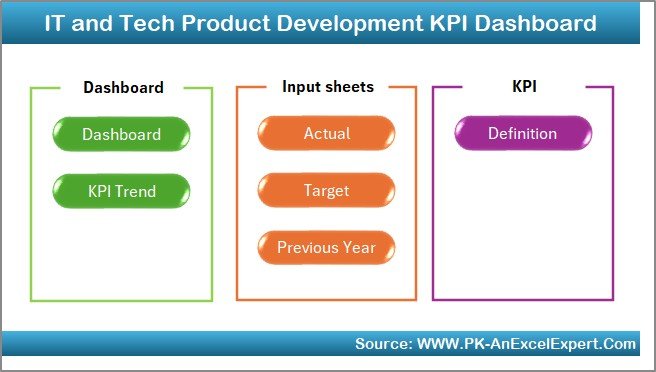
The dashboard contains 7 carefully crafted worksheets, each serving a distinct purpose:
Home Sheet – Your Central Hub
-
Navigation-friendly index with six buttons that take you directly to other sheets.
-
Clean layout for effortless use by developers, analysts, and project managers.
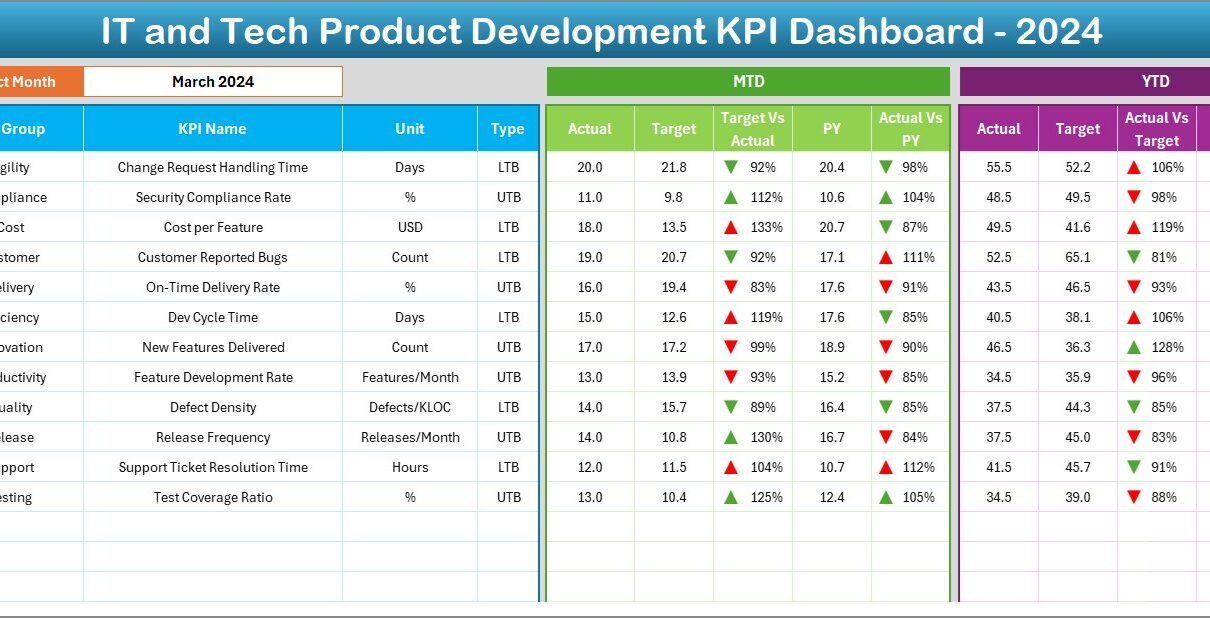
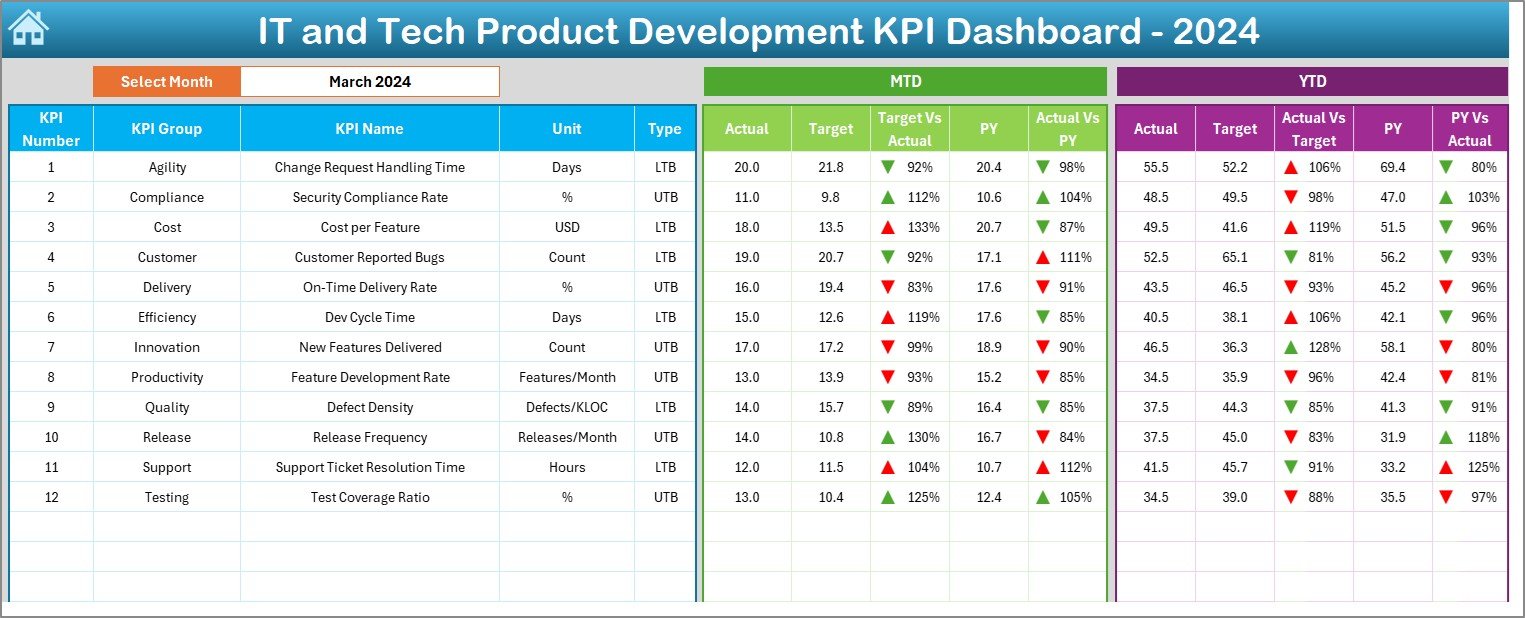
Dashboard Sheet – Visualizing Monthly KPIs
-
Dropdown to select a specific month (D3).
-
Displays MTD (Month-to-Date) and YTD (Year-to-Date) Actuals, Targets, and Previous Year (PY) numbers.
-
Conditional formatting using up/down arrows to show trends and performance comparisons.
-
Visually appealing, auto-updating indicators make it easier to spot performance gaps.
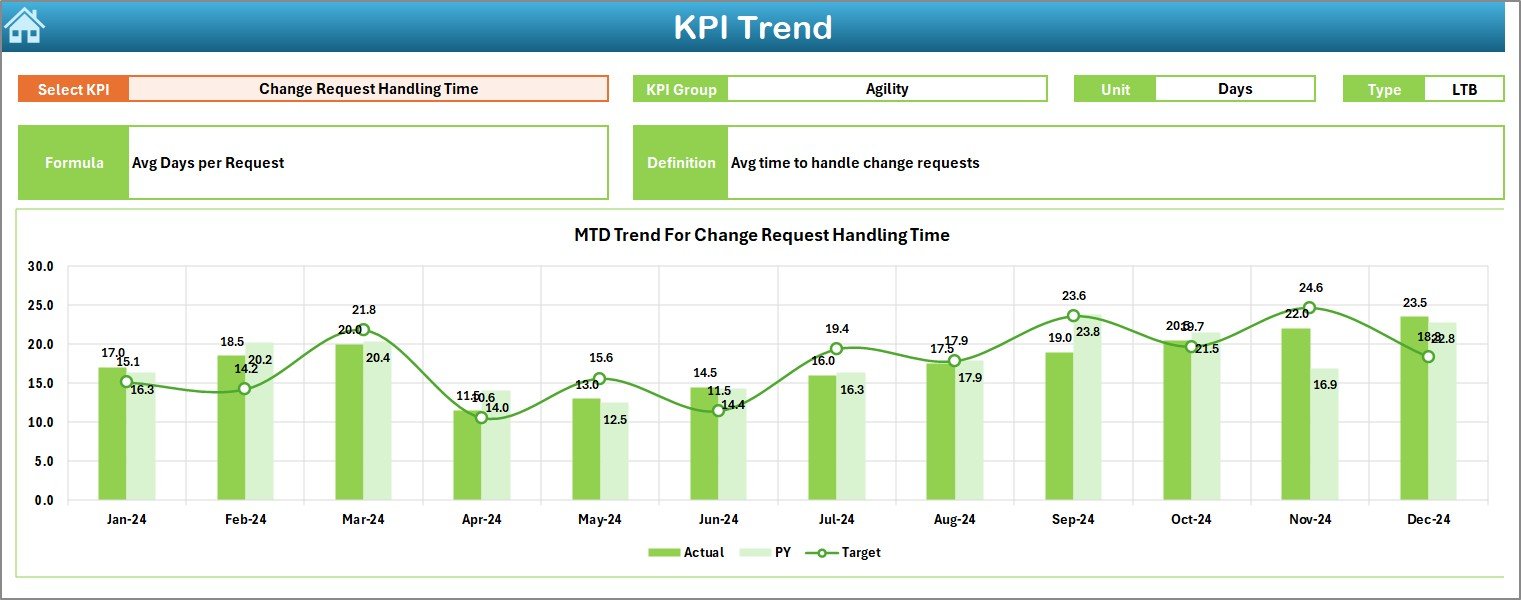
KPI Trend Sheet – Tracking Progress Over Time
-
Select any KPI from the dropdown (cell C3) to see trends.
-
Shows KPI Group, Unit, KPI Type (LTB or UTB), Formula, and Definition.
-
MTD and YTD trend charts help compare Actuals, Targets, and PY data.
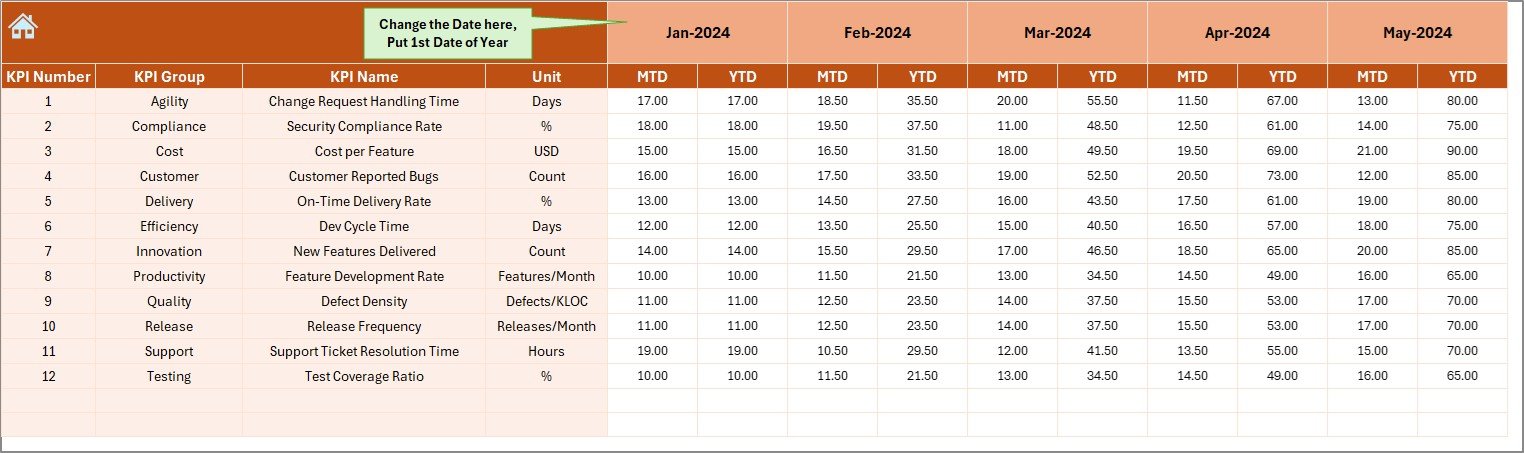
Actual Numbers Input Sheet – Real Data Entry
Click to Purchases IT and Tech Product Development KPI Dashboard in Excel
-
Enter your actual KPI values for MTD and YTD.
-
Update the base month in cell E1 to align yearly calculations.
-
Ensures your dashboard reflects real-time performance.
Target Sheet – Define Monthly Goals

-
Input monthly MTD and YTD targets for each KPI.
-
Use historical data or business objectives to set meaningful benchmarks.
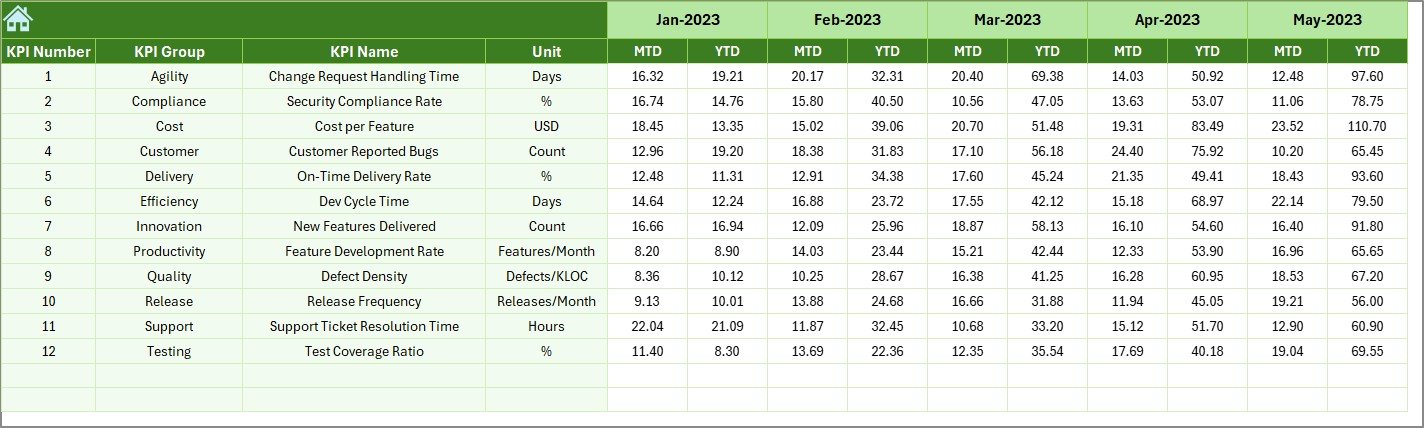
Previous Year Sheet – Learn from History
-
Enter previous year KPI data to compare with the current year.
-
Helps evaluate year-over-year growth, gaps, and improvements.
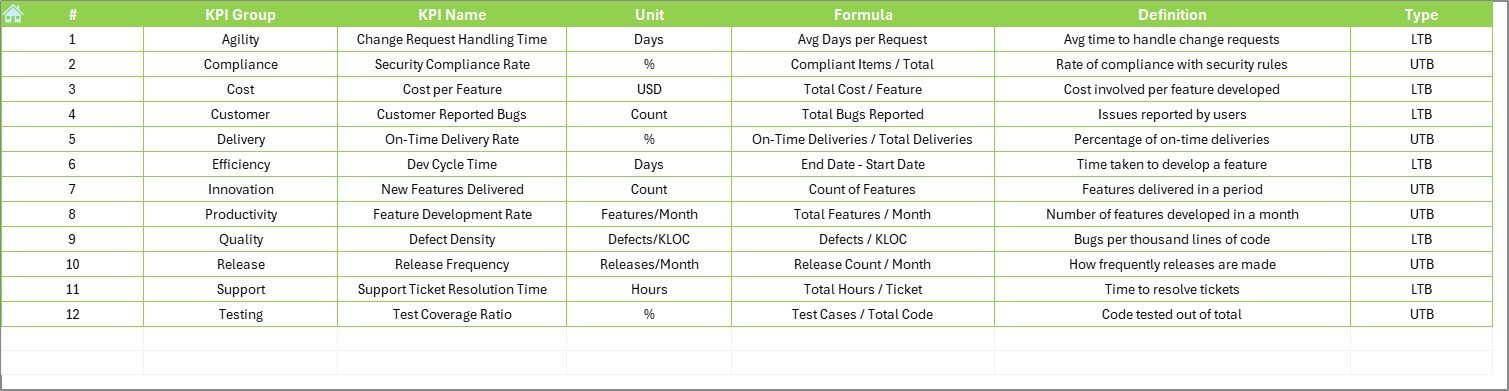
KPI Definition Sheet – Standardizing Your Metrics
-
List of KPIs with details like KPI Group, Unit, Formula, and Definitions.
-
Clarifies what each KPI measures and ensures team-wide consistency.
Why You Need a KPI Dashboard for Tech Product Development
Still wondering why this dashboard is necessary?
Let’s look at the key benefits it offers.
Advantages of the IT and Tech Product Development KPI Dashboard
🔹 Real-Time Insights: Know what’s happening now—not after the sprint ends.
🔹 Data-Driven Decisions: Make smarter decisions based on visualized performance.
🔹 Process Optimization: Identify bottlenecks and tweak strategies for faster delivery.
🔹 Performance Tracking: Monitor YTD and MTD progress against targets and benchmarks.
🔹 Stakeholder Communication: Present clean, visual updates during reviews or sprint retros.
🔹 Centralized Reporting: One source of truth for all product development KPIs.
Best Practices for Using the KPI Dashboard
To maximize the value of this Excel dashboard, here are some actionable best practices:
1. Keep the KPIs Relevant
Don’t overload your dashboard with too many metrics. Use KPIs aligned with your product development goals like:
-
Sprint Velocity
-
Deployment Frequency
-
Mean Time to Repair (MTTR)
-
Defect Leakage Rate
2. Update Monthly Without Fail
Ensure your team enters actual numbers in the Actual Input Sheet and updates the month in cell E1. This keeps your insights fresh and accurate.
3. Compare with Previous Year Metrics
Use the Previous Year Sheet to analyze performance trends and detect whether your new strategies are working.
4. Set Clear Targets
Your targets shouldn’t be arbitrary. Use historical performance, industry benchmarks, or strategic OKRs to define realistic goals in the Target Sheet.
5. Monitor Conditional Formatting
The arrows in the Dashboard sheet visually indicate performance. Keep an eye on them and act quickly when KPIs fall behind.
How to Customize This Dashboard for Your Team
The Excel template is fully customizable. Here’s how to tailor it:
-
Add or remove KPIs based on your team’s scope.
-
Rename KPI Groups like Frontend, Backend, DevOps, QA, or Security.
-
Adjust formulas to match your data models.
-
Embed slicers for filtering by project, team, or phase.
-
Link with external data sources using Power Query for automation.
Tips for Better Decision Making Using KPI Dashboards
Make the most of your dashboard insights by:
-
Holding monthly KPI reviews with your dev and QA teams.
-
Using the trend charts to spot seasonal dips or surges.
-
Identifying patterns in bug counts, resolution delays, or test failures.
-
Linking KPIs to OKRs to ensure goal alignment.
-
Automating report generation by integrating with Power Automate or Python scripts.
Integration Ideas: Making It Even Better
This dashboard works brilliantly on its own—but you can also connect it to:
-
Power BI for interactive dashboards.
-
Jira or Azure DevOps to auto-pull issue tracking data.
-
Google Sheets or Airtable for cross-functional collaboration.
-
Teams or Slack using bots to share KPI updates.
Conclusion
In today’s fast-paced tech environment, guesswork doesn’t cut it. You need real-time, actionable insights to make your product development process more agile, responsive, and successful.
The IT and Tech Product Development KPI Dashboard in Excel delivers all that and more. It’s flexible, customizable, and perfect for startups, agile squads, and IT departments alike.
Start using this template today, and transform the way you track, measure, and improve your product development performance.
Frequently Asked Questions (FAQs)
Q1: What are the most important KPIs for IT product development?
The key KPIs include sprint velocity, code coverage, defect rate, cycle time, deployment frequency, and MTTR (Mean Time to Repair).
Q2: Is Excel a good tool for KPI dashboards?
Yes! Excel is flexible, widely available, and offers powerful features like charts, formulas, and VBA for automation. It’s ideal for small-to-medium teams.
Q3: Can this dashboard be used for Agile teams?
Absolutely. The dashboard fits Agile workflows by showing short-term (MTD) and long-term (YTD) performance trends across sprints and releases.
Q4: How often should I update the KPI dashboard?
You should update it monthly at a minimum. Some teams prefer bi-weekly updates to align with sprint cycles.
Q5: Can I use this template for multiple projects?
Yes, just add columns or slicers for each project name. You can filter and analyze KPIs per project easily.
Q6: What does LTB and UTB mean in KPI Type?
-
LTB: Lower the Better (e.g., bug count, downtime)
-
UTB: Upper the Better (e.g., test pass %, velocity)
Click to Purchases IT and Tech Product Development KPI Dashboard in Excel
Visit our YouTube channel to learn step-by-step video tutorials
Watch the step-by-step video tutorial: