Measuring IT performance is essential for ensuring that technology supports business objectives effectively. The IT KPI Scorecard in Excel provides a ready-to-use solution to track, analyze, and visualize the performance of critical IT metrics.
In this article, we will explore the key features, benefits, and best practices of using this scorecard to monitor IT performance.
What Is an IT KPI Scorecard?
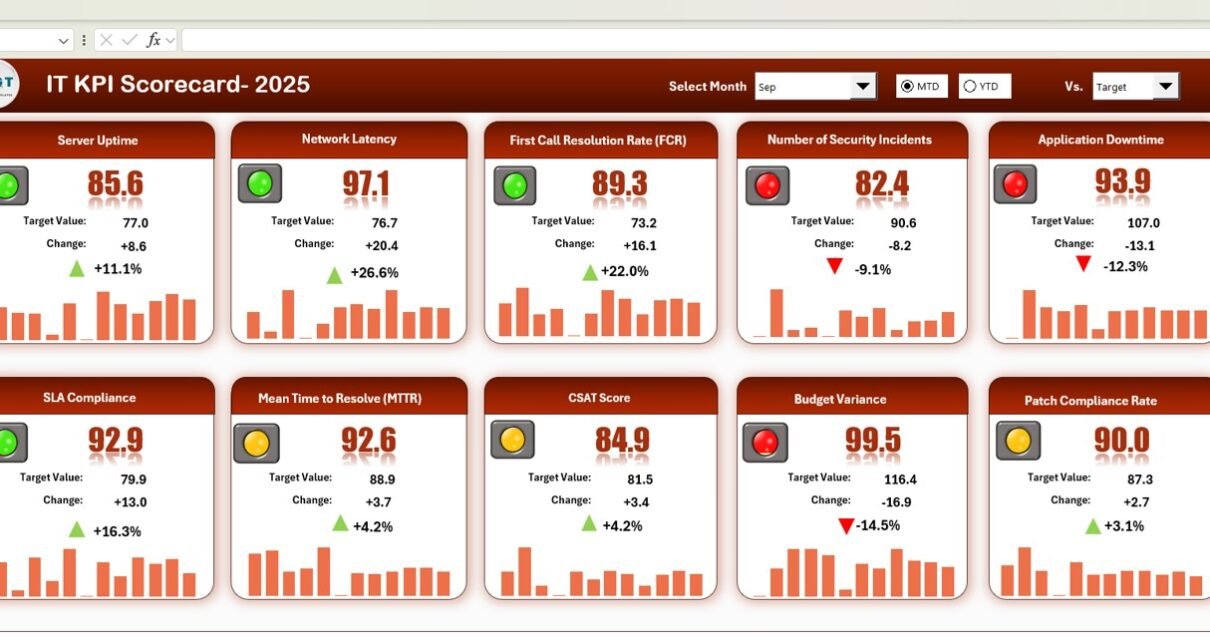
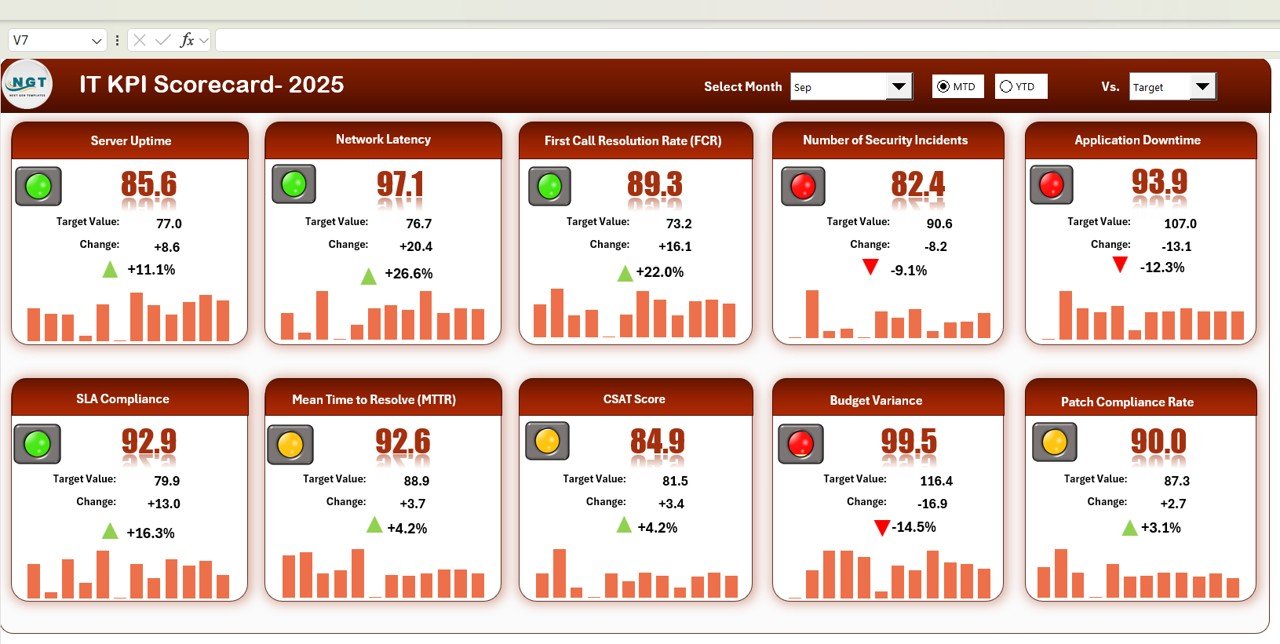
An IT KPI Scorecard is a structured Excel template that tracks multiple IT performance indicators, such as system uptime, incident resolution time, network performance, and service desk efficiency.
Using this scorecard, IT managers can:
-
Monitor monthly and yearly IT performance
-
Compare actual performance against targets
-
Identify areas for improvement
-
Make data-driven decisions to optimize IT operations
Key Features of the IT KPI Scorecard in Excel
Click to Buy IT KPI Scorecard in Excel
This scorecard is designed to provide a comprehensive view of IT performance using multiple sheets:
1. Scorecard Overview Sheet
The main scorecard displays 10 key KPIs with interactive features:
-
Month Selection Dropdown: Choose any month to view monthly data. Changing the month automatically updates all KPIs, traffic lights, and up/down arrows.
-
Traffic Lights and Arrows: Visual indicators for quick performance assessment
-
MTD & YTD Options: Click MTD to see monthly performance or YTD for yearly performance
-
KPIs Displayed: Includes system uptime, incident response time, server performance, network availability, and more
Click to Buy IT KPI Scorecard in Excel
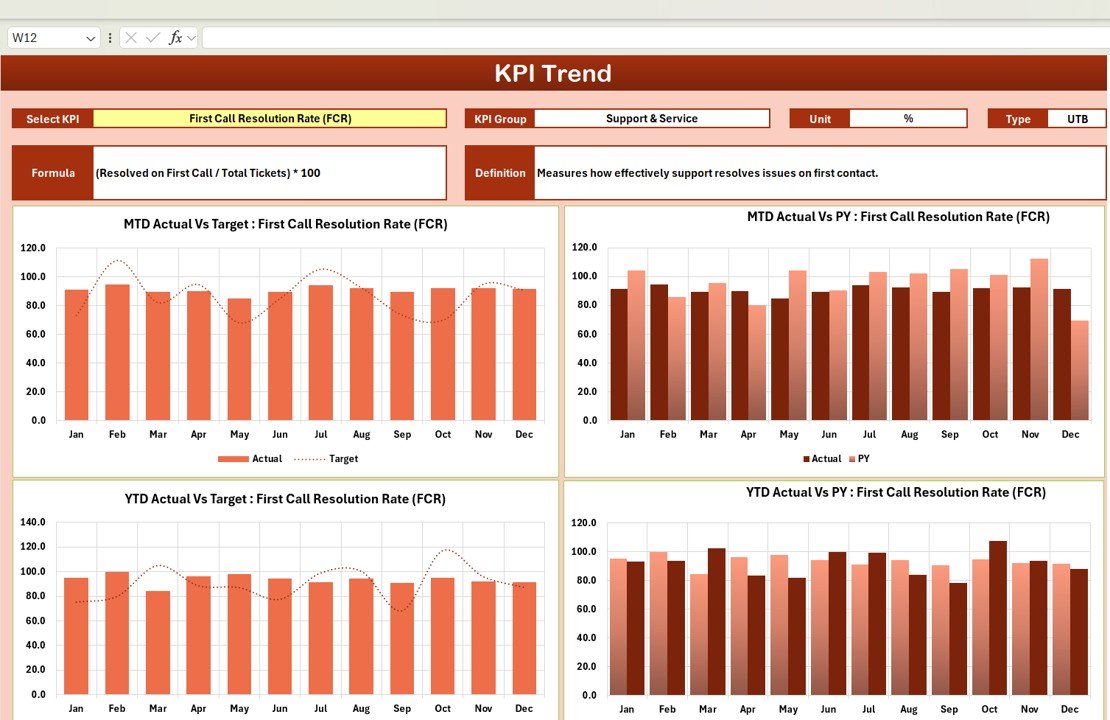
2. Trend Sheet Tab
The Trend Sheet allows you to analyze the performance of individual KPIs over time:
-
Select KPI from the dropdown in Range C3
-
View KPI Group, Unit, Type (Lower-the-Better or Upper-the-Better)
-
Analyze trends to identify patterns and performance issues
Click to Buy IT KPI Scorecard in Excel
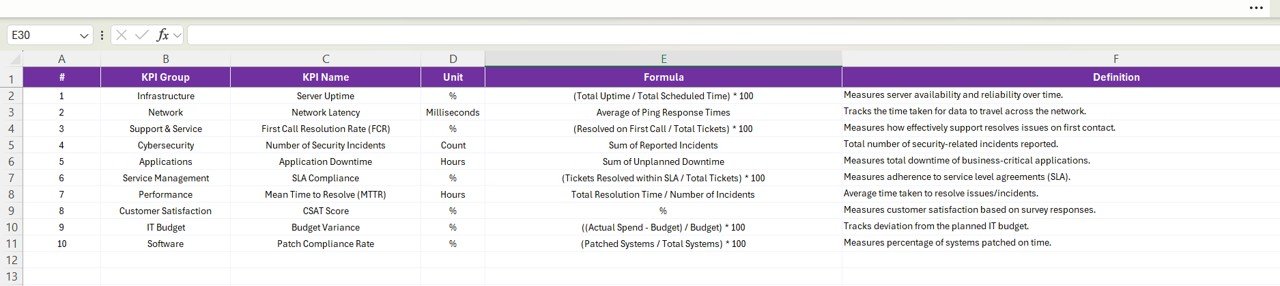
3. KPI Definition Sheet Tab
The KPI Definition Sheet is a reference guide for all KPIs:
-
Enter KPI Name, KPI Group, Unit, Formula, and Definition
-
Specify if the KPI is Lower-the-Better (LTB) or Upper-the-Better (UTB)
-
Ensures consistency and clarity when analyzing performance
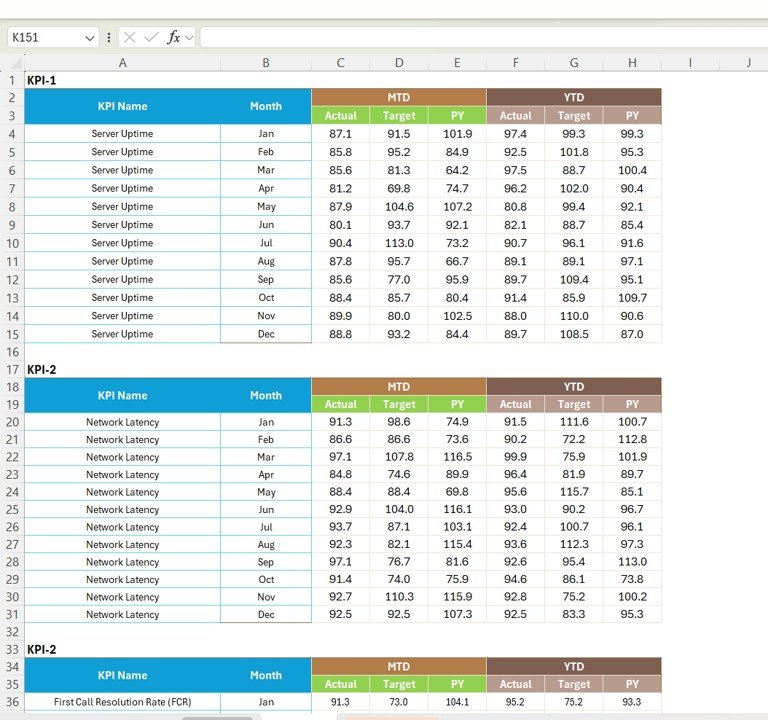
4. Data Input Sheet Tab
-
Input actual monthly or yearly performance data for each KPI
-
Updates automatically reflect on the Scorecard Overview and Trend sheets
-
Provides structured data for accurate reporting
Click to Buy IT KPI Scorecard in Excel
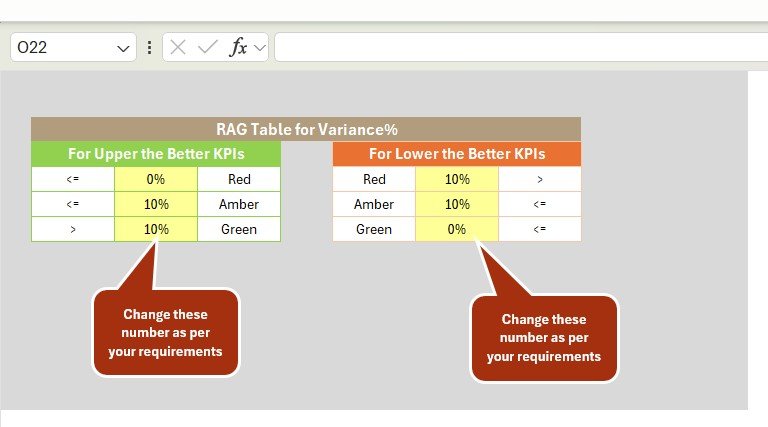
5. Color Settings Sheet
Advantages of Using the IT KPI Scorecard
Click to Buy IT KPI Scorecard in Excel
-
Centralized Performance Monitoring: Track all IT KPIs in one Excel template
-
Visual Insights: Traffic lights and arrows make it easy to interpret performance
-
Trend Analysis: Monitor KPI trends monthly or yearly
-
Data-Driven Decisions: Identify areas for improvement and optimize IT operations
-
Customizable: Adjust KPIs, formulas, and colors to match organizational needs
-
Time-Saving: Reduces manual reporting and calculation errors
Best Practices for Using the IT KPI Scorecard
-
Update Data Regularly: Input monthly and yearly IT metrics promptly
-
Monitor Critical KPIs: Focus on key IT performance indicators that impact business operations
-
Analyze Trends: Use the Trend Sheet to identify recurring issues or areas for improvement
-
Use Visual Indicators: Traffic lights and arrows help managers quickly spot underperforming KPIs
-
Maintain KPI Definitions: Keep the KPI Definition Sheet up to date to ensure clarity
-
Customize Color Settings: Align the scorecard with your organization’s reporting standards
How This Scorecard Helps IT Teams
Click to Buy IT KPI Scorecard in Excel
-
Track System Uptime: Ensure critical IT systems are operational
-
Monitor Incident Management: Measure response and resolution times for IT issues
-
Evaluate Network Performance: Identify network bottlenecks and downtime
-
Improve Service Desk Efficiency: Track tickets, response times, and satisfaction
-
Support Strategic IT Planning: Use KPI insights for decision-making and resource allocation
Frequently Asked Questions (FAQs)
Click to Buy IT KPI Scorecard in Excel
Q1: Can I add more KPIs to this scorecard?
Yes, you can add additional KPIs by updating the KPI Definition Sheet and Data Input Sheet.
Q2: How do I switch between monthly and yearly views?
Click the MTD button for monthly data or YTD for cumulative yearly performance.
Q3: Can I customize the traffic light colors?
Yes, use the Color Settings sheet to adjust traffic lights and conditional formatting colors.
Q4: Is this scorecard suitable for large IT teams?
Absolutely. The structured design can handle multiple KPIs and large datasets efficiently.
Q5: Can I track trends over multiple months?
Yes, the Trend Sheet allows you to visualize KPI performance over time for detailed analysis.
Conclusion
The IT KPI Scorecard in Excel is a powerful, ready-to-use template for monitoring IT performance. With 10 KPIs, interactive traffic lights, MTD/YTD tracking, and trend analysis, IT managers can make informed decisions, optimize operations, and improve service quality.
Visit our YouTube channel to learn step-by-step video tutorials
Watch the step-by-step video Demo:
Click to Buy IT KPI Scorecard in Excel