In today’s digital-first world, keywords drive online visibility, traffic, and conversions. Therefore, businesses must monitor keyword performance continuously to stay competitive. However, managing keyword data manually through spreadsheets quickly becomes time-consuming and error-prone. That is exactly where a Keyword Performance KPI Dashboard in Power BI becomes a game-changing solution.
This detailed and SEO-friendly guide explains what a Keyword Performance KPI Dashboard in Power BI is, why it matters, how it works, its structure, key features, advantages, best practices, and frequently asked questions. By the end of this article, you will clearly understand how this dashboard can transform your keyword tracking and SEO decision-making.
Click to Purchases Keyword Performance KPI Dashboard in Power BI
What Is a Keyword Performance KPI Dashboard in Power BI?
A Keyword Performance KPI Dashboard in Power BI is a ready-to-use business intelligence solution designed to track, analyze, and visualize keyword performance metrics in a structured and interactive way.
Instead of reviewing scattered SEO reports or manually calculating keyword metrics, this dashboard consolidates all keyword-related KPIs into one centralized Power BI report. As a result, SEO managers, digital marketers, and business owners gain instant insights into keyword trends, performance gaps, and growth opportunities.
Moreover, this dashboard uses Excel as the data source, which makes it easy to maintain, flexible to update, and simple to integrate with existing workflows.
Why Do Businesses Need a Keyword Performance KPI Dashboard?
Keyword data directly impacts organic traffic, paid campaigns, and overall digital growth. However, raw keyword data alone does not tell a complete story. Therefore, businesses need a structured system to interpret this data effectively.
Here is why a Keyword Performance KPI Dashboard in Power BI becomes essential:
-
It converts raw keyword data into actionable insights
-
It highlights target achievements and performance gaps
-
It enables quick month-to-date (MTD) and year-to-date (YTD) analysis
-
It supports data-driven SEO and marketing decisions
-
It reduces manual reporting effort significantly
As a result, teams spend less time preparing reports and more time optimizing keyword strategies.
How Does a Keyword Performance KPI Dashboard in Power BI Work?
The dashboard works on a simple yet powerful logic. First, you enter actual and target keyword data into structured Excel sheets. Then, Power BI processes this data and transforms it into interactive visuals, tables, and indicators.
Because Power BI refreshes data easily, you can update keyword performance regularly without redesigning reports. Additionally, slicers allow users to filter data by Month and KPI Group, which improves analysis flexibility.
What Is the Overall Structure of the Keyword Performance KPI Dashboard?
This dashboard includes three well-organized pages, each designed for a specific analytical purpose. Together, these pages deliver both high-level summaries and detailed insights.
Click to Purchases Keyword Performance KPI Dashboard in Power BI
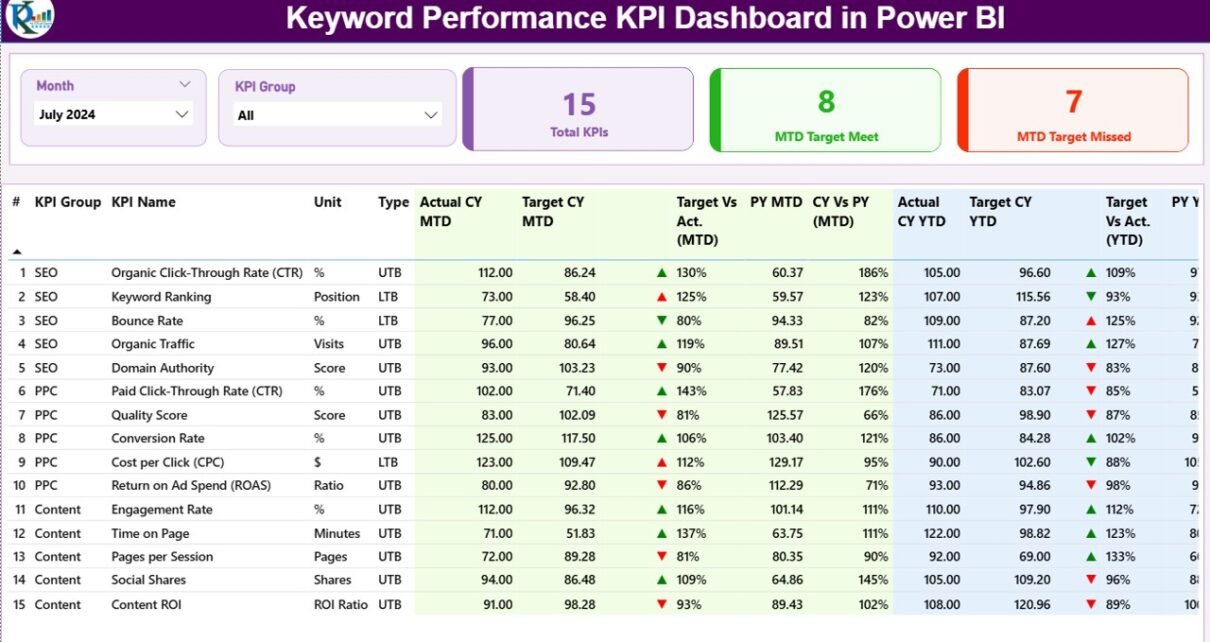
1) Summary Page: Where Do Keywords Stand Right Now?
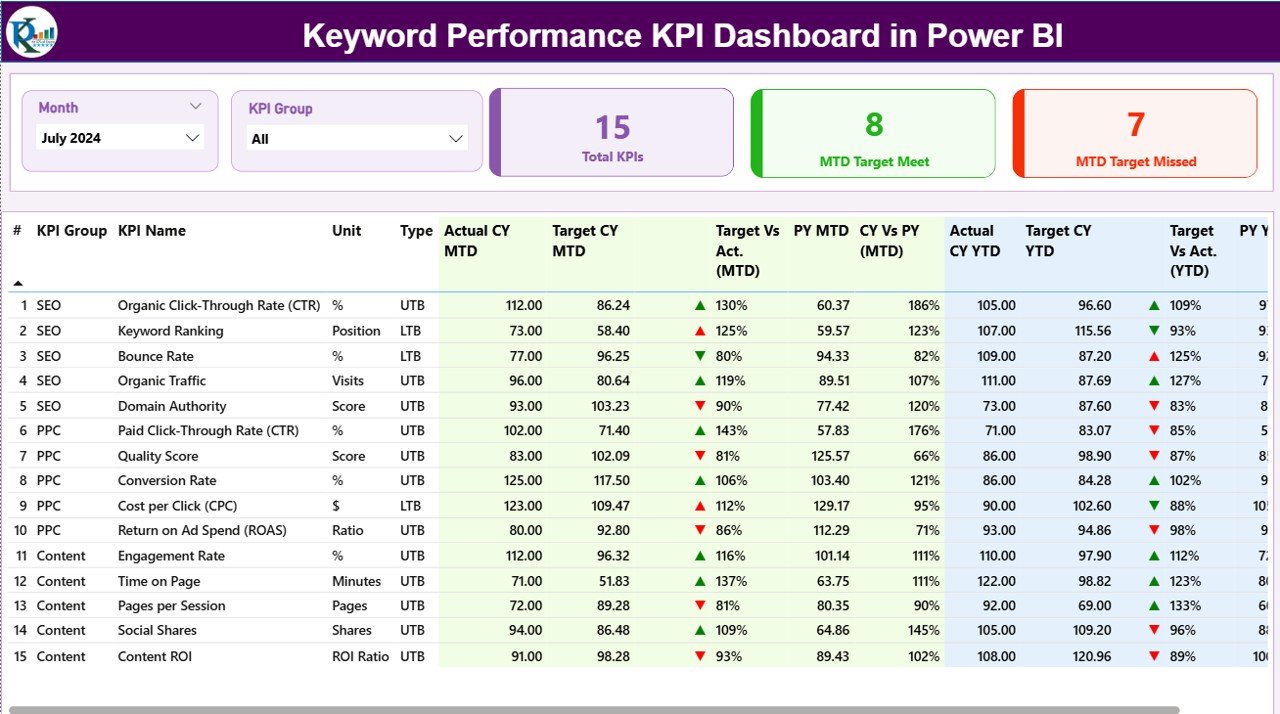
The Summary Page serves as the main landing page of the dashboard. It provides a quick overview of keyword performance across different KPIs.
Key Elements of the Summary Page
Interactive Slicers
At the top of the page, you will find:
-
Month slicer
-
KPI Group slicer
These slicers allow users to analyze keyword performance for specific time periods and categories. As a result, analysis becomes faster and more focused.
KPI Cards
The summary page includes three high-impact cards:
-
Total KPIs Count
-
MTD Target Meet Count
-
MTD Target Missed Count
These cards instantly communicate how many keyword KPIs perform well and how many need attention.
Detailed KPI Performance Table
Below the cards, the dashboard displays a detailed and dynamic KPI table. This table forms the backbone of keyword performance analysis.
Columns Explained
-
KPI Number
Displays the unique sequence number of each keyword KPI. -
KPI Group
Categorizes keywords into logical groups such as SEO, Paid Search, Brand Keywords, or Campaign-Specific Keywords. -
KPI Name
Represents the specific keyword or keyword metric being tracked. -
Unit
Defines the unit of measurement, such as clicks, impressions, rankings, or conversion rate. -
Type (LTB or UTB)
Indicates whether a KPI follows:-
LTB (Lower the Better), or
-
UTB (Upper the Better)
This classification helps interpret performance correctly.
-
MTD Performance Metrics
-
Actual CY MTD
Shows the current year’s actual month-to-date keyword performance. -
Target CY MTD
Displays the planned or target MTD value for the keyword KPI. -
MTD Icon
Uses green ▲ and red ▼ icons to visually indicate whether the keyword meets or misses its MTD target. -
Target vs Actual (MTD)
Calculates performance using the formula:
Actual MTD / Target MTD -
PY MTD
Shows the previous year’s MTD performance for the same keyword. -
CY vs PY (MTD)
Compares current year MTD with previous year MTD using:
Current Year MTD / Previous Year MTD
YTD Performance Metrics
-
Actual CY YTD
Represents the actual year-to-date keyword performance. -
Target CY YTD
Shows the target YTD value for the keyword KPI. -
YTD Icon
Uses visual indicators to highlight YTD target achievement status. -
Target vs Actual (YTD)
Calculated as:
Actual YTD / Target YTD -
PY YTD
Displays previous year YTD performance. -
CY vs PY (YTD)
Compares current YTD performance against last year using:
Current Year YTD / Previous Year YTD
Because of this structured layout, users can evaluate short-term and long-term keyword performance instantly.
2) KPI Trend Page: How Are Keywords Performing Over Time?
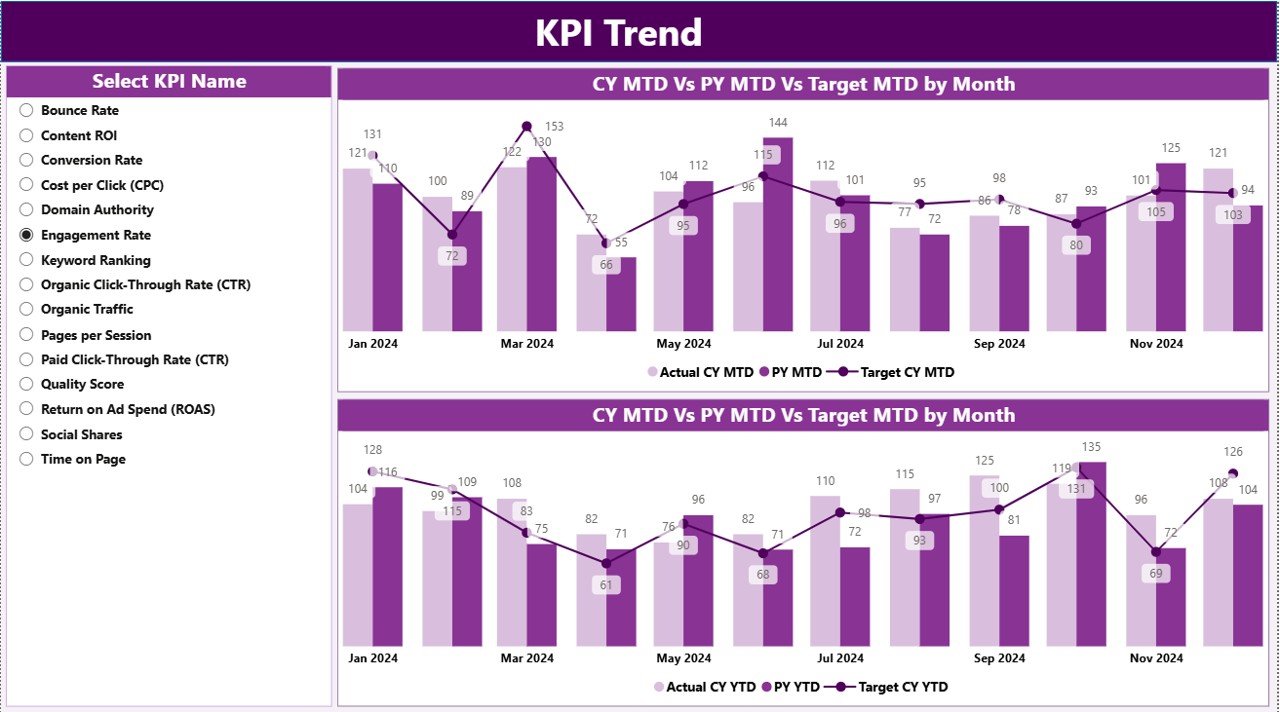
The KPI Trend Page focuses on performance trends rather than static numbers. This page helps users understand growth patterns, seasonality, and fluctuations.
Key Features of the KPI Trend Page
-
Two combo charts for:
-
MTD performance
-
YTD performance
-
-
Each chart compares:
-
Current Year Actual
-
Previous Year Actual
-
Target Values
-
-
A KPI Name slicer on the left side
Because of this design, users can analyze individual keyword trends without clutter.
Why Trend Analysis Matters
Trend analysis reveals:
-
Whether keyword performance improves consistently
-
When targets fall short
-
How performance compares year over year
Therefore, SEO teams can adjust strategies proactively rather than reactively.
3) KPI Definition Page: What Does Each Keyword KPI Mean?
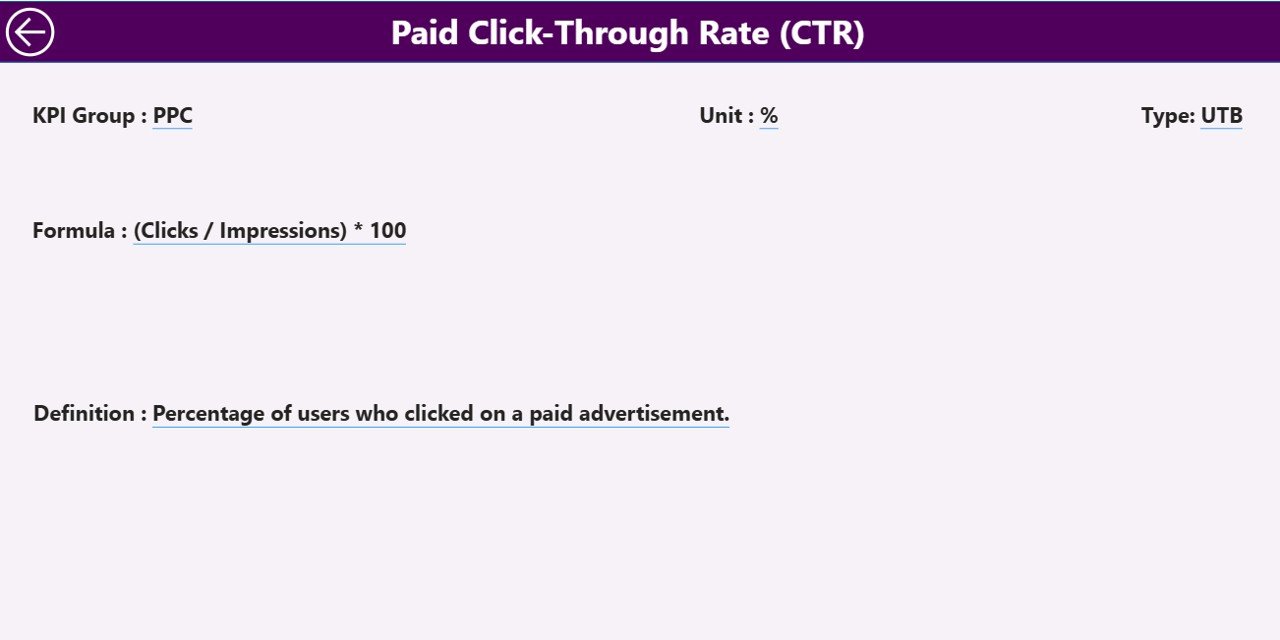
The KPI Definition Page serves as a drill-through and reference page. Although it remains hidden, users can access it directly from the Summary Page.
What Does This Page Include?
-
KPI Formula
-
KPI Definition
-
KPI Unit
-
KPI Type (LTB or UTB)
This page ensures clarity and consistency. As a result, all stakeholders understand how each keyword KPI works.
A Back Button on the top-left corner allows users to return to the Summary Page instantly.
Click to Purchases Keyword Performance KPI Dashboard in Power BI
What Is the Excel Data Structure Behind the Dashboard?
The dashboard uses Excel as its data source. This approach keeps the system simple, transparent, and easy to maintain.
1) Input_Actual Sheet
In this sheet, users enter:
-
KPI Name
-
Month (use the first date of the month)
-
MTD Actual Values
-
YTD Actual Values
2) Input_Target Sheet
In this sheet, users enter:
-
KPI Name
-
Month
-
MTD Target Values
-
YTD Target Values
3) KPI Definition Sheet
This sheet contains:
-
KPI Number
-
KPI Group
-
KPI Name
-
Unit
-
Formula
-
Definition
-
KPI Type (LTB or UTB)
Because of this clean structure, data updates remain fast and error-free.
Advantages of a Keyword Performance KPI Dashboard in Power BI
Using this dashboard delivers multiple strategic and operational benefits.
Key Advantages
-
✅ Centralized keyword performance tracking
-
✅ Real-time visibility into SEO KPIs
-
✅ Clear MTD and YTD comparisons
-
✅ Reduced manual reporting effort
-
✅ Better alignment with SEO goals
-
✅ Improved decision-making through visuals
-
✅ Easy integration with Excel data
As a result, businesses gain both speed and accuracy in keyword analysis.
How Does This Dashboard Improve SEO Decision-Making?
Because the dashboard highlights trends, gaps, and target deviations, SEO teams can:
-
Identify underperforming keywords quickly
-
Reallocate budgets efficiently
-
Adjust content strategies based on trends
-
Improve ranking and traffic outcomes consistently
Therefore, keyword optimization becomes proactive rather than reactive.
Best Practices for the Keyword Performance KPI Dashboard in Power BI
To maximize the dashboard’s value, follow these best practices:
1) Maintain Clean and Consistent Data
Always use consistent KPI names and formats in Excel. This practice avoids mapping errors.
2) Update Data Regularly
Schedule monthly updates to keep insights current and reliable.
3) Define Clear Targets
Set realistic MTD and YTD targets for meaningful performance comparison.
4) Use KPI Groups Wisely
Group keywords logically to simplify analysis and reporting.
5) Review Trends, Not Just Numbers
Focus on performance patterns instead of isolated values.
6) Train Stakeholders
Ensure teams understand KPI definitions and dashboard navigation.
Who Can Benefit from This Dashboard?
Click to Purchases Keyword Performance KPI Dashboard in Power BI
This dashboard supports a wide range of users, including:
-
SEO managers
-
Digital marketing teams
-
Content strategists
-
Performance marketing professionals
-
Business owners
-
Marketing analysts
Because of its flexibility, both small teams and large organizations can use it effectively.
Conclusion: Why Should You Use a Keyword Performance KPI Dashboard in Power BI?
A Keyword Performance KPI Dashboard in Power BI transforms keyword data into actionable insights. It combines structured Excel inputs with powerful Power BI visuals to deliver clarity, speed, and accuracy.
Instead of spending hours preparing reports, teams can focus on improving keyword rankings, increasing traffic, and achieving marketing goals. Therefore, this dashboard becomes an essential tool for any data-driven SEO strategy.
Frequently Asked Questions (FAQs)
What is a Keyword Performance KPI Dashboard in Power BI used for?
It tracks and analyzes keyword performance using KPIs, trends, targets, and year-over-year comparisons.
Can beginners use this dashboard easily?
Yes, the dashboard uses Excel for data entry and intuitive Power BI visuals for analysis.
Does the dashboard support both MTD and YTD analysis?
Yes, it includes detailed MTD and YTD metrics with target and previous-year comparisons.
Can I customize KPI groups and definitions?
Yes, you can easily modify KPI groups and definitions in the Excel file.
How often should I update the data?
Monthly updates work best, although you can refresh data more frequently if needed.
Does this dashboard replace SEO tools?
No, it complements SEO tools by consolidating and visualizing keyword performance data.
Visit our YouTube channel to learn step-by-step video tutorials