Running a landscaping business requires much more than delivering beautiful outdoor spaces. You must manage invoices, track labor hours, control costs, monitor profits, and understand customer behavior. However, when this data stays scattered across multiple Excel files, decision-making becomes slow and unclear.
That is exactly why a Landscaping Services Dashboard in Excel plays a critical role in modern landscaping operations. This ready-to-use dashboard transforms raw operational data into meaningful insights that help you take faster and smarter actions.
In this detailed guide, you will learn what a Landscaping Services Dashboard in Excel is, how it works, its sheet-wise structure, key metrics, advantages, best practices, and frequently asked questions. Moreover, this article explains how a well-designed Excel dashboard helps landscaping companies improve profitability, efficiency, and customer satisfaction.
Click to buy Landscaping Services Dashboard in Excel
What Is a Landscaping Services Dashboard in Excel?
A Landscaping Services Dashboard in Excel is a centralized performance-tracking tool designed specifically for landscaping businesses. Instead of checking multiple spreadsheets for invoices, costs, and profits, you can view everything in one interactive dashboard.
Because Excel supports formulas, charts, filters, and pivot tables, this dashboard updates automatically when you change the underlying data. As a result, you gain real-time visibility into financial performance, service efficiency, and customer trends.
Most importantly, this dashboard remains ready to use, meaning you do not need advanced Excel skills or external software to start analyzing your business.
Why Should Landscaping Businesses Use an Excel Dashboard?
Landscaping businesses handle many moving parts every day. Therefore, relying on manual reports often leads to delays and mistakes. A Landscaping Services Dashboard in Excel solves this problem by offering clarity and control.
Here is why landscaping companies prefer Excel dashboards:
- You track invoice amounts, payments, and balances in one place
- You monitor profitability by service type and customer type
- You analyze labor hours and overhead costs easily
- You identify high-performing services and lead sources
- You make faster data-driven decisions
Because of these benefits, Excel dashboards have become essential tools for landscaping service providers of all sizes.
How Does a Landscaping Services Dashboard in Excel Work?
The dashboard works by connecting structured data tables with formulas, pivot tables, and charts. Once you enter or import data, Excel calculates all KPIs automatically.
Here is how the process flows:
- You enter invoice, labor, cost, and customer data
- Excel formulas calculate totals, averages, and percentages
- Pivot tables summarize data by service, customer, or region
- Charts visualize trends and comparisons
- Filters allow you to analyze specific segments instantly
As a result, you gain a clear overview of business performance without manual calculations.
What Sheets Are Included in the Landscaping Services Dashboard in Excel?
This ready-to-use Landscaping Services Dashboard in Excel includes multiple sheet tabs, each designed for a specific type of analysis. Let us explore each sheet in detail.
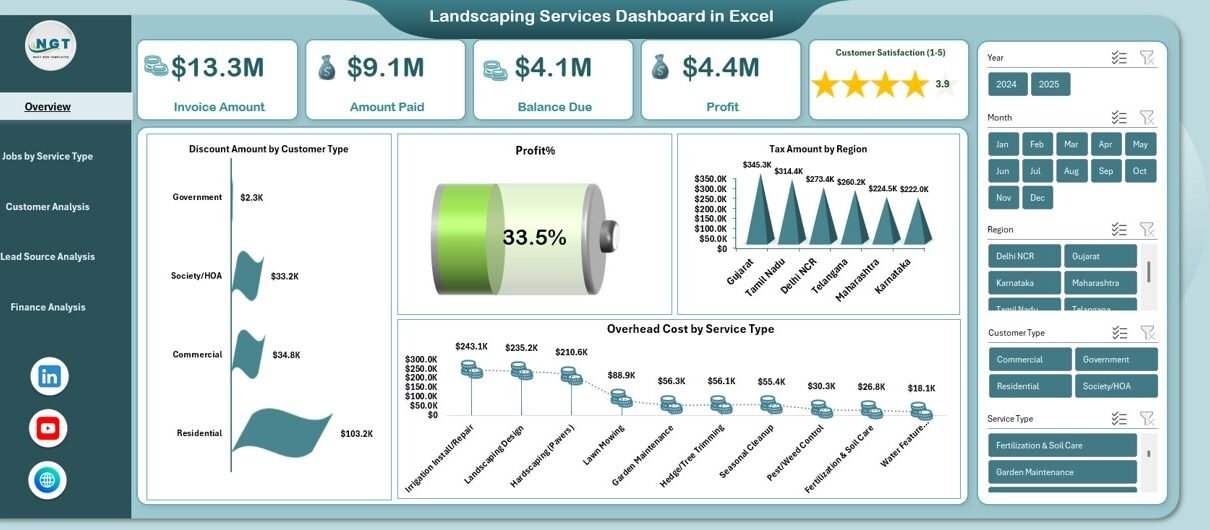
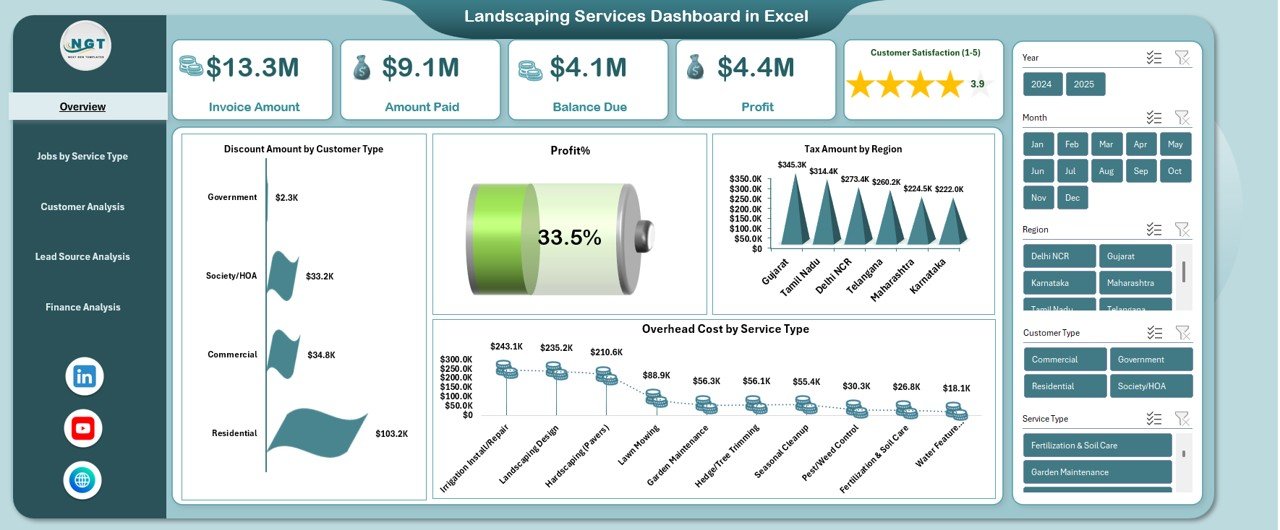
Overview Sheet Tab: What Key Metrics Can You See Instantly?
The Overview sheet serves as the main summary page of the dashboard. It highlights the most important financial and operational KPIs at a glance.
Key Metrics on the Overview Sheet
- Invoice Amount
Shows the total billed amount for landscaping services. - Amount Paid
Displays how much customers have already paid. - Balance Due
Highlights outstanding payments that require follow-up. - Profit
Calculates net earnings after costs and overheads. - Discount Amount by Customer Type
Shows how discounts vary across customer categories. - Profit %
Measures profitability as a percentage of revenue. - Tax Amount by Region
Tracks tax contributions across different regions. - Overhead Cost by Service Type
Identifies indirect costs linked to each landscaping service.
Because this page consolidates critical KPIs, managers can quickly assess overall business health.
Click to buy Landscaping Services Dashboard in Excel
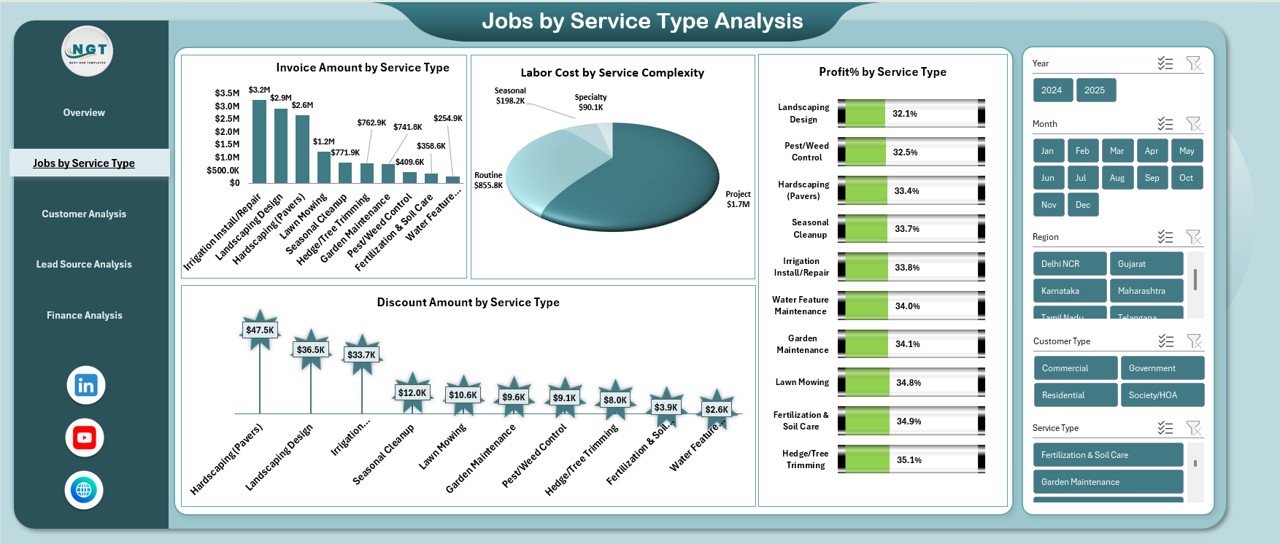
Jobs by Service Type Analysis: Which Services Perform Best?
The Jobs by Service Type Analysis sheet helps you understand how each landscaping service contributes to revenue and profit.
Metrics Included in This Sheet
- Invoice Amount by Service Type
Reveals which services generate the most revenue. - Labor Cost by Service Complexity
Shows how labor expenses increase with service difficulty. - Discount Amount by Service Type
Highlights services that receive higher discounts. - Profit % by Service Type
Helps identify high-margin and low-margin services.
Because this analysis breaks performance by service, you can optimize pricing, staffing, and marketing strategies.
Click to buy Landscaping Services Dashboard in Excel
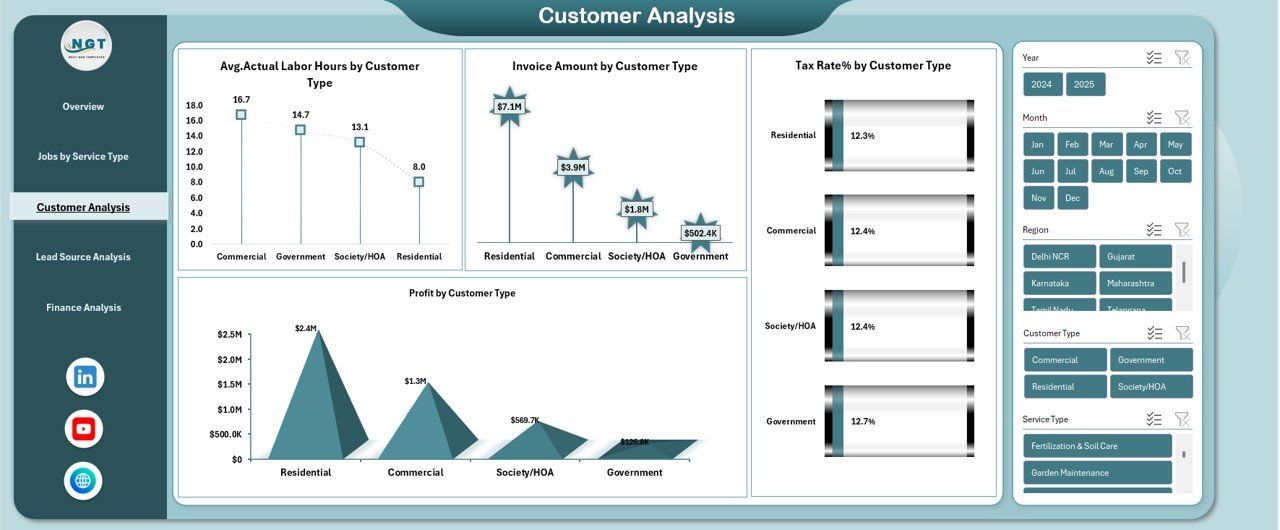
Customer Analysis Sheet: Which Customers Drive Your Profit?
Not all customers contribute equally to your business. Therefore, the Customer Analysis sheet helps you understand customer profitability and behavior.
Metrics Included in Customer Analysis
- Average Actual Labor Hours by Customer Type
Measures effort required to serve different customer segments. - Invoice Amount by Customer Type
Shows revenue contribution by customer category. - Tax Rate % by Customer Type
Helps track tax differences across customer groups. - Profit by Customer Type
Identifies the most profitable customer segments.
Because of this insight, you can focus more on high-value customers while improving efficiency for others.
Click to buy Landscaping Services Dashboard in Excel
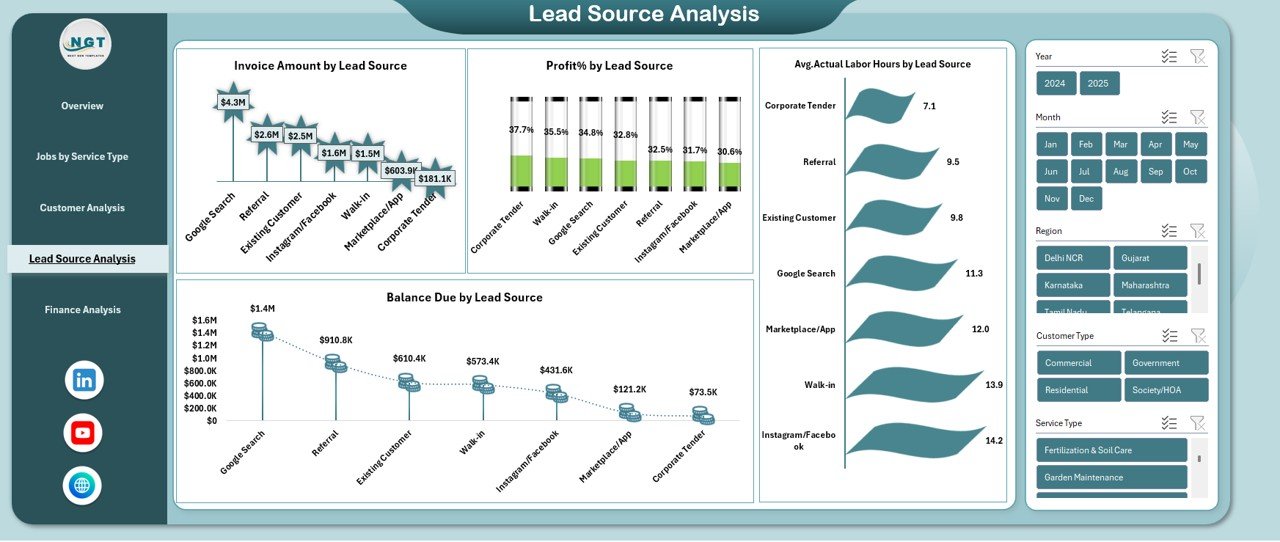
Lead Source Analysis: Where Do Your Best Clients Come From?
The Lead Source Analysis sheet evaluates how different marketing and referral channels perform.
Metrics Included in Lead Source Analysis
- Invoice Amount by Lead Source
Shows which sources generate the highest revenue. - Profit % by Lead Source
Identifies the most profitable acquisition channels. - Balance Due by Lead Source
Highlights payment risks by source. - Average Actual Labor Hours by Lead Source
Shows operational effort linked to each source.
Because of this analysis, you can invest more in lead sources that deliver high profits with lower effort.
Click to buy Landscaping Services Dashboard in Excel
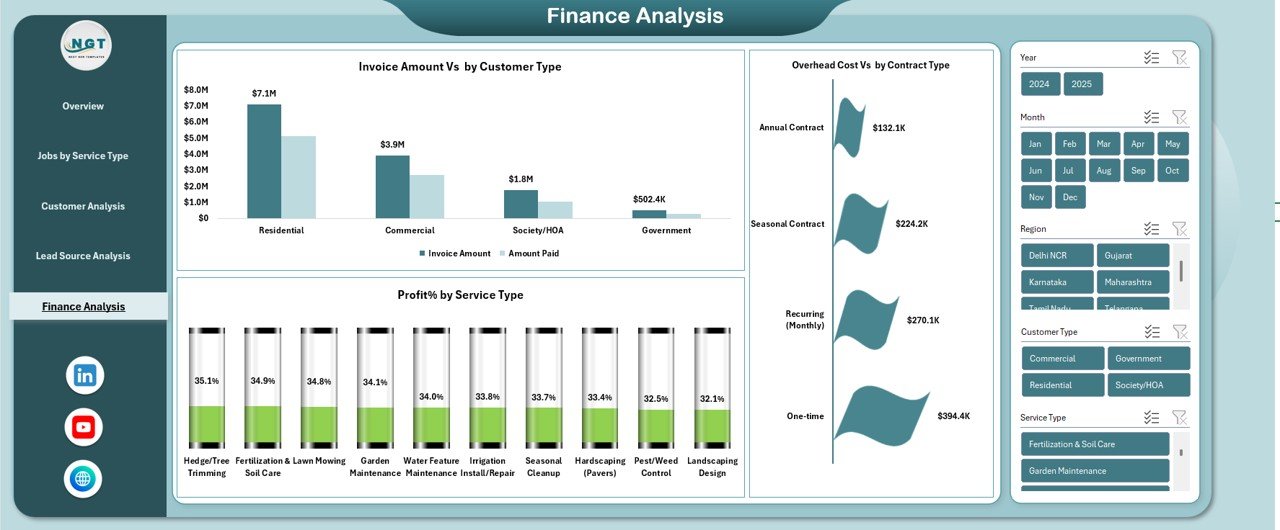
Finance Analysis Sheet: How Strong Is Your Financial Performance?
The Finance Analysis sheet focuses on deeper financial comparisons and cost control.
Metrics Included in Finance Analysis
- Invoice Amount vs Customer Type
Compares billing across customer segments. - Profit % by Service Type
Highlights services with strong or weak margins. - Overhead Cost vs Contract Type
Helps control indirect costs across contract models.
This sheet supports strategic planning and long-term financial stability.
Click to buy Landscaping Services Dashboard in Excel
How Does This Dashboard Improve Decision-Making?
A Landscaping Services Dashboard in Excel improves decision-making in several ways:
- It replaces guesswork with real data
- It highlights trends and issues early
- It simplifies complex financial information
- It supports quick corrective actions
- It improves accountability across teams
Because of these advantages, managers spend less time preparing reports and more time improving operations.
Advantages of Landscaping Services Dashboard in Excel
Why Is This Dashboard a Game-Changer?
A Landscaping Services Dashboard in Excel offers several practical advantages:
- Centralized Reporting – All KPIs stay in one place
- Real-Time Updates – Numbers update instantly with data changes
- Cost Control – Clear visibility into labor and overhead costs
- Profit Optimization – Identify high-margin services easily
- Customer Insights – Understand which customers drive value
- Lead Performance Tracking – Improve marketing ROI
- Easy Customization – Modify KPIs based on business needs
- No Extra Software Required – Works entirely in Excel
Because of these benefits, this dashboard suits both small landscaping firms and growing service providers.
Best Practices for the Landscaping Services Dashboard in Excel
How Can You Get the Most Value from This Dashboard?
Follow these best practices to maximize dashboard effectiveness:
- Maintain Clean Data
Always enter accurate and consistent data. - Update Data Regularly
Update invoices, payments, and costs frequently. - Use Standard Categories
Keep service types, customer types, and lead sources consistent. - Monitor Balance Due Weekly
Reduce cash flow issues by tracking pending payments. - Analyze Profit % Monthly
Review margins to identify improvement opportunities. - Limit Manual Overrides
Let formulas calculate values automatically. - Review Trends, Not Just Totals
Focus on patterns over time rather than single numbers.
By following these practices, you ensure accurate insights and better results.
Who Should Use a Landscaping Services Dashboard in Excel?
This dashboard suits a wide range of users:
- Landscaping business owners
- Operations managers
- Finance and accounting teams
- Project supervisors
- Small business consultants
- Franchise managers
Because Excel remains widely used, teams can adopt this dashboard quickly without additional training.
How Does This Dashboard Support Business Growth?
Growth requires clarity, consistency, and control. This dashboard supports growth by:
- Improving cost visibility
- Enhancing pricing strategies
- Strengthening customer segmentation
- Optimizing service offerings
- Supporting data-driven expansion decisions
As a result, landscaping businesses grow sustainably instead of reacting blindly.
Can You Customize the Landscaping Services Dashboard in Excel?
Yes, you can easily customize this dashboard. You can:
- Add new KPIs
- Modify service types
- Change chart formats
- Adjust formulas
- Add new analysis sheets
Because Excel offers flexibility, the dashboard adapts as your business evolves.
Conclusion: Is a Landscaping Services Dashboard in Excel Worth Using?
Absolutely. A Landscaping Services Dashboard in Excel transforms scattered data into actionable insights. It simplifies financial tracking, improves service analysis, and strengthens customer understanding.
Most importantly, it empowers landscaping businesses to make confident, data-driven decisions every day. Whether you manage a small local service or a growing landscaping firm, this dashboard provides the clarity and control you need to succeed.
Frequently Asked Questions (FAQs)
- What data do I need for a Landscaping Services Dashboard in Excel?
You need invoice data, payment details, labor hours, overhead costs, service types, customer types, and lead sources.
- Can beginners use this dashboard easily?
Yes, the dashboard remains user-friendly and ready to use, even for Excel beginners.
- Does the dashboard update automatically?
Yes, all KPIs and charts update automatically when you update the data tables.
- Can I track unpaid invoices with this dashboard?
Yes, the Balance Due metric highlights outstanding payments clearly.
- Is this dashboard suitable for small landscaping businesses?
Yes, it works perfectly for small, medium, and growing landscaping companies.
- Can I add more analysis sheets later?
Yes, Excel allows unlimited customization and expansion.
- Does this dashboard help improve profitability?
Yes, it identifies cost leaks, high-margin services, and profitable customers.
Visit our YouTube channel to learn step-by-step video tutorials
Watch the step-by-step video tutorial:
Click to buy Landscaping Services Dashboard in Excel