The landscaping industry is evolving faster than ever. Customers expect faster service, transparent pricing, and consistent quality. At the same time, landscaping business owners must manage labor, materials, taxes, discounts, and profitability across multiple services and regions. Because of this, relying on manual spreadsheets or disconnected reports no longer works.
That is exactly where a Landscaping Services Dashboard in Power BI becomes a game changer.
This detailed guide explains what a Landscaping Services Dashboard in Power BI is, why it matters, how it works, its advantages, best practices, and real-world use cases. Moreover, this article explains each dashboard page in detail so you clearly understand how to use it for smarter decisions.
Click to buy Landscaping Services Dashboard in Power BI
What Is a Landscaping Services Dashboard in Power BI?
A Landscaping Services Dashboard in Power BI is an interactive business intelligence solution that tracks and visualizes key performance metrics for landscaping companies. It converts raw operational and financial data into clear, visual insights using charts, KPIs, tables, and filters.
Instead of reviewing multiple Excel files, invoices, and job sheets, you get one centralized Power BI dashboard that shows your complete landscaping business performance in real time.
What Type of Businesses Can Use This Dashboard?
This dashboard works perfectly for:
- Residential landscaping companies
- Commercial landscaping service providers
- Lawn care and garden maintenance firms
- Hardscaping and irrigation contractors
- Seasonal landscaping businesses
- Multi-location landscaping companies
Because Power BI is flexible, the dashboard easily scales from small teams to large enterprises.
Why Do Landscaping Businesses Need a Power BI Dashboard?
Landscaping businesses deal with multiple cost drivers every day. Labor hours change by job complexity. Profit margins vary by service type. Discounts differ by customer category. Moreover, unpaid invoices affect cash flow.
Therefore, decision-making without analytics becomes risky.
A Landscaping Services Dashboard in Power BI helps you:
- Track revenue and profit clearly
- Control labor and overhead costs
- Monitor unpaid balances
- Understand customer behavior
- Analyze lead source performance
- Improve service-level profitability
As a result, you gain complete control over your operations.
How Does a Landscaping Services Dashboard in Power BI Work?
The dashboard follows a simple but powerful data flow:
- Data Collection
You capture data from invoices, jobs, labor timesheets, customer records, and contracts. - Data Modeling in Power BI
Power BI cleans, connects, and structures the data into relationships. - KPI Calculations
The dashboard calculates metrics such as invoice amount, profit, tax, discounts, labor hours, and balance due. - Interactive Visualization
Users interact with filters like service type, customer type, region, and lead source. - Actionable Insights
Managers quickly identify trends, issues, and opportunities.
Because of this workflow, the dashboard remains fast, reliable, and easy to maintain.
Key Features of the Landscaping Services Dashboard in Power BI
This dashboard includes five powerful pages, each designed for a specific business perspective.
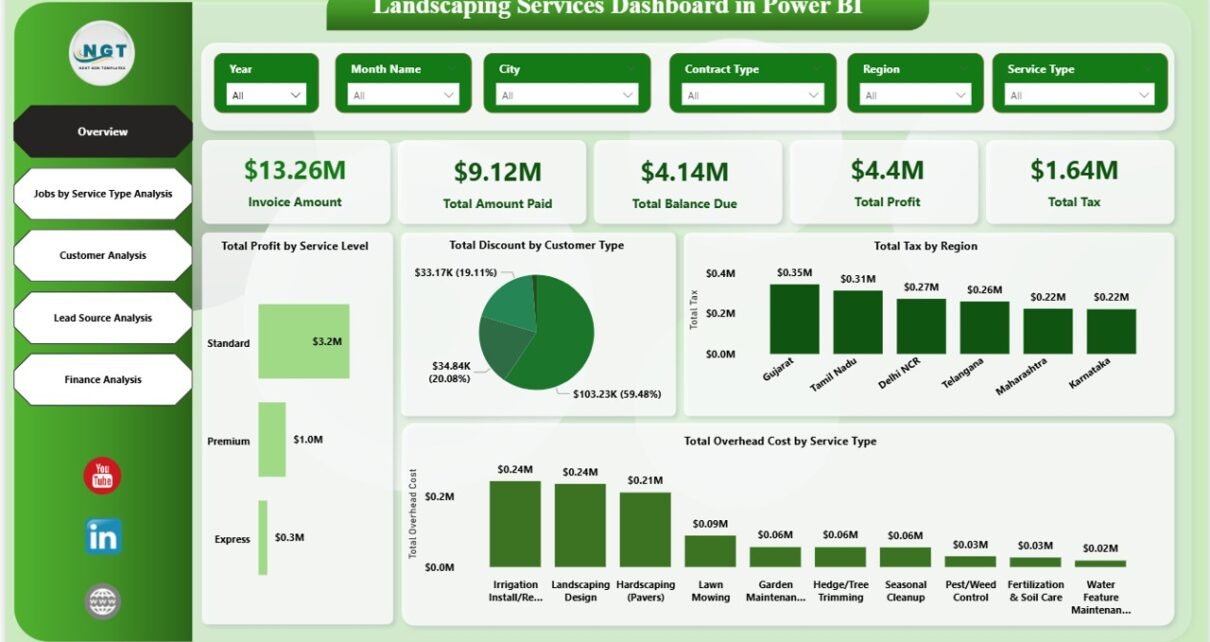
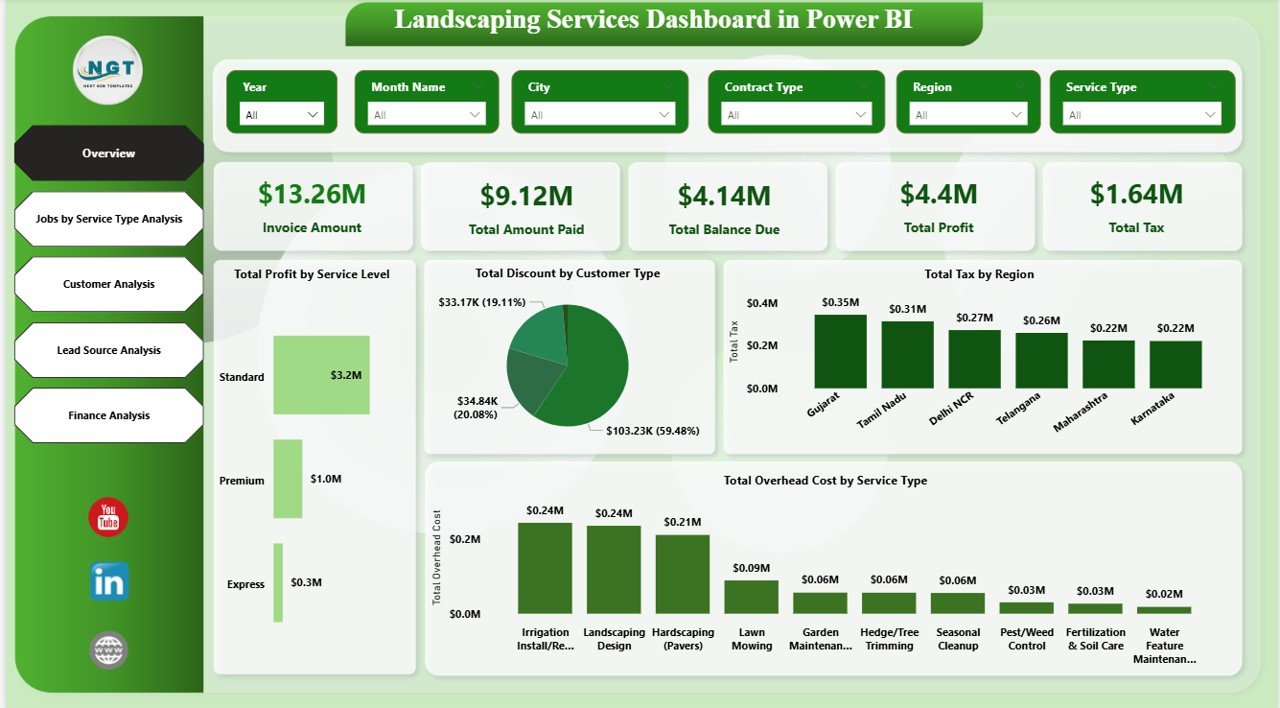
Overview Page: How Is the Business Performing at a Glance?
The Overview page provides a high-level snapshot of the entire landscaping operation. It answers the most important question: How is the business performing right now?
Key Metrics on the Overview Page
- Invoice Amount
Shows total billed revenue for selected periods. - Amount Paid
Displays how much customers have already paid. - Balance Due
Highlights outstanding receivables that need follow-up. - Profit
Shows net profit after deducting labor, overhead, tax, and discounts. - Total Tax
Tracks tax amounts collected across jobs.
Analytical Visuals on the Overview Page
- Discount Amount by Customer Type
Identifies which customer segments receive the highest discounts. - Profit by Service Type
Helps you see which services generate the most profit. - Tax Amount by Region
Supports regional tax compliance and planning. - Overhead Cost by Service Type
Reveals hidden costs that reduce margins.
Because this page summarizes everything, owners and managers use it daily.
Click to buy Landscaping Services Dashboard in Power BI
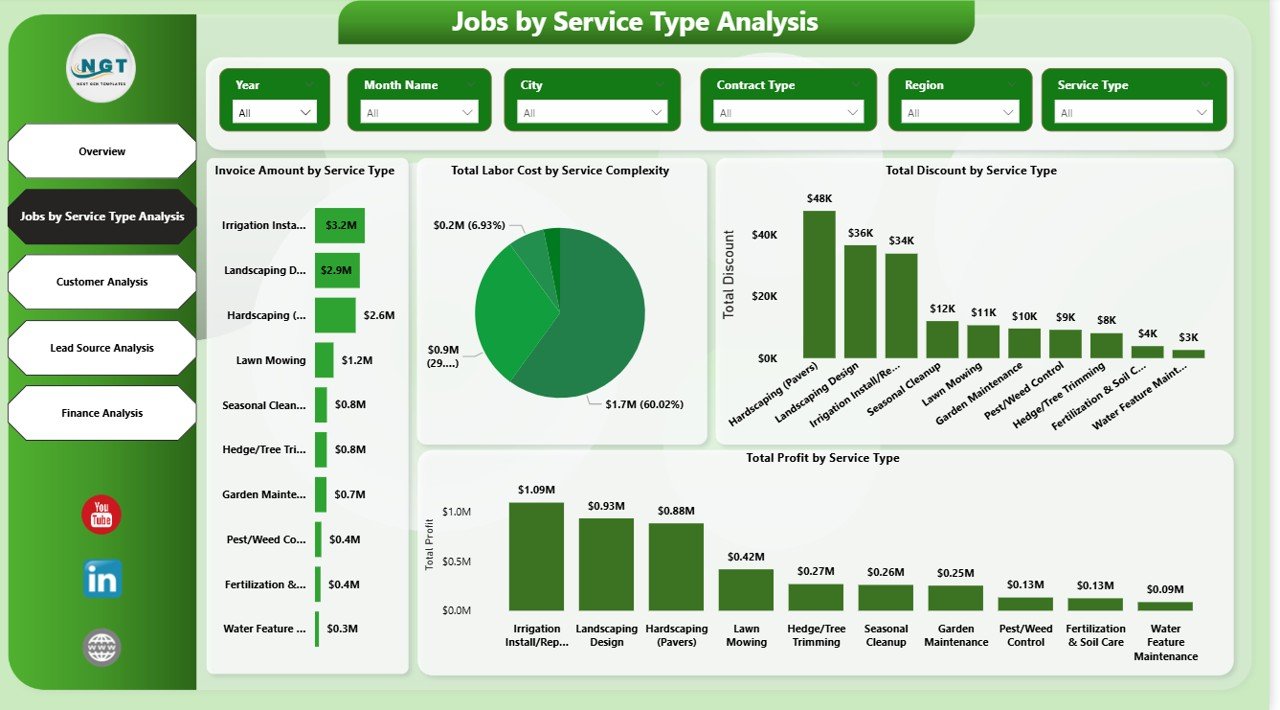
Jobs by Service Type Analysis: Which Services Drive Profit?
Different landscaping services require different skills, time, and costs. Therefore, analyzing jobs by service type becomes essential.
Metrics Included in This Page
- Invoice Amount by Service Type
Shows revenue contribution from each service. - Labor Cost by Service Complexity
Reveals how complexity impacts labor expenses. - Profit by Service Type
Helps identify high-margin and low-margin services. - Discount Amount by Service Type
Shows where pricing strategies affect profitability.
Why This Page Matters
This analysis helps you:
- Focus on high-profit services
- Optimize pricing for complex jobs
- Reduce unnecessary discounts
- Allocate skilled labor efficiently
As a result, service-level profitability improves significantly.
Click to buy Landscaping Services Dashboard in Power BI
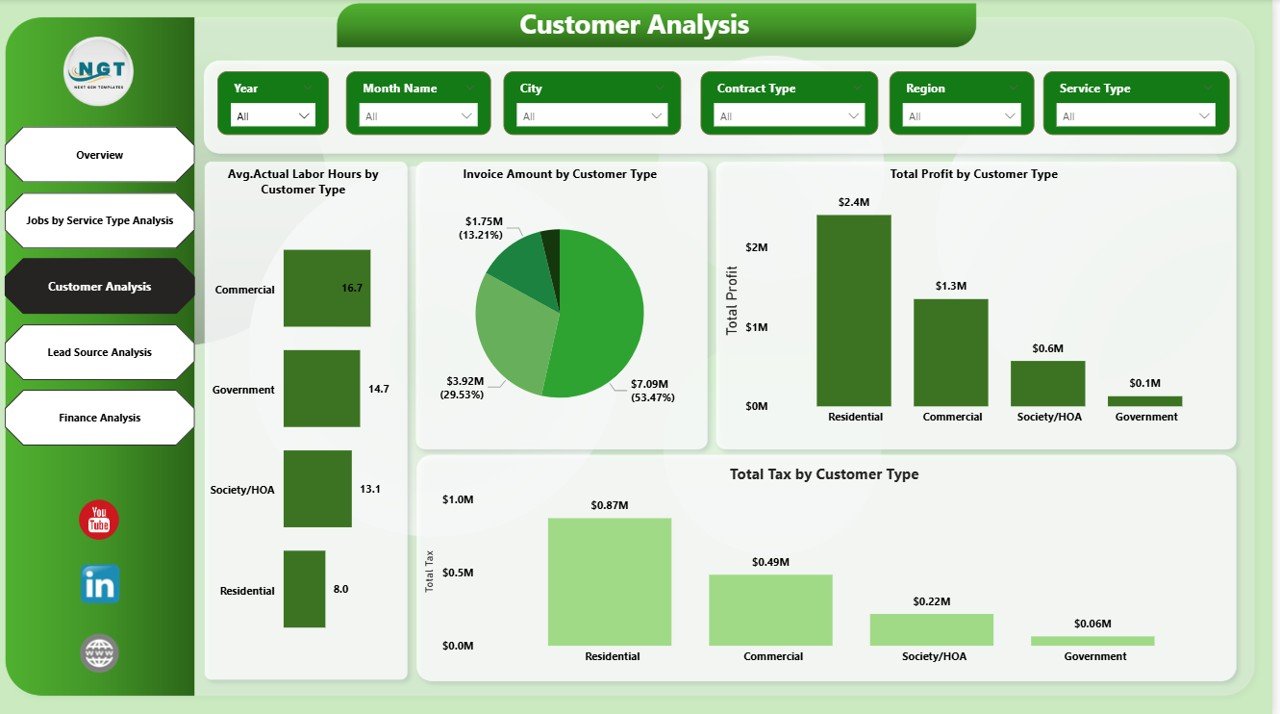
Customer Analysis: Which Customers Are Most Valuable?
Not all customers contribute equally to your business. Some customers bring steady revenue, while others demand high discounts or more labor hours.
The Customer Analysis page answers these questions clearly.
Key Metrics on Customer Analysis Page
- Average Actual Labor Hours by Customer Type
Shows which customer groups require more effort. - Invoice Amount by Customer Type
Identifies top revenue-generating segments. - Tax Rate by Customer Type
Helps with pricing and compliance planning. - Profit by Customer Type
Highlights the most profitable customer groups.
Business Benefits of Customer Analysis
This page helps you:
- Focus marketing on high-value customers
- Adjust pricing strategies
- Improve customer retention
- Reduce low-margin engagements
Because of this insight, customer management becomes more strategic.
Click to buy Landscaping Services Dashboard in Power BI
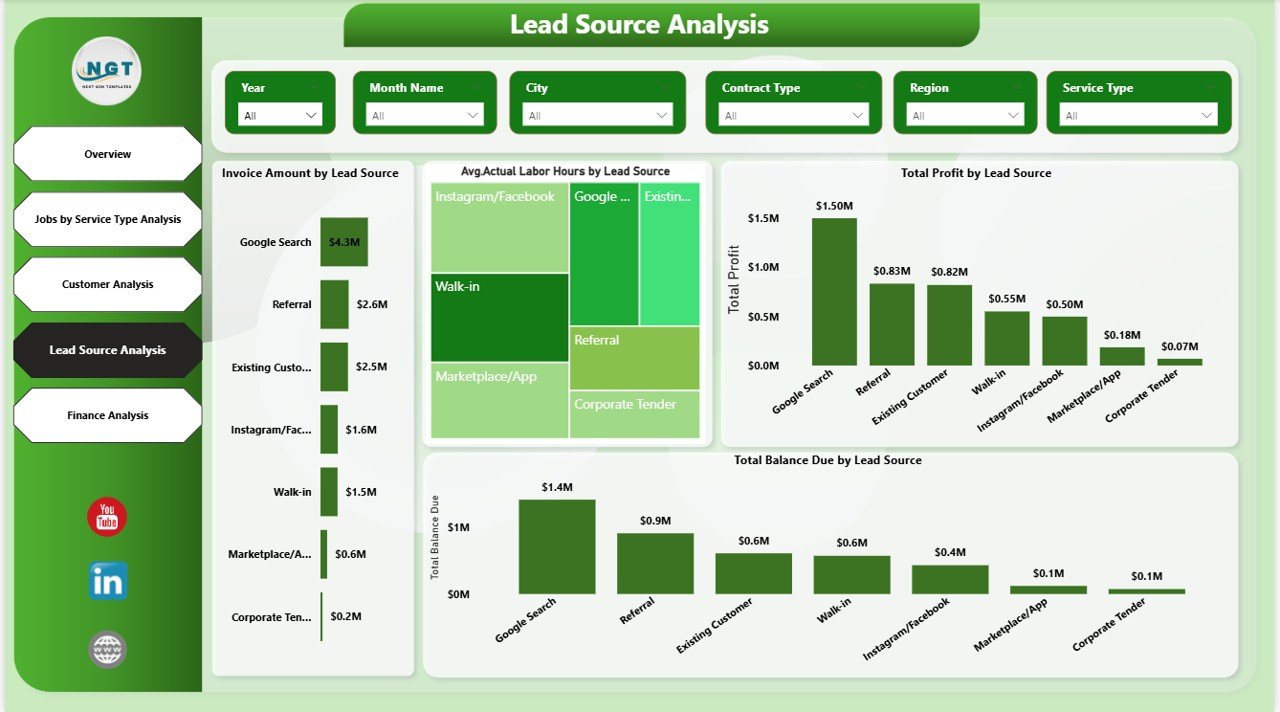
Lead Source Analysis: Which Marketing Channels Work Best?
Landscaping businesses receive leads from multiple sources such as referrals, websites, social media, ads, and local partnerships. However, not all lead sources perform equally.
The Lead Source Analysis page reveals the truth behind marketing performance.
Metrics Tracked in Lead Source Analysis
- Invoice Amount by Lead Source
Shows revenue generated by each channel. - Profit by Lead Source
Highlights the most profitable marketing sources. - Balance Due by Lead Source
Identifies payment risks across channels. - Average Actual Labor Hours by Lead Source
Reveals operational efficiency per lead source.
Why Lead Source Analysis Is Critical
This page helps you:
- Invest in profitable marketing channels
- Reduce spending on low-return sources
- Improve cash flow planning
- Optimize lead qualification
Therefore, marketing decisions become data-driven instead of guess-based.
Click to buy Landscaping Services Dashboard in Power BI
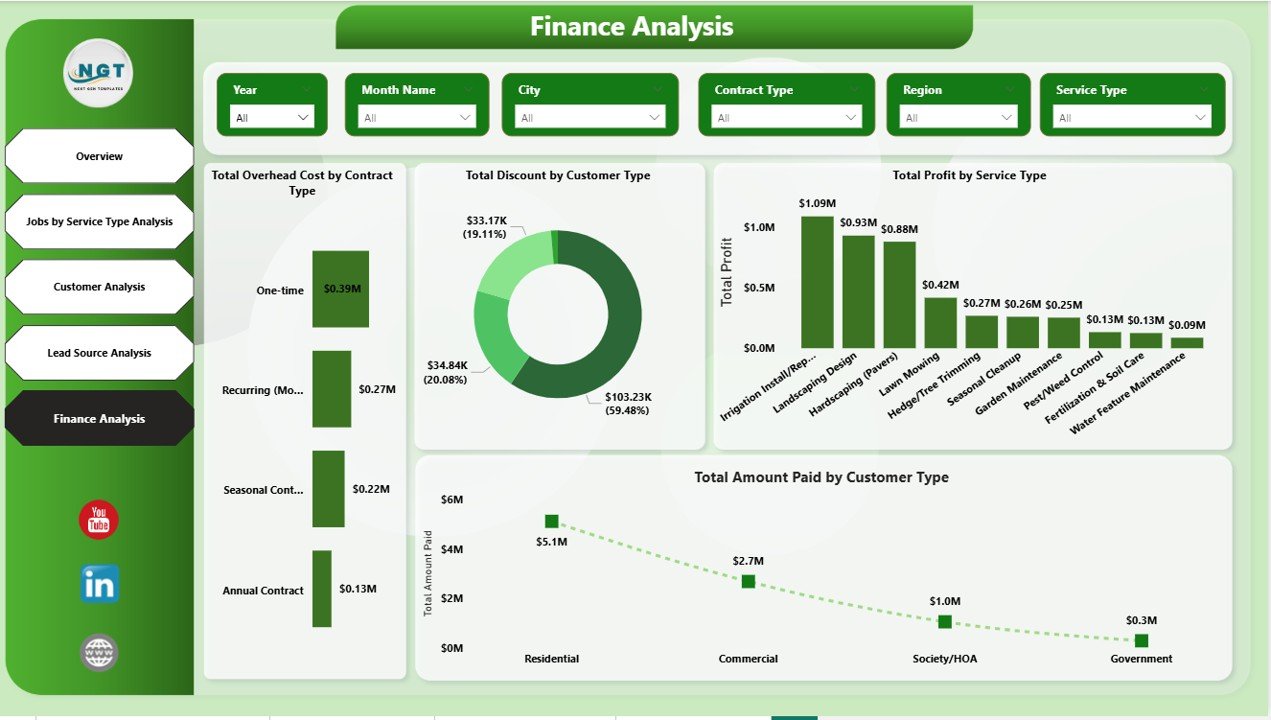
Finance Analysis: How Strong Is the Financial Health?
Financial stability determines long-term success. The Finance Analysis page focuses on cash flow, costs, and profitability.
Key Financial Metrics
- Amount Paid by Customer Type
Shows payment behavior patterns. - Overhead Cost by Contract Type
Helps manage fixed and variable costs. - Profit by Service Type
Reinforces service-level financial insights. - Average Actual Hours by Lead Source
Connects financial performance with operations.
Click to buy Landscaping Services Dashboard in Power BI
How Finance Analysis Helps Decision-Makers
With this page, you can:
- Improve cash collection strategies
- Control overhead costs
- Strengthen profit margins
- Align finance and operations
As a result, financial planning becomes more accurate and reliable.
Advantages of Landscaping Services Dashboard in Power BI
Using this dashboard provides several measurable benefits.
Key Advantages
- Centralized Reporting
All data stays in one interactive dashboard. - Real-Time Insights
Decision-makers always see updated performance. - Improved Profitability
Clear visibility into costs and margins. - Better Cash Flow Control
Faster identification of unpaid balances. - Smarter Resource Allocation
Data-driven labor and service planning. - Scalable Solution
Easily grows with business expansion.
Because of these advantages, Power BI dashboards deliver long-term value.
Opportunities for Improvement Using the Dashboard
While the dashboard already offers deep insights, businesses can further improve performance.
Key Improvement Opportunities
- Reduce discounts for low-profit services
- Improve labor efficiency for complex jobs
- Focus marketing on high-profit lead sources
- Optimize overhead costs by contract type
- Improve payment collection strategies
Using dashboard insights consistently creates continuous improvement.
Best Practices for Landscaping Services Dashboard in Power BI
To get maximum value, follow these proven best practices.
Best Practices
- Keep Data Clean and Consistent
Accurate data ensures reliable insights. - Update Data Regularly
Schedule frequent data refreshes. - Use Filters and Slicers Effectively
Analyze data by service, region, and customer type. - Monitor KPIs Weekly
Regular reviews prevent surprises. - Train Team Members
Ensure managers understand how to use the dashboard. - Align KPIs with Business Goals
Focus only on metrics that drive growth.
Following these practices ensures long-term dashboard success.
How Does This Dashboard Improve Decision-Making?
This dashboard transforms decision-making in several ways:
- Moves decisions from intuition to data
- Highlights risks before they grow
- Supports pricing and contract negotiations
- Improves marketing ROI
- Strengthens financial discipline
Because of this, leadership teams make faster and smarter decisions.
Conclusion: Why Landscaping Businesses Should Use Power BI Dashboards
A Landscaping Services Dashboard in Power BI is no longer optional. It is a strategic necessity for modern landscaping businesses. This dashboard connects finance, operations, customers, and marketing into one powerful analytical platform.
By using this dashboard, landscaping companies gain clarity, control, and confidence. Moreover, they improve profitability, streamline operations, and support long-term growth.
If you want to run your landscaping business with data instead of guesswork, this dashboard provides the perfect solution.
Frequently Asked Questions (FAQs)
What is the main purpose of a Landscaping Services Dashboard in Power BI?
The main purpose is to track financial, operational, and customer performance in one centralized platform for better decision-making.
Can small landscaping businesses use this Power BI dashboard?
Yes, small businesses can easily use this dashboard because Power BI scales based on data size and complexity.
Does this dashboard require advanced Power BI knowledge?
No, end users only need basic Power BI navigation skills to use filters and view insights.
Which data sources can feed this dashboard?
You can use Excel files, accounting systems, job management tools, and CRM systems as data sources.
How often should the dashboard data refresh?
You should refresh data weekly or daily, depending on business activity and reporting needs.
Can this dashboard support multi-location landscaping businesses?
Yes, the dashboard supports region-based analysis and easily handles multiple locations.
How does this dashboard help improve profitability?
It highlights profitable services, high-cost jobs, and discount-heavy segments, enabling better pricing and cost control.
Visit our YouTube channel to learn step-by-step video tutorials
Watch the step-by-step video tutorial:
Click to buy Landscaping Services Dashboard in Power BI