Law Firm Performance Dashboard in Excel — Track Billing, Collections, and Attorney Performance
Law Firm Performance Dashboard in Excel is a ready-to-use analytics template that helps law firms, legal departments, and solo practitioners monitor their entire practice performance from one Excel workbook. This dashboard includes 5 interactive pages — Overview, Attorney Analysis, Practice Insights, Client Analysis, and Financial Trend — along with a Data Sheet for input and a Support Sheet containing all the pivot tables that drive the dashboard. It tracks critical law firm KPIs including Total Records, Total Billed, Total Collected, Average Satisfaction Score, and Realization Rate percentage.
Whether you run a boutique litigation practice or a large corporate legal team, this Excel dashboard gives you the clarity you need to make data-driven decisions about billing strategy, attorney productivity, and client management.
👉 Click here to Purchase the Law Firm Performance Dashboard in Excel
Key Features of the Law Firm Performance Dashboard in Excel
- 5 Interactive Dashboard Pages covering every major dimension of law firm operations — from high-level KPIs to granular attorney and client analysis.
- KPI Cards on Overview Page showing Total Records, Total Billed, Total Collected, Avg. Satisfaction, and Realization Rate % at a glance.
- Multiple Slicers for instant filtering by office, client type, priority, time period, and more.
- Attorney Performance Benchmarking comparing billable hours, wins, satisfaction, and billed vs collected for top 5 attorneys.
- Practice Area Revenue Analysis breaking down billed amounts by case type, practice area, and billing method.
- Client Segmentation visualizing case status distribution, client type analysis, and case value by priority.
- Financial Trend Monitoring with monthly expense tracking, partner group billing, and billing method trends.
- Pivot-Powered Auto-Refresh — update your data once and click Refresh All to update the entire dashboard.
- Ready-to-Use Sample Data pre-loaded so you can explore every chart and page immediately.
Dashboard Pages Explained
1. Overview Page
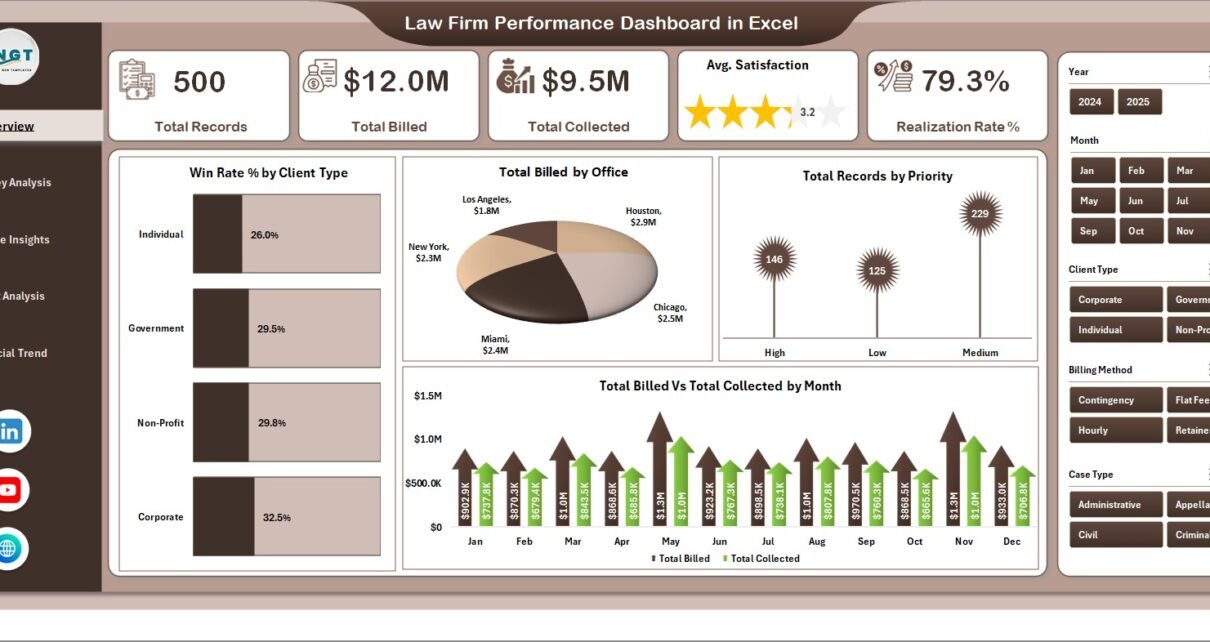
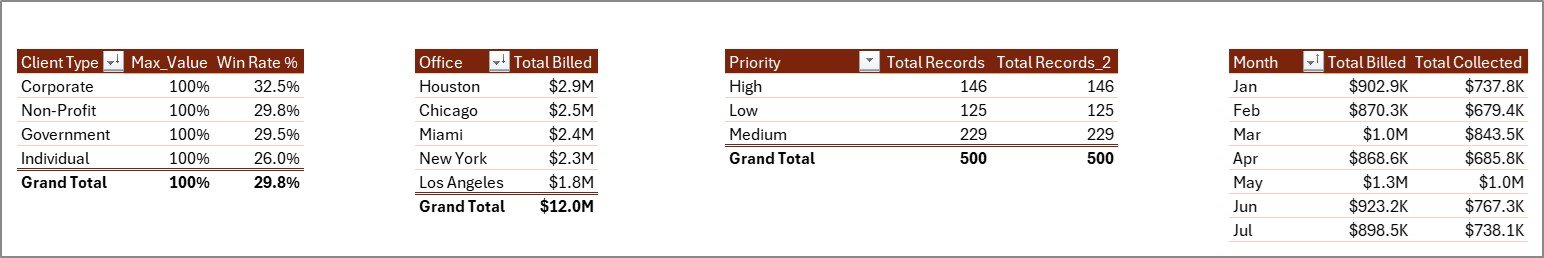
The Overview page serves as the command center of the Law Firm Performance Dashboard in Excel. At the top, you will find 5 KPI cards displaying Total Records, Total Billed, Total Collected, Avg. Satisfaction, and Realization Rate %. Below these cards, interactive charts provide deeper analysis: Win Rate % by Client Type shows how different client segments perform in case outcomes, Total Billed by Office compares billing volume across your firm’s locations, Total Records by Priority reveals the distribution of cases by urgency level, and Total Billed vs Total Collected by Month highlights collection efficiency trends over time. Multiple slicers on this page let you filter the entire view instantly.
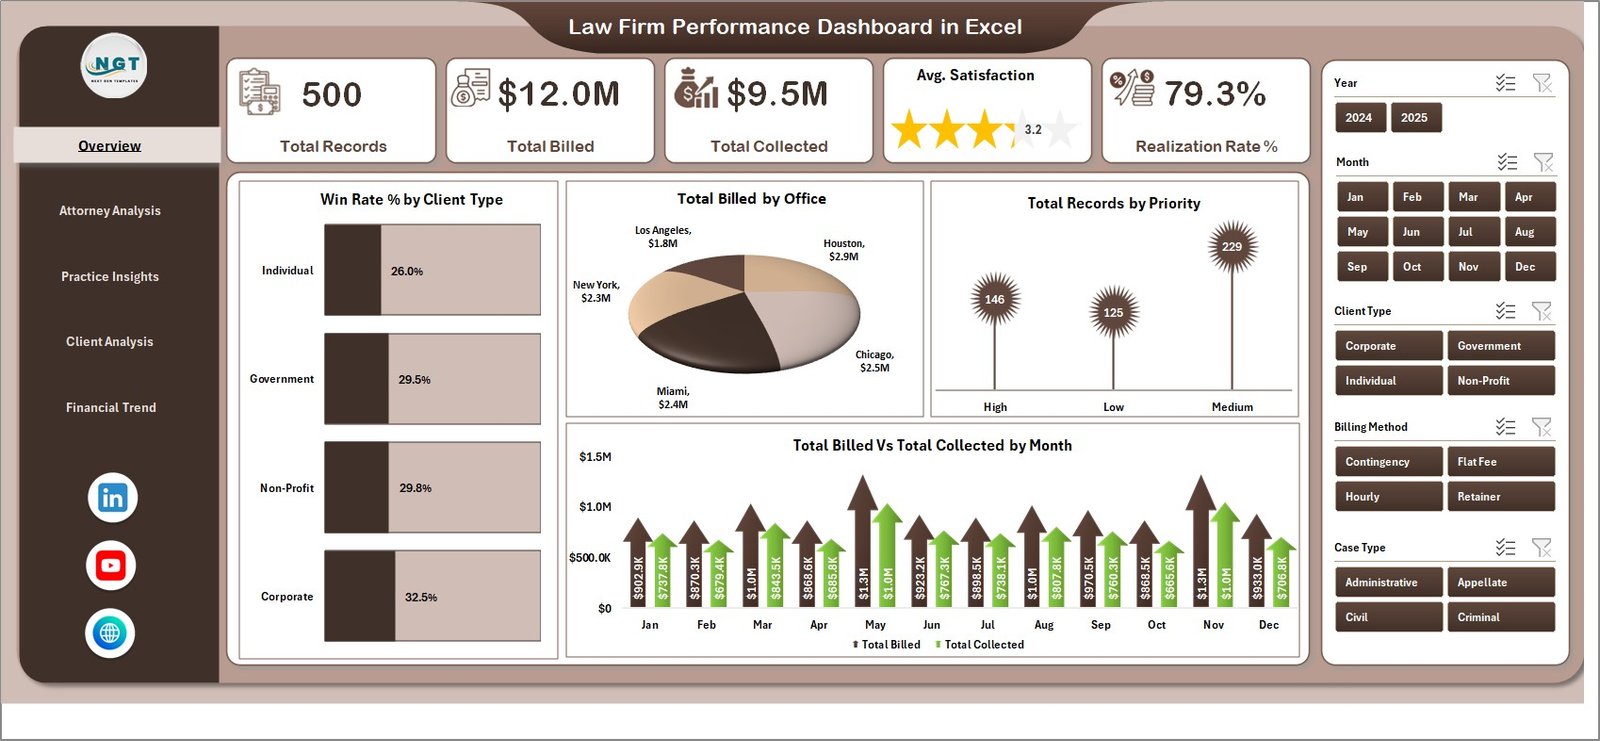 Overview Page
2. Attorney Analysis
The Attorney Analysis page dives deep into individual attorney performance across your firm. It features four focused charts: Total Billable Hours by Top Five Attorney ranks your highest-contributing attorneys by hours worked, Total Won by Top Five Attorney highlights which attorneys close the most successful outcomes, Avg. Satisfaction by Top Five Attorney measures client satisfaction scores per attorney, and Total Billed vs Total Collected by Top Five Attorney compares billing efficiency at the individual level. This page is essential for performance reviews, compensation planning, and identifying coaching opportunities.
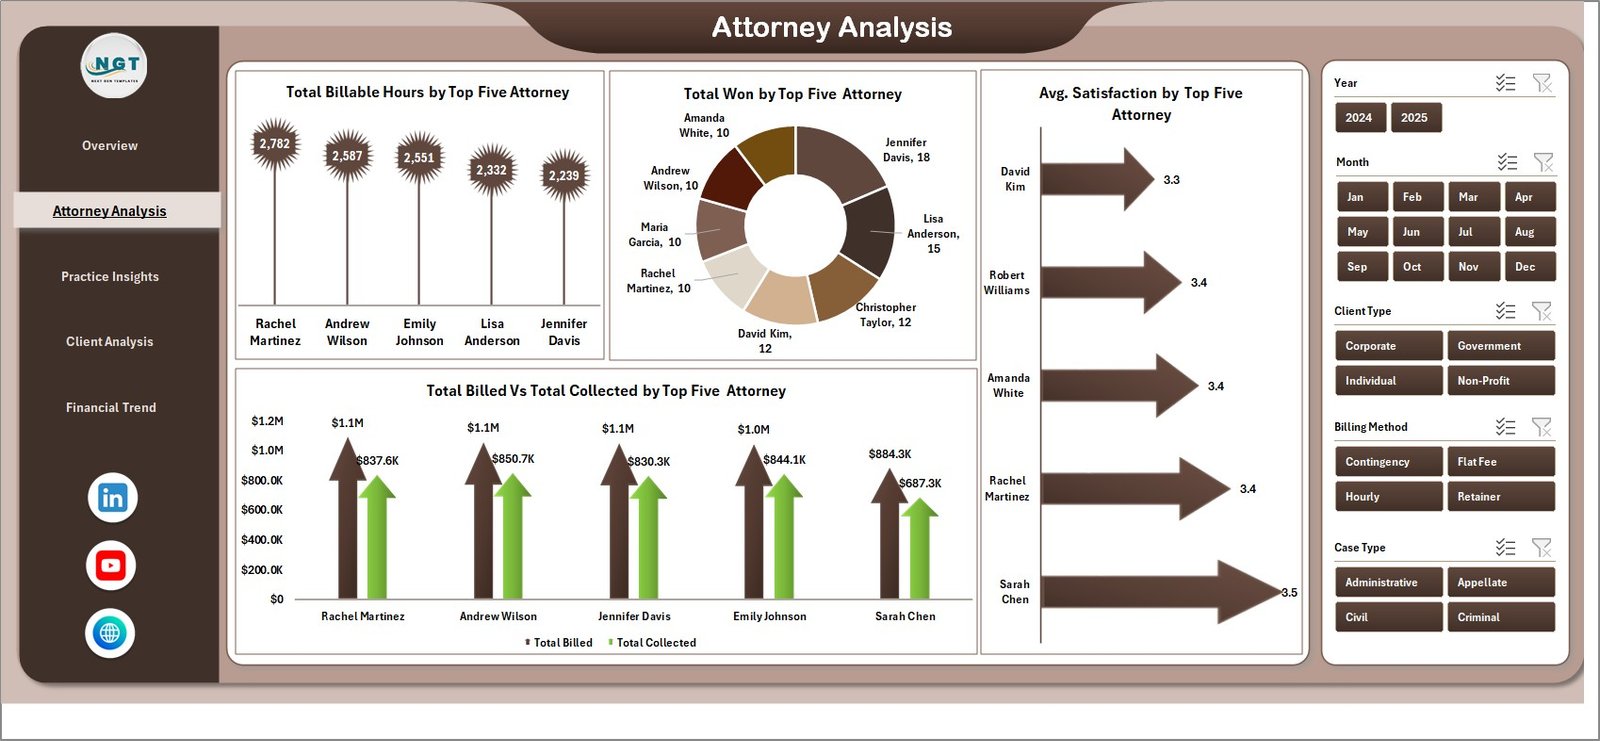 Attorney Analysis
3. Practice Insights
The Practice Insights page breaks down your firm’s work by practice area and billing methodology. Total Records by Billing Method shows how cases are distributed across hourly, flat-fee, contingency, and other billing structures. Total Billed by Case Type reveals which types of legal matters generate the most revenue. Total Case Value by Practice Area and Total Billed by Practice Area together help you understand which practice areas are the most profitable and which might need strategic adjustments.
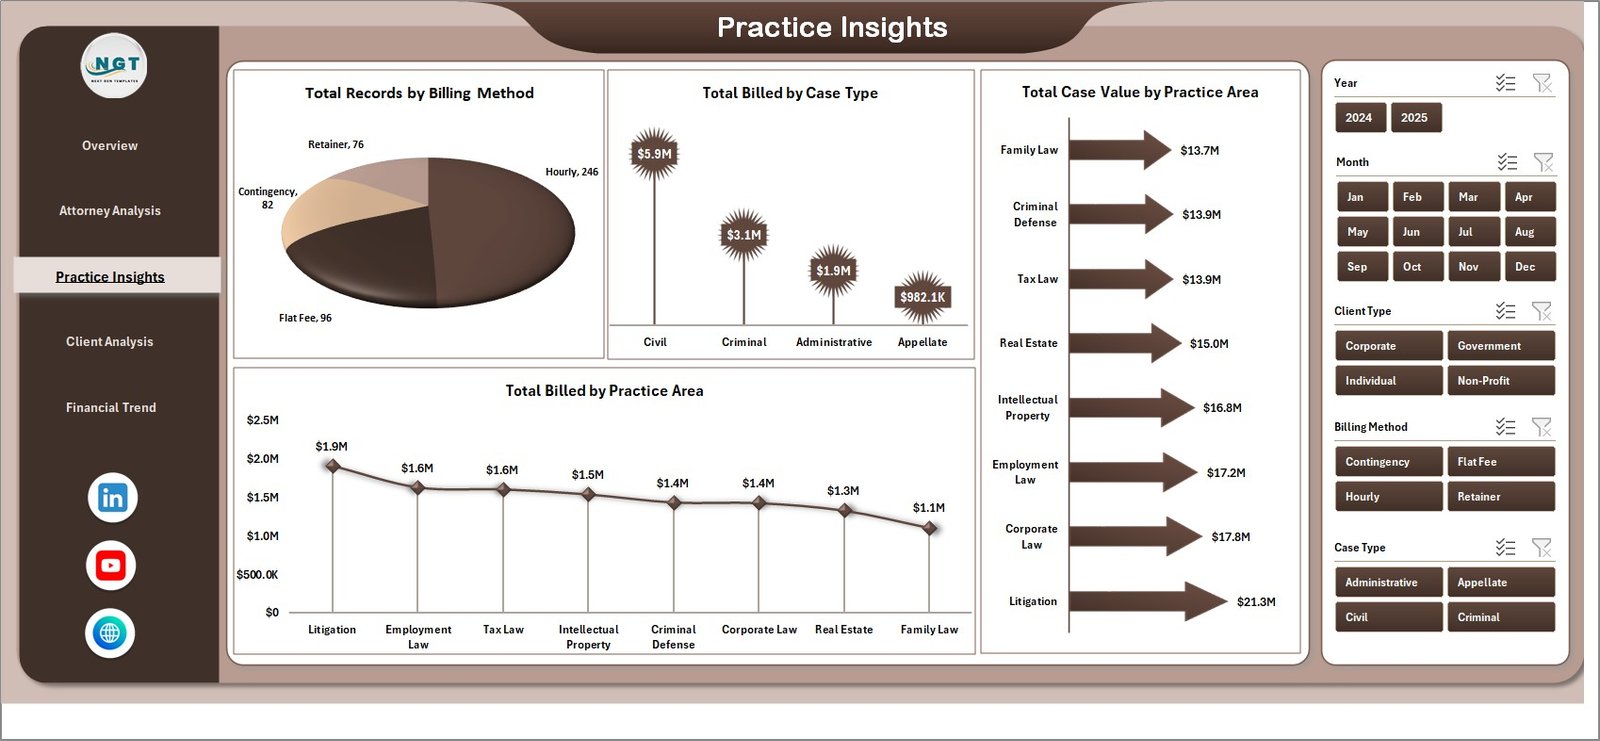 Practice Insights
4. Client Analysis
The Client Analysis page provides a comprehensive view of your client base and case portfolio. Total Records by Case Status shows the distribution of open, closed, pending, and settled cases. Total Records by Client Type segments your caseload by individual, corporate, government, or institutional clients. Total Billed vs Total Collected by Client Type highlights which client segments have the best payment behavior, while Total Case Value by Priority helps you understand where the highest-value cases are concentrated.
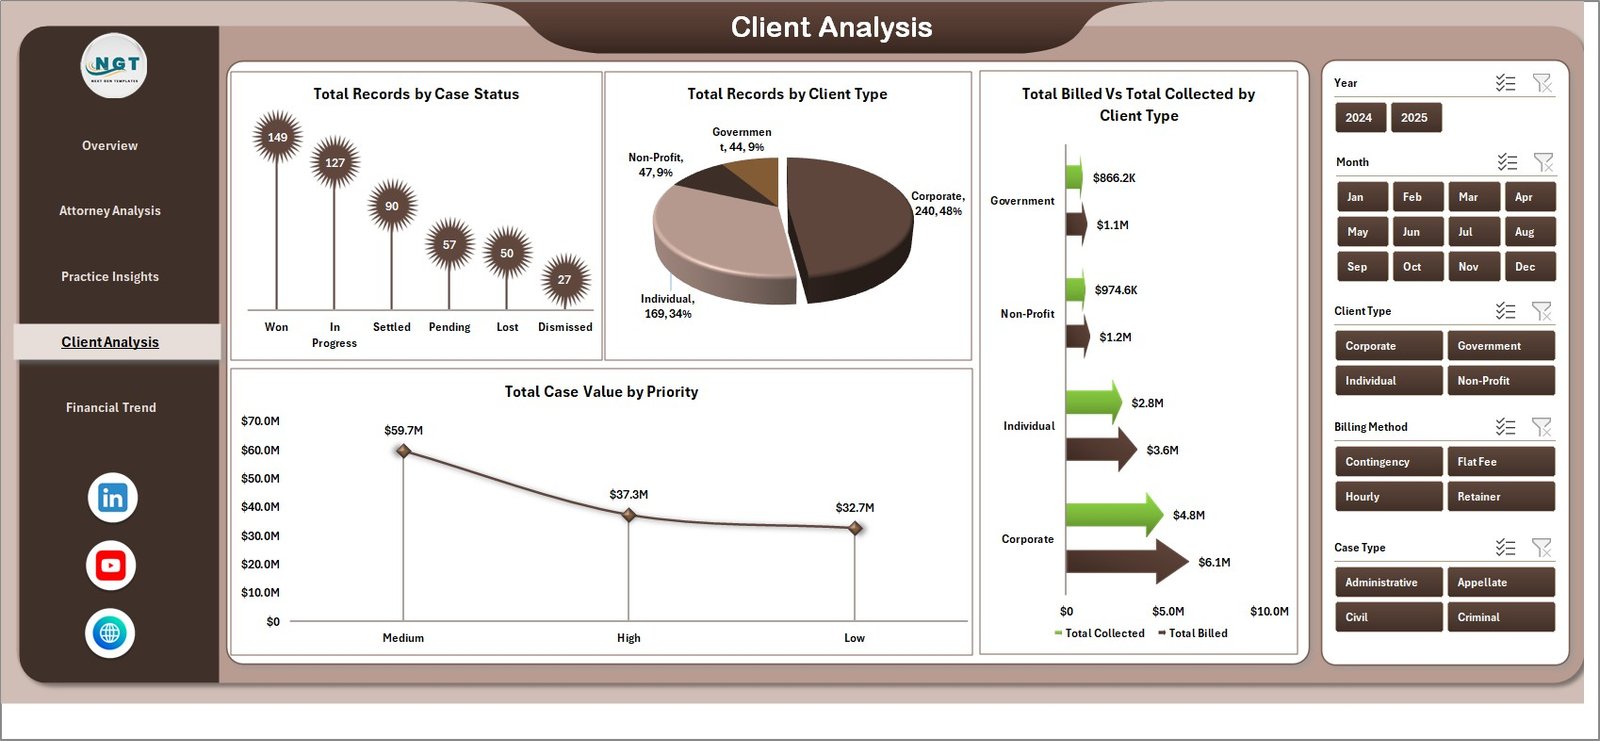 Client Analysis
5. Financial Trend
The Financial Trend page focuses on the monetary health of your practice over time. Total Billed by Billing Method shows revenue distribution across different fee structures, helping you evaluate which billing approaches generate the most income. Total Expenses by Month tracks your firm’s cost patterns throughout the year, making it easy to spot seasonal spikes or budget overruns. Total Billed by Partner Group compares revenue generation across different partner teams or practice groups within the firm.
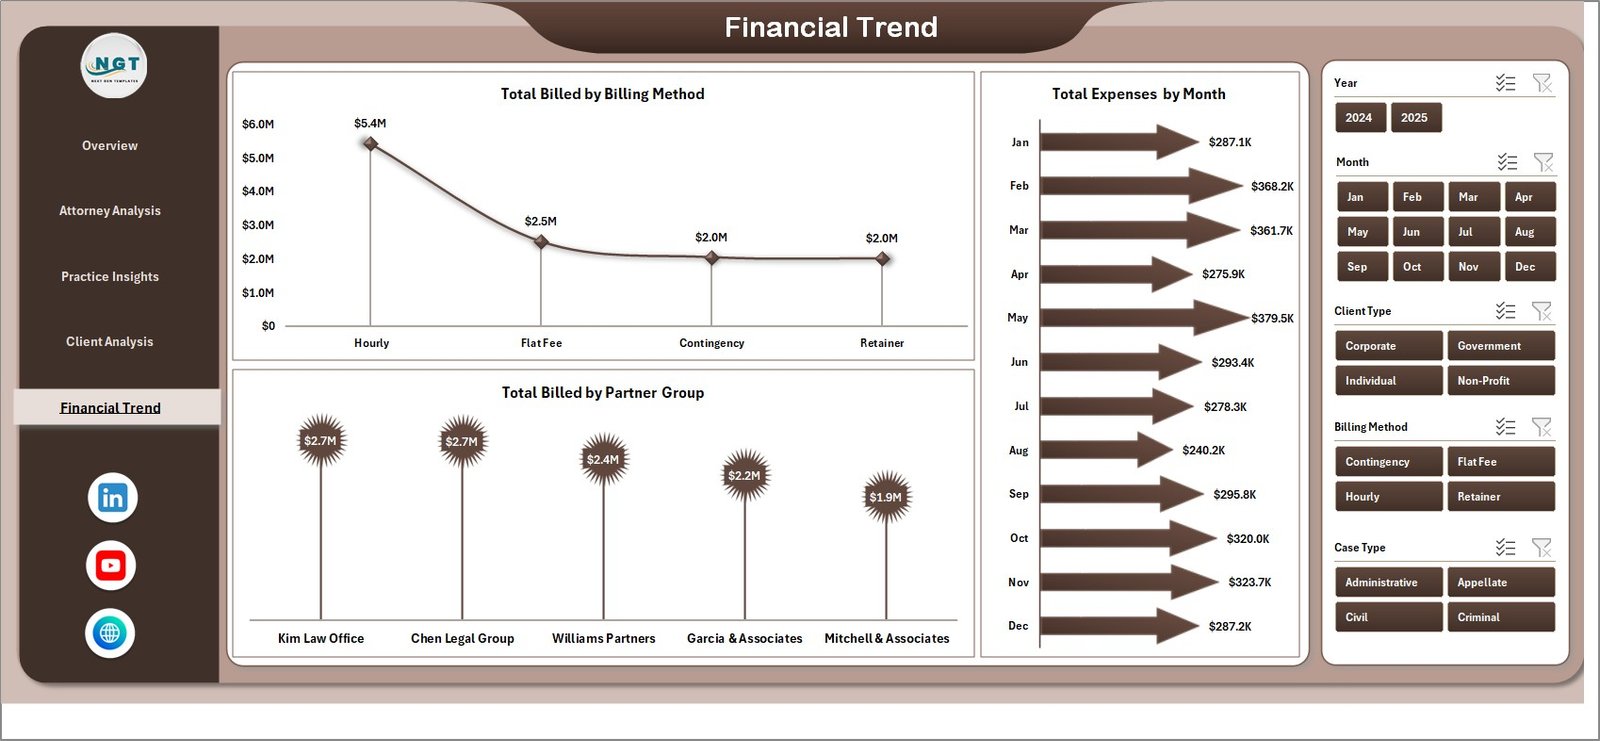 Financial Trend
6. Data Sheet
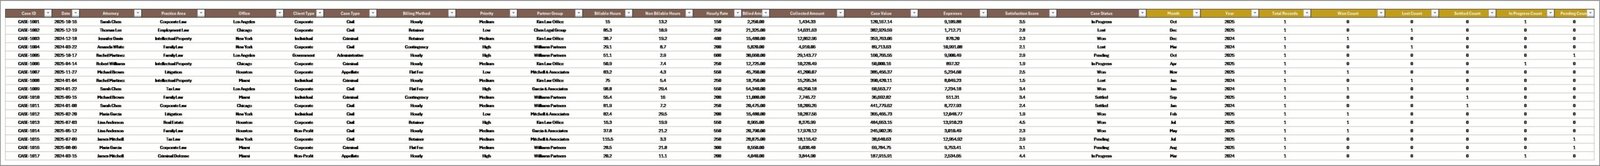
The Data Sheet is where you enter all your law firm case records. Each row represents one case record with fields for attorney name, client type, case type, practice area, billing method, amounts, dates, and more. Simply replace the sample data with your own records in the same column format, and the entire dashboard will update after you click Refresh All from the Data tab in the Excel ribbon.
 Data Sheet Tab
7. Support Sheet
The Support Sheet contains all the pivot tables that power every chart and KPI card in the dashboard. You do not need to edit anything on this sheet. When you update data in the Data Sheet and click Refresh All, all pivots recalculate automatically. You can keep this sheet hidden during normal use to maintain a clean workbook interface.
 Support Sheet Tab
Advantages of the Law Firm Performance Dashboard in Excel
- Centralized Visibility — See billing, collections, attorney performance, and client metrics in one place instead of scattered across multiple reports.
- No Technical Skills Required — The pivot-powered design means you just enter data and refresh. No formulas to write, no macros to enable.
- Instant Decision-Making — Interactive slicers let managing partners and administrators filter data on the fly during meetings.
- Attorney Accountability — The Attorney Analysis page makes it easy to compare performance across team members objectively.
- Revenue Optimization — Practice Insights and Financial Trend pages help identify which areas drive revenue and where expenses are creeping up.
Opportunities for Improvement
- Adding a dedicated time-tracking integration for real-time billable hour capture.
- Including a client profitability page that calculates net revenue per client after expenses.
- Adding conditional formatting rules to highlight attorneys or practice areas falling below target KPIs.
- Including a monthly comparison view to track performance changes period-over-period.
Best Practices for Using This Law Firm Dashboard
- Update data weekly to keep KPIs current and slicers meaningful.
- Use consistent naming for attorneys, practice areas, and client types to ensure accurate pivot table grouping.
- Hide the Support Sheet before sharing with partners or presenting in meetings for a cleaner look.
- Export individual pages as PDF when you need to share specific analysis with stakeholders who don’t use Excel.
- Back up your data before making bulk changes to the Data Sheet.
Explore Relevant Templates
If you found the Law Firm Performance Dashboard in Excel useful, explore these related legal and analytics templates on NextGenTemplates:
- Arbitration and Mediation Dashboard in Excel — Track arbitration case outcomes, mediation success rates, and dispute resolution timelines.
- Legal Advisory KPI Dashboard in Excel — Monitor legal advisory team KPIs with automated scorecards and trend analysis.
- Tax Litigation KPI Dashboard in Excel — Specialized dashboard for tax litigation teams tracking case volumes, settlements, and win rates.
- Legal Dashboard in Google Sheets — Google Sheets alternative for teams who prefer cloud-based collaboration.
- Legal Dashboard in Power BI — Advanced interactive legal analytics with drill-through and cross-filtering in Power BI.
Browse the full collection of Excel Dashboard Templates for more business intelligence solutions.
Frequently Asked Questions
What is the best Excel dashboard template for law firms?
The Law Firm Performance Dashboard in Excel from NextGenTemplates is one of the best options for law firms looking to track billing, collections, attorney productivity, and client analysis. It includes 5 interactive pages with pivot-powered charts and slicers, covering every critical aspect of law firm operations.
How do I update the data in this law firm dashboard?
Navigate to the Data Sheet tab and replace the sample records with your own case data in the same column format. Then go to the Data tab in the Excel ribbon and click Refresh All. All pivot tables, charts, and KPI cards across all 5 dashboard pages will update automatically.
Can I track individual attorney performance with this template?
Yes. The Attorney Analysis page provides detailed comparisons of billable hours, case wins, client satisfaction scores, and billed vs collected amounts for the top 5 attorneys. This makes it ideal for performance reviews and compensation planning.
Does this template work with Microsoft 365 and older Excel versions?
This dashboard works best with Microsoft Excel 2016 or later, including Microsoft 365. Pivot tables and slicers are fully supported across these versions. Older versions may have limited slicer functionality.
How can I track law firm billing and collections in Excel?
The Law Firm Performance Dashboard in Excel tracks both billing and collections through multiple views: the Overview page shows Total Billed vs Total Collected by Month, the Attorney Analysis page compares billed vs collected per attorney, and the Client Analysis page breaks it down by client type. The Realization Rate % KPI card on the Overview gives you the overall collection efficiency at a glance.
What KPIs are tracked in this law firm Excel dashboard?
The dashboard tracks Total Records, Total Billed, Total Collected, Average Satisfaction Score, and Realization Rate % as primary KPIs. Additional metrics include win rate by client type, billable hours by attorney, case value by practice area, expenses by month, and billed amounts by partner group across 5 analysis pages.
Conclusion
The Law Firm Performance Dashboard in Excel is an essential tool for any legal practice that wants to move beyond spreadsheet chaos and start making data-driven decisions. With 5 interactive pages covering billing, attorney performance, practice insights, client analysis, and financial trends, this template gives managing partners and law firm administrators complete visibility into their practice. Download it today and transform how you track and analyze your law firm’s performance.
👉 Click here to Purchase the Law Firm Performance Dashboard in Excel
🎥 Visit our YouTube channel for step-by-step tutorials: Youtube.com/@PK-AnExcelExpert
Learn more about Excel pivot tables and slicers on Microsoft Support.