Law Firm Performance Dashboard in Power BI – Complete Legal Analytics Template
Law Firm Performance Dashboard in Power BI is a ready-to-use business intelligence template designed for law firms, corporate legal departments, and solo practitioners who need complete visibility into billing, collections, attorney performance, and financial trends. This Power BI dashboard includes 5 interactive pages covering every critical dimension of law firm operations. It tracks essential KPIs such as Total Cases, Total Billed, Total Collected, Average Satisfaction Score, and Realization Rate. Built with interactive Power BI visuals and slicers, every chart updates dynamically when you apply filters or connect your own data source.
Whether you manage a boutique litigation firm or a full-service corporate law practice, this template gives you instant visibility into case performance, billing trends, and attorney productivity. Explore our complete collection of Power BI Dashboard Templates at NextGenTemplates for more business intelligence solutions.
Key Features of the Law Firm Performance Dashboard in Power BI
This dashboard is packed with powerful analytical capabilities designed specifically for legal professionals. The template includes 5 interactive dashboard pages, KPI cards tracking 5 core metrics, dynamic slicers for instant filtering, and visuals covering billing, collections, attorney productivity, practice area revenue, client segmentation, and financial trends. All charts update automatically when you connect your own law firm data through Power Query, requiring no advanced Power BI skills.
The dashboard supports filtering by office location, client type, case priority, billing method, and time period. Every page is designed to answer specific questions about firm performance, from high-level billing summaries to detailed attorney-level analysis. This makes it one of the most comprehensive law firm analytics templates available for Power BI.
Dashboard Pages Explained
1 – Overview Page
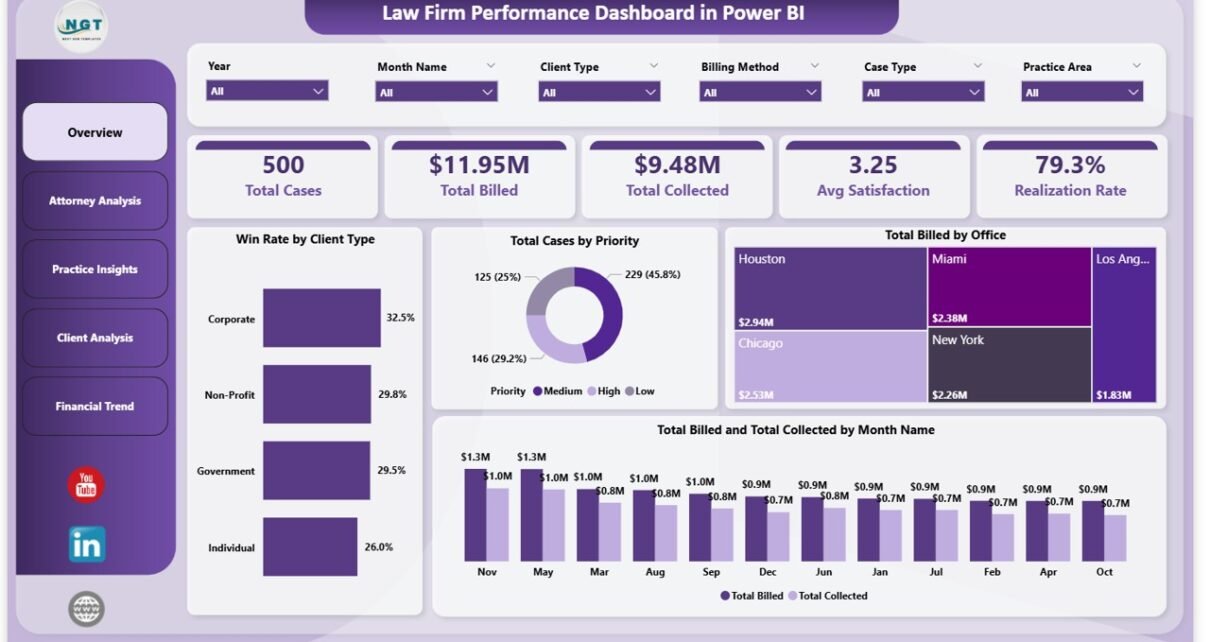
The Overview Page provides a high-level snapshot of your law firm’s performance. At the top, KPI cards display Total Cases, Total Billed, Total Collected, Avg Satisfaction, and Realization Rate. Below, interactive visuals show Win Rate by Client Type, helping you understand which client segments have the highest case success rates. Total Cases by Priority breaks down your caseload by urgency level. Total Billed by Office reveals which office locations generate the most revenue. Total Billed and Total Collected by Month Name tracks billing and collection trends over time, making it easy to spot seasonal patterns. Multiple slicers allow you to filter the entire dashboard instantly by any dimension.
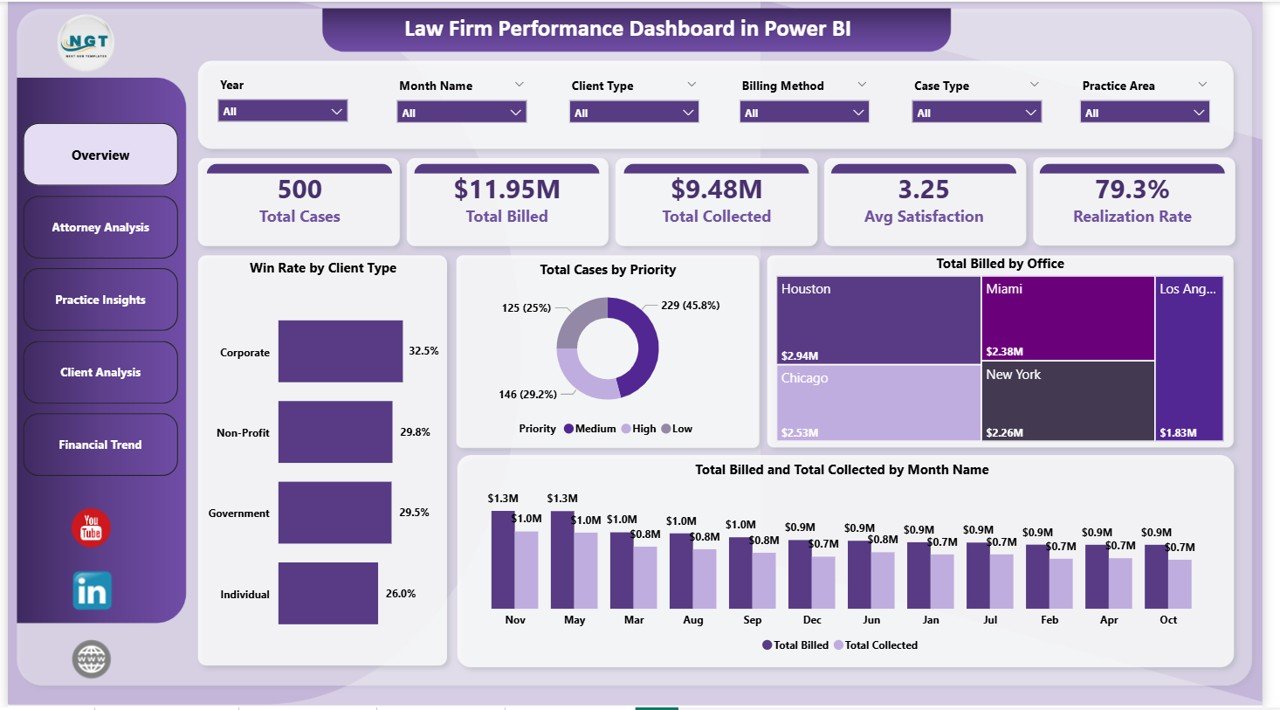
Law Firm Performance Dashboard in Power BI
2 – Attorney Analysis
The Attorney Analysis page dives deep into individual attorney performance across your firm. It features three key visuals: Total Billable Hours by Top Five Attorney shows which attorneys are logging the most productive hours. Total Billed and Total Collected by Top Five Attorney compares billing output against actual collections, helping identify collection efficiency gaps. Cases Won by Top Five Attorney highlights your top performers in terms of successful case outcomes. This page is essential for evaluating partner and associate productivity and making informed staffing decisions.
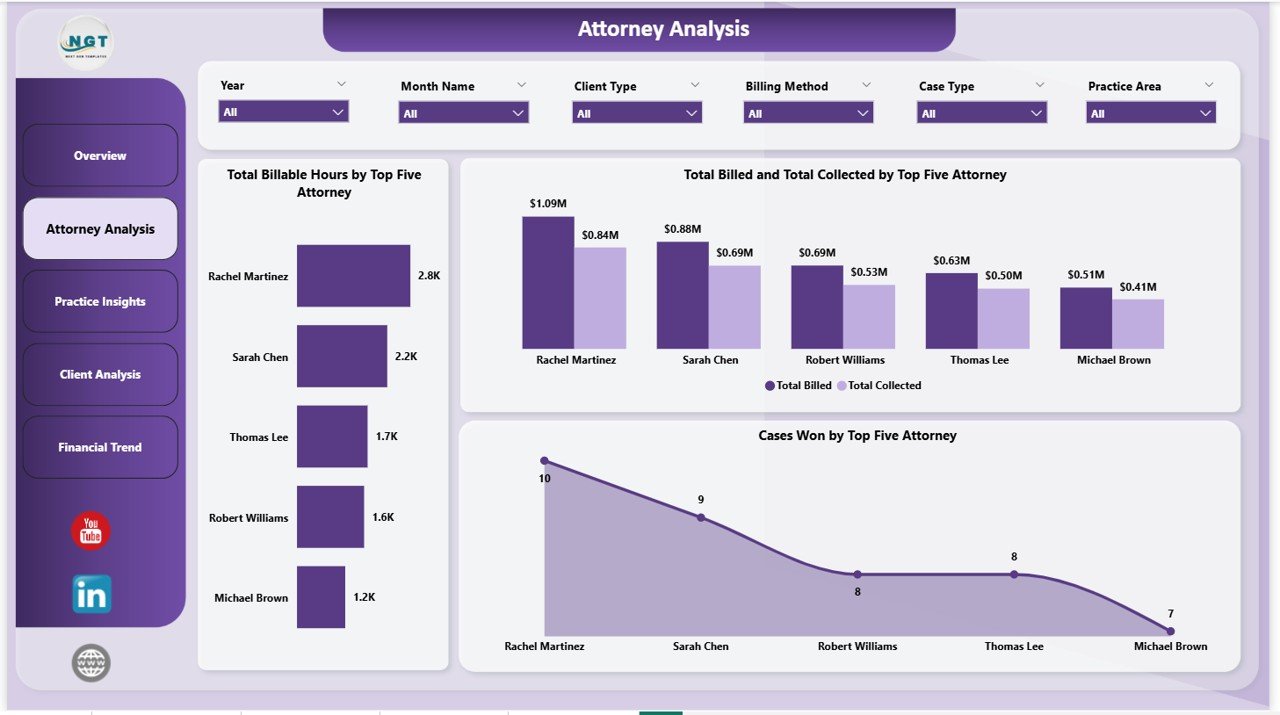
Attorney Analysis
3 – Practice Insights
The Practice Insights page analyzes your firm’s revenue streams by practice area and billing method. Total Cases by Billing Method shows the distribution between hourly, flat-fee, contingency, and other billing arrangements. Total Billed by Practice Area reveals which legal specialties generate the most revenue for your firm. Total Billed by Case Type provides granular insight into how different case categories contribute to overall billing. Together, these visuals help managing partners understand which practice areas and billing strategies drive the highest returns.
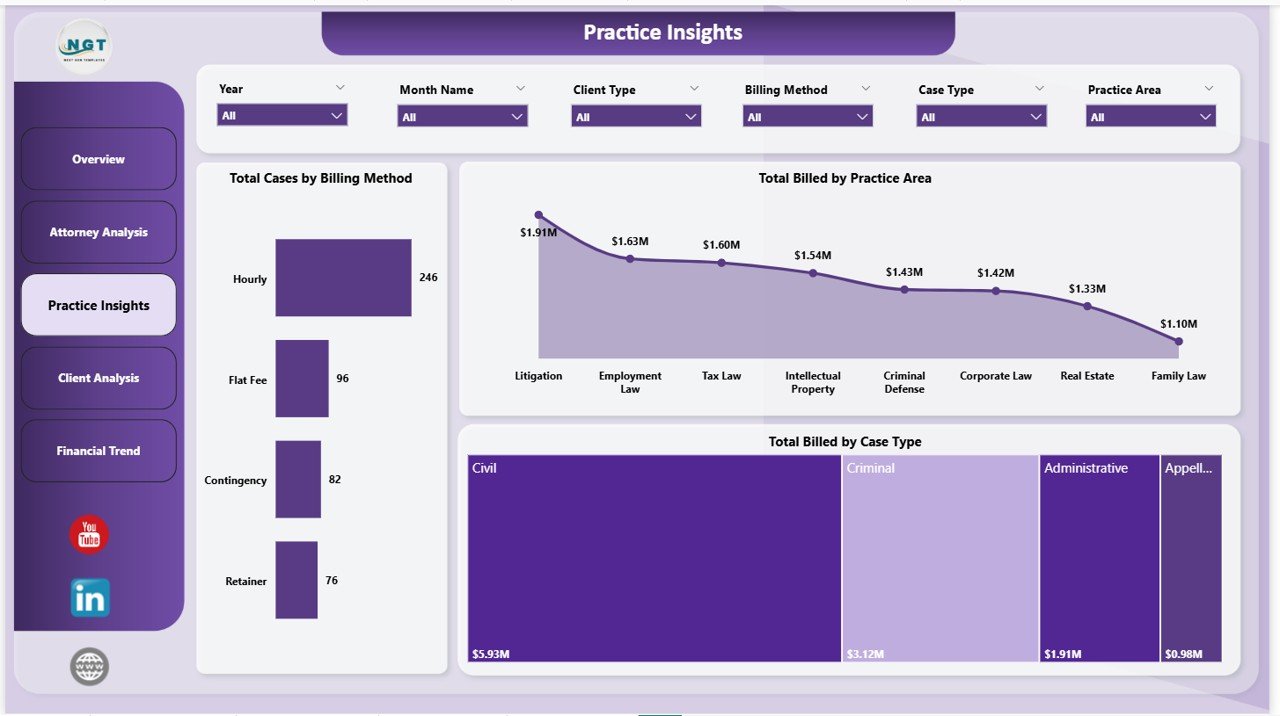
Practice Insights
4 – Client Analysis
The Client Analysis page helps you understand your client portfolio in detail. Total Cases by Client Type segments your caseload by client category such as corporate, individual, government, or nonprofit clients. Total Cases by Case Status shows how many cases are open, closed, pending, or in progress. Total Billed and Total Collected by Client Type compares billing output and collection rates across different client segments, helping identify which types of clients have the best payment behavior and highest billing volume.
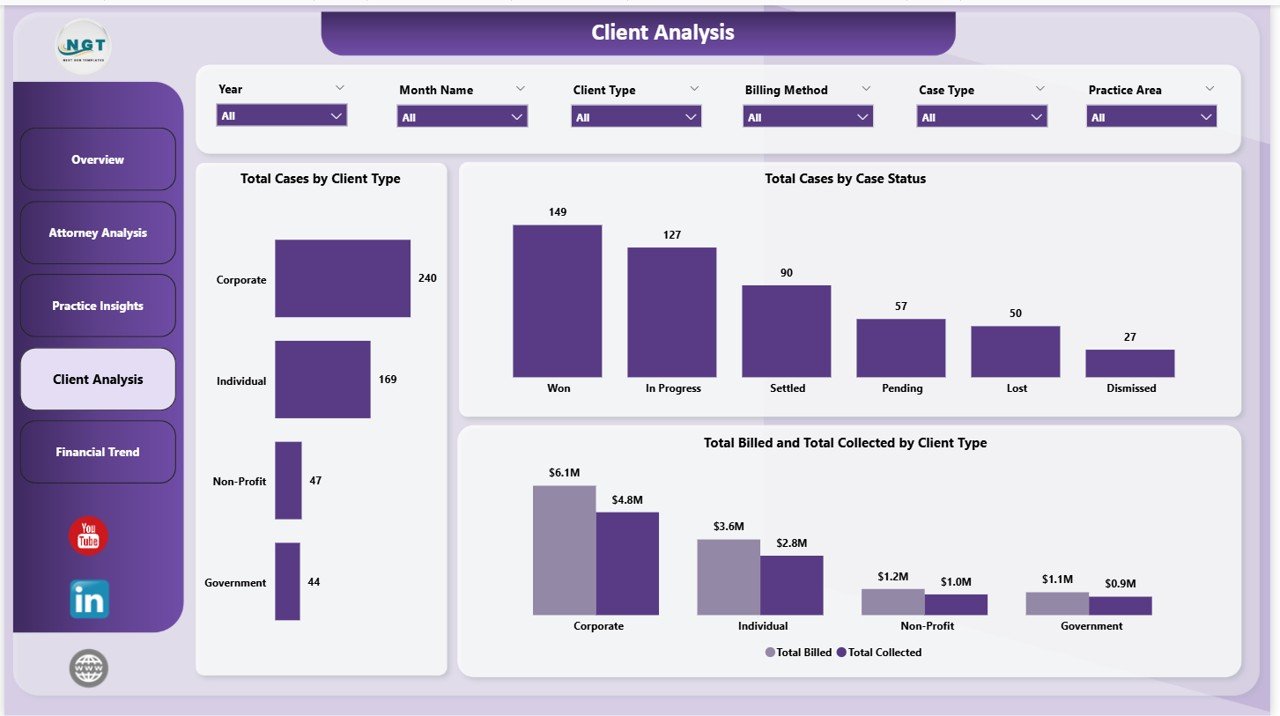
Client Analysis
5 – Financial Trend
The Financial Trend page monitors your firm’s financial patterns over time. Total Expenses by Month Name tracks monthly expense fluctuations so you can identify cost spikes and plan budgets accordingly. Total Billed by Billing Method shows how your billing approach mix changes over time. Total Billed by Partner Group reveals which partner teams are generating the most revenue, enabling better resource allocation and performance benchmarking across the firm.
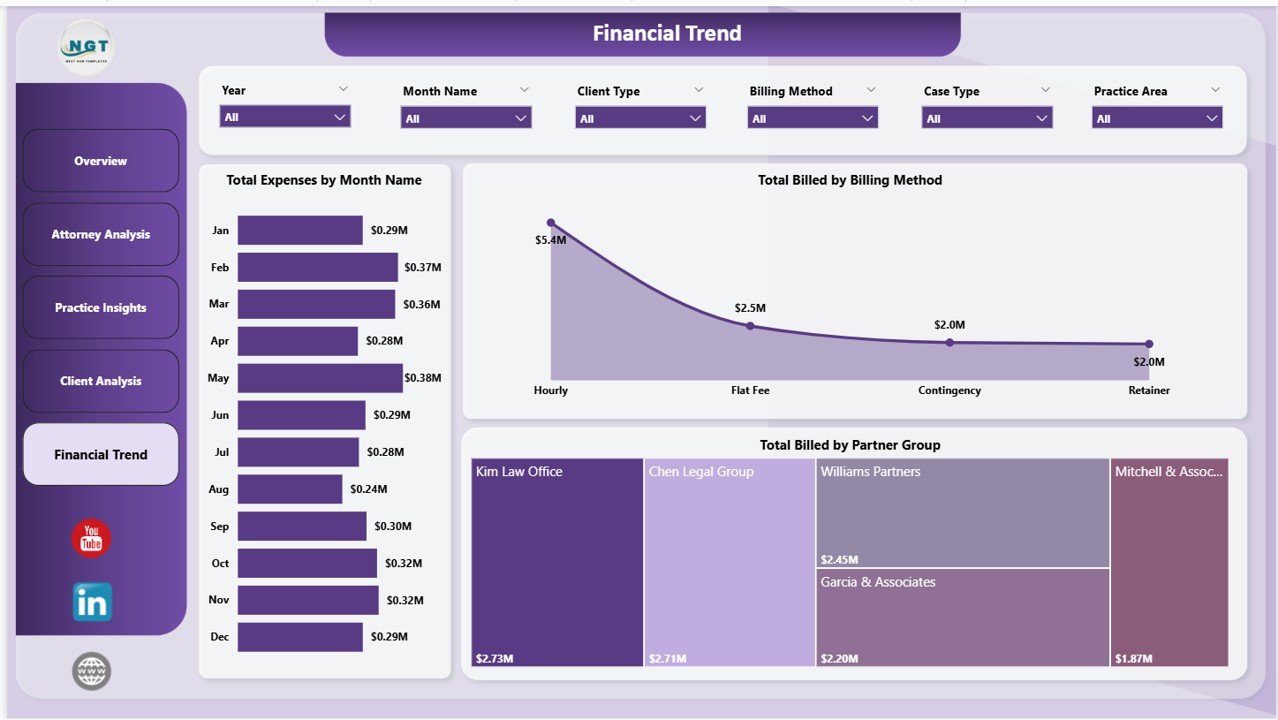
Financial Trend
Advantages of the Law Firm Performance Dashboard in Power BI
This template eliminates the need for scattered spreadsheets and manual reporting. Legal professionals gain centralized visibility into all firm operations through a single Power BI file. The interactive slicers enable instant drill-down analysis without any formula editing. Since Power BI Desktop is free from Microsoft, there are no additional software costs. The dashboard can be published to Power BI Service for team-wide access with scheduled data refresh, ensuring everyone works from the same current data.
The template also supports multiple data sources through Power Query, meaning you can connect it to your existing case management system, accounting software, or Excel exports. This flexibility makes it suitable for firms of all sizes, from solo practitioners to multi-office law firms.
Opportunities for Improvement
While this dashboard covers the most critical law firm metrics, firms with highly specialized needs might want to add custom DAX measures for metrics like average case duration, matter profitability ratios, or client lifetime value. Additionally, integrating real-time data feeds from practice management software like Clio or PracticePanther would enhance the dashboard’s value for firms seeking fully automated reporting.
Best Practices for Using This Dashboard
To get the most out of this template, update your case data regularly — ideally weekly or after major case milestones. Use the slicers on each page to focus on specific offices, time periods, or practice areas during partner meetings. Share the dashboard via Power BI Service with appropriate role-based access so that partners see firm-wide data while associates see their own performance metrics. Review the Financial Trend page monthly to catch expense anomalies early.
Explore Relevant Templates
If you found this dashboard useful, explore these related legal analytics templates from NextGenTemplates:
- Law Firm Performance Dashboard in Excel — The same powerful law firm analytics built entirely in Excel with pivot tables and slicers.
- Arbitration and Mediation Dashboard in Power BI — Monitor dispute resolution cases, claim amounts, and settlement outcomes with advanced analytics.
- Legal Dashboard in Google Sheets — Track legal cases, costs, and lawyer performance using cloud-based Google Sheets.
- Legal Dashboard in Power BI — Track legal cases, costs, and performance with interactive Power BI visuals and dynamic filters.
Also check out the full collection of Power BI Dashboard Templates and learn more about Power BI best practices on Microsoft Learn.
Frequently Asked Questions
What KPIs does the Law Firm Performance Dashboard in Power BI track?
The Law Firm Performance Dashboard in Power BI tracks 5 key performance indicators on the overview page: Total Cases, Total Billed, Total Collected, Average Satisfaction Score, and Realization Rate. Additional analysis pages provide breakdowns by attorney, practice area, client type, billing method, and monthly financial trends across 5 interactive dashboard pages.
Do I need advanced Power BI skills to use this law firm dashboard?
No. The dashboard comes pre-built with all visuals, slicers, and data connections configured. Simply replace the sample data with your own law firm records using Power Query, and all charts update automatically without any DAX editing required.
Can I filter the dashboard by specific offices or client types?
Yes. Every page includes interactive slicers that let you filter the entire dashboard by office location, client type, case priority, billing method, and time period. The filtered view applies instantly across all visuals on that page.
How many dashboard pages are included in this template?
This template includes 5 interactive dashboard pages — Overview, Attorney Analysis, Practice Insights, Client Analysis, and Financial Trend — each designed to provide focused insights into different aspects of law firm operations and performance.
What is the best Power BI template for tracking law firm performance?
The Law Firm Performance Dashboard in Power BI from NextGenTemplates is one of the most comprehensive options available. It covers billing, collections, attorney productivity, practice area revenue, client analysis, and financial trends across 5 interactive pages with dynamic slicers and drill-through capabilities.
Is this template available in Excel or Google Sheets?
Yes. NextGenTemplates offers the Law Firm Performance Dashboard in Excel as well. For a Google Sheets alternative, check out the Legal Dashboard in Google Sheets.
Conclusion
The Law Firm Performance Dashboard in Power BI is a must-have analytics tool for any law firm or legal department looking to gain complete visibility into billing, collections, attorney productivity, and financial performance. With 5 interactive pages, dynamic slicers, and pre-built KPI cards, this template transforms raw legal data into actionable insights within minutes. Download it today and take control of your firm’s performance.
👉 Click here to Purchase the Law Firm Performance Dashboard in Power BI
🎥 Visit our YouTube channel for step-by-step video tutorials:
👉 Youtube.com/@PK-AnExcelExpert